Tao Shiyuan, Yu Yi, Xiao Wenbin, Zhang Weimin, Zhao Yanlai. Analysis of the distribution of sound velocity profiles and sound propagation laws based on a global high-resolution ocean reanalysis product[J]. Acta Oceanologica Sinica.
Citation:
Tao Shiyuan, Yu Yi, Xiao Wenbin, Zhang Weimin, Zhao Yanlai. Analysis of the distribution of sound velocity profiles and sound propagation laws based on a global high-resolution ocean reanalysis product[J]. Acta Oceanologica Sinica.
Tao Shiyuan, Yu Yi, Xiao Wenbin, Zhang Weimin, Zhao Yanlai. Analysis of the distribution of sound velocity profiles and sound propagation laws based on a global high-resolution ocean reanalysis product[J]. Acta Oceanologica Sinica.
Citation:
Tao Shiyuan, Yu Yi, Xiao Wenbin, Zhang Weimin, Zhao Yanlai. Analysis of the distribution of sound velocity profiles and sound propagation laws based on a global high-resolution ocean reanalysis product[J]. Acta Oceanologica Sinica.
School of Meteorology and Oceanography, National University of Defense Technology, Changsha 410073, China
Funds:
the National Natural Science Foundation of China under contract No. 42075149 and the Key Research and Development Program of China under contract No.2021YFC101500.
Ocean reanalysis data, compared to traditional observational data, possess stronger continuity and higher data accuracy. The globally high-resolution ice–ocean coupled reanalysis product CORA v2.0 (China Ocean ReAnalysis, Version 2.0), independently developed by the National Marine Information Center, has attracted considerable attention since its release in 2020. This paper selected six representative points of sound velocity profiles in different global ocean regions and conducted comparative analysis between the 2014 momentary data from CORA v2.0 and Argo data. Additionally, the monthly average data of CORA v2.0 in 2013 were compared and studied against GDEM (General Digital Environmental Model) and WOA (World Ocean Atlas) data. Metrics such as RMSE and ME were introduced to evaluate the differences between datasets. The study found that, in a comparison of single moment data, the sound velocity profiles of CORA v2.0 data and Argo data exhibit high consistency, with ME generally within 2 m/s. Regarding a comparison of monthly average data, the consistency between CORA v2.0 data and WOA data is higher, while the error relative to GDEM data is relatively larger, but their RMSE and ME exhibit high similarity in temporal trends. Based on the 2014 data of CORA v2.0, the temporal and spatial evolutionary laws of global seawater sound velocity profiles and sound velocity fields were analyzed. On the time scale, the variation of seawater sound velocity is mainly influenced by seasons, with significant differences between winter and summer seasons. On the daily scale, there are certain differences in sound velocity profiles mainly in the early morning and afternoon. On the spatial scale, analysis was conducted from both horizontal and vertical perspectives. The distribution of sound velocity exhibits evident regularity with latitude, with shallow seawater sound velocity being greatly influenced by external factors while deep seawater is relatively stable. Using the RAMgeo model to solve the underwater acoustic field at three specific points, the characteristic changes of sound velocity profiles at different times of the day and their impact on under water sound propagation losses were obtained. This study provides valuable information for the application of CORA v2.0 data products.
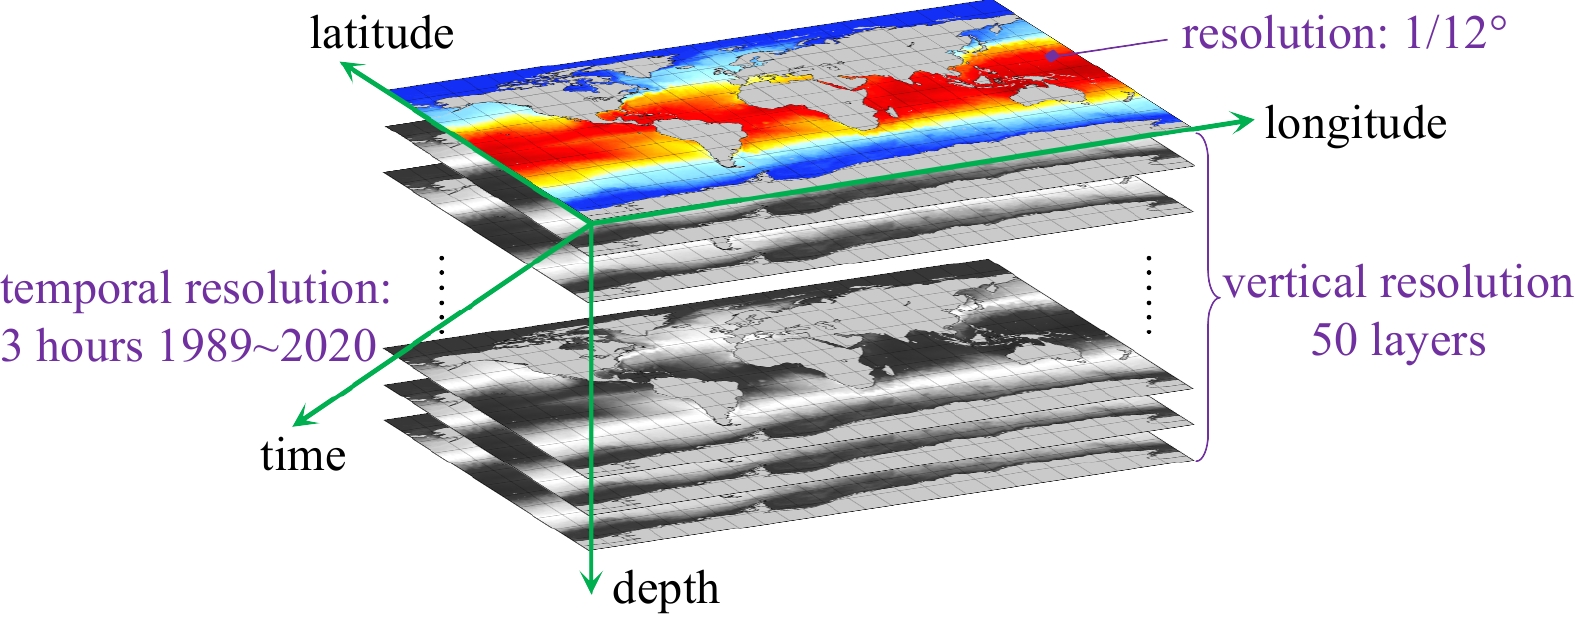
Figure 1. Global high-resolution ocean reanalysis product CORA v2.0 data information.
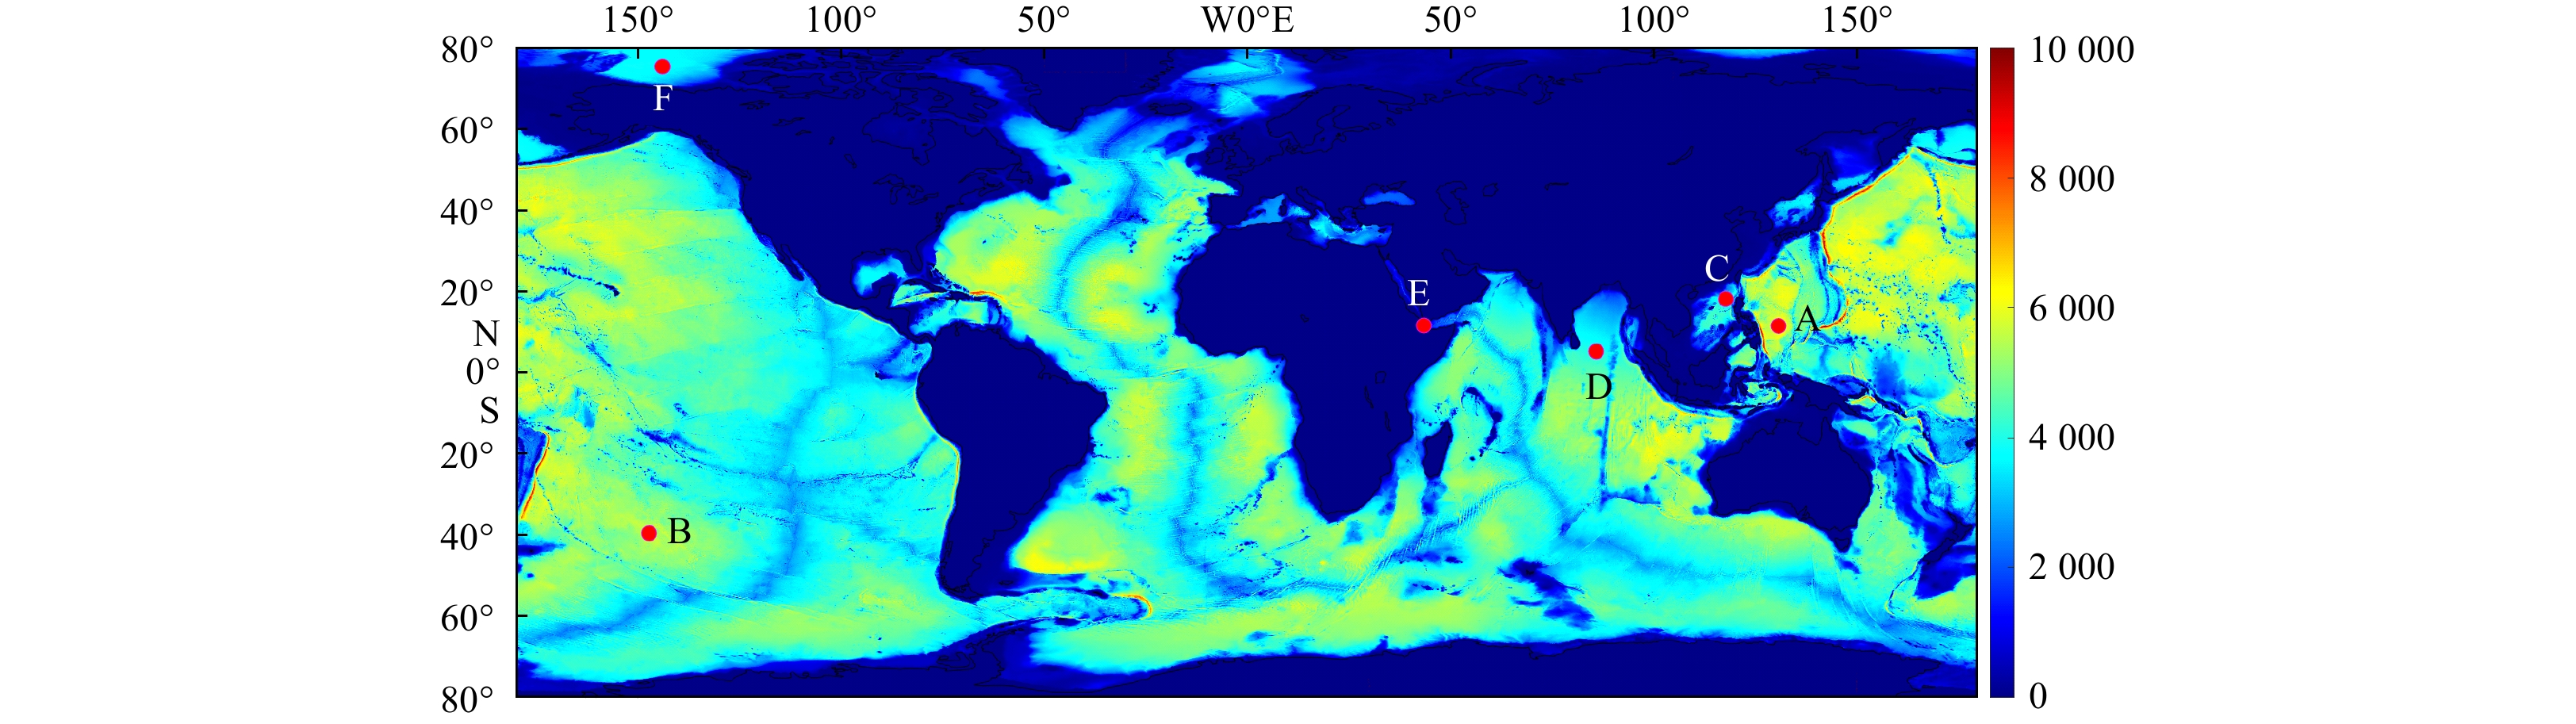
Figure 2. Distribution map of the six points.
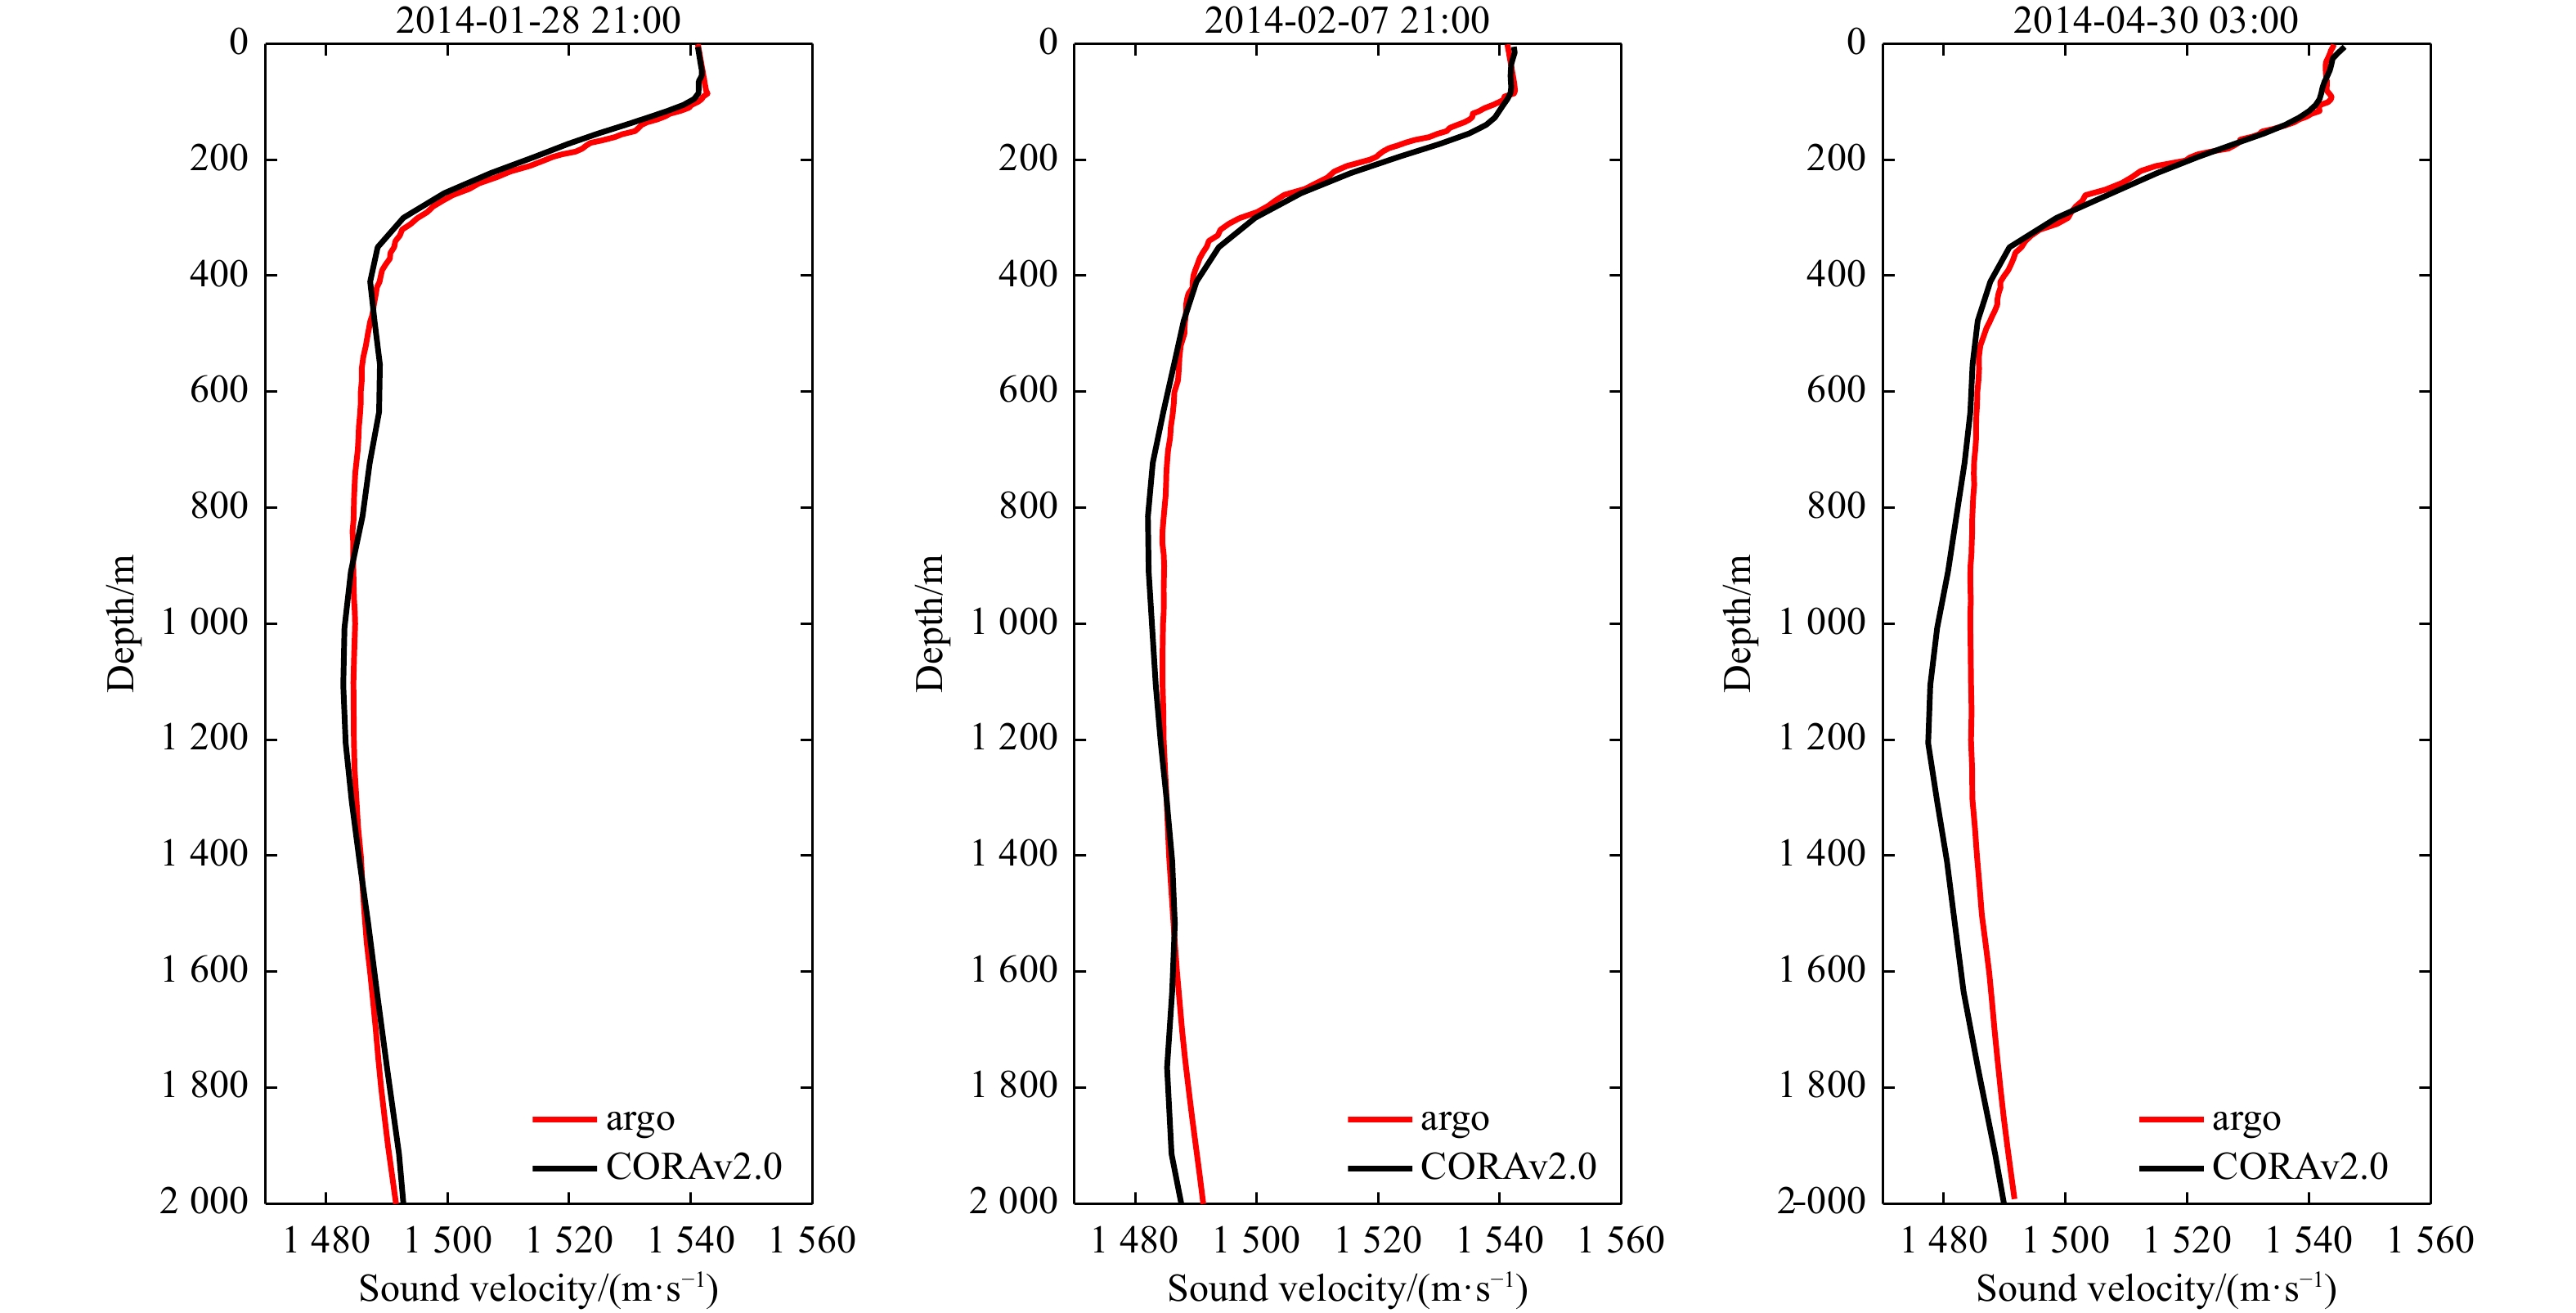
Figure 3. Sound speed profiles of Argo and CORAv2.0 at Point A (130.95E, 11.55N) in the western Pacific Ocean for three time instances: January 28, 2014, 21:00; February 7, 2014, 21:00; and April 30, 2014, 03:00.
Figure 4. Sound speed profiles of Argo and CORAv2.0 at Point C (117.95E, 18.15N) in the South China Sea for three time instances: June 11, 2014, 21:00; November 22, 2014, 21:00; and December 4, 2014, 21:00.
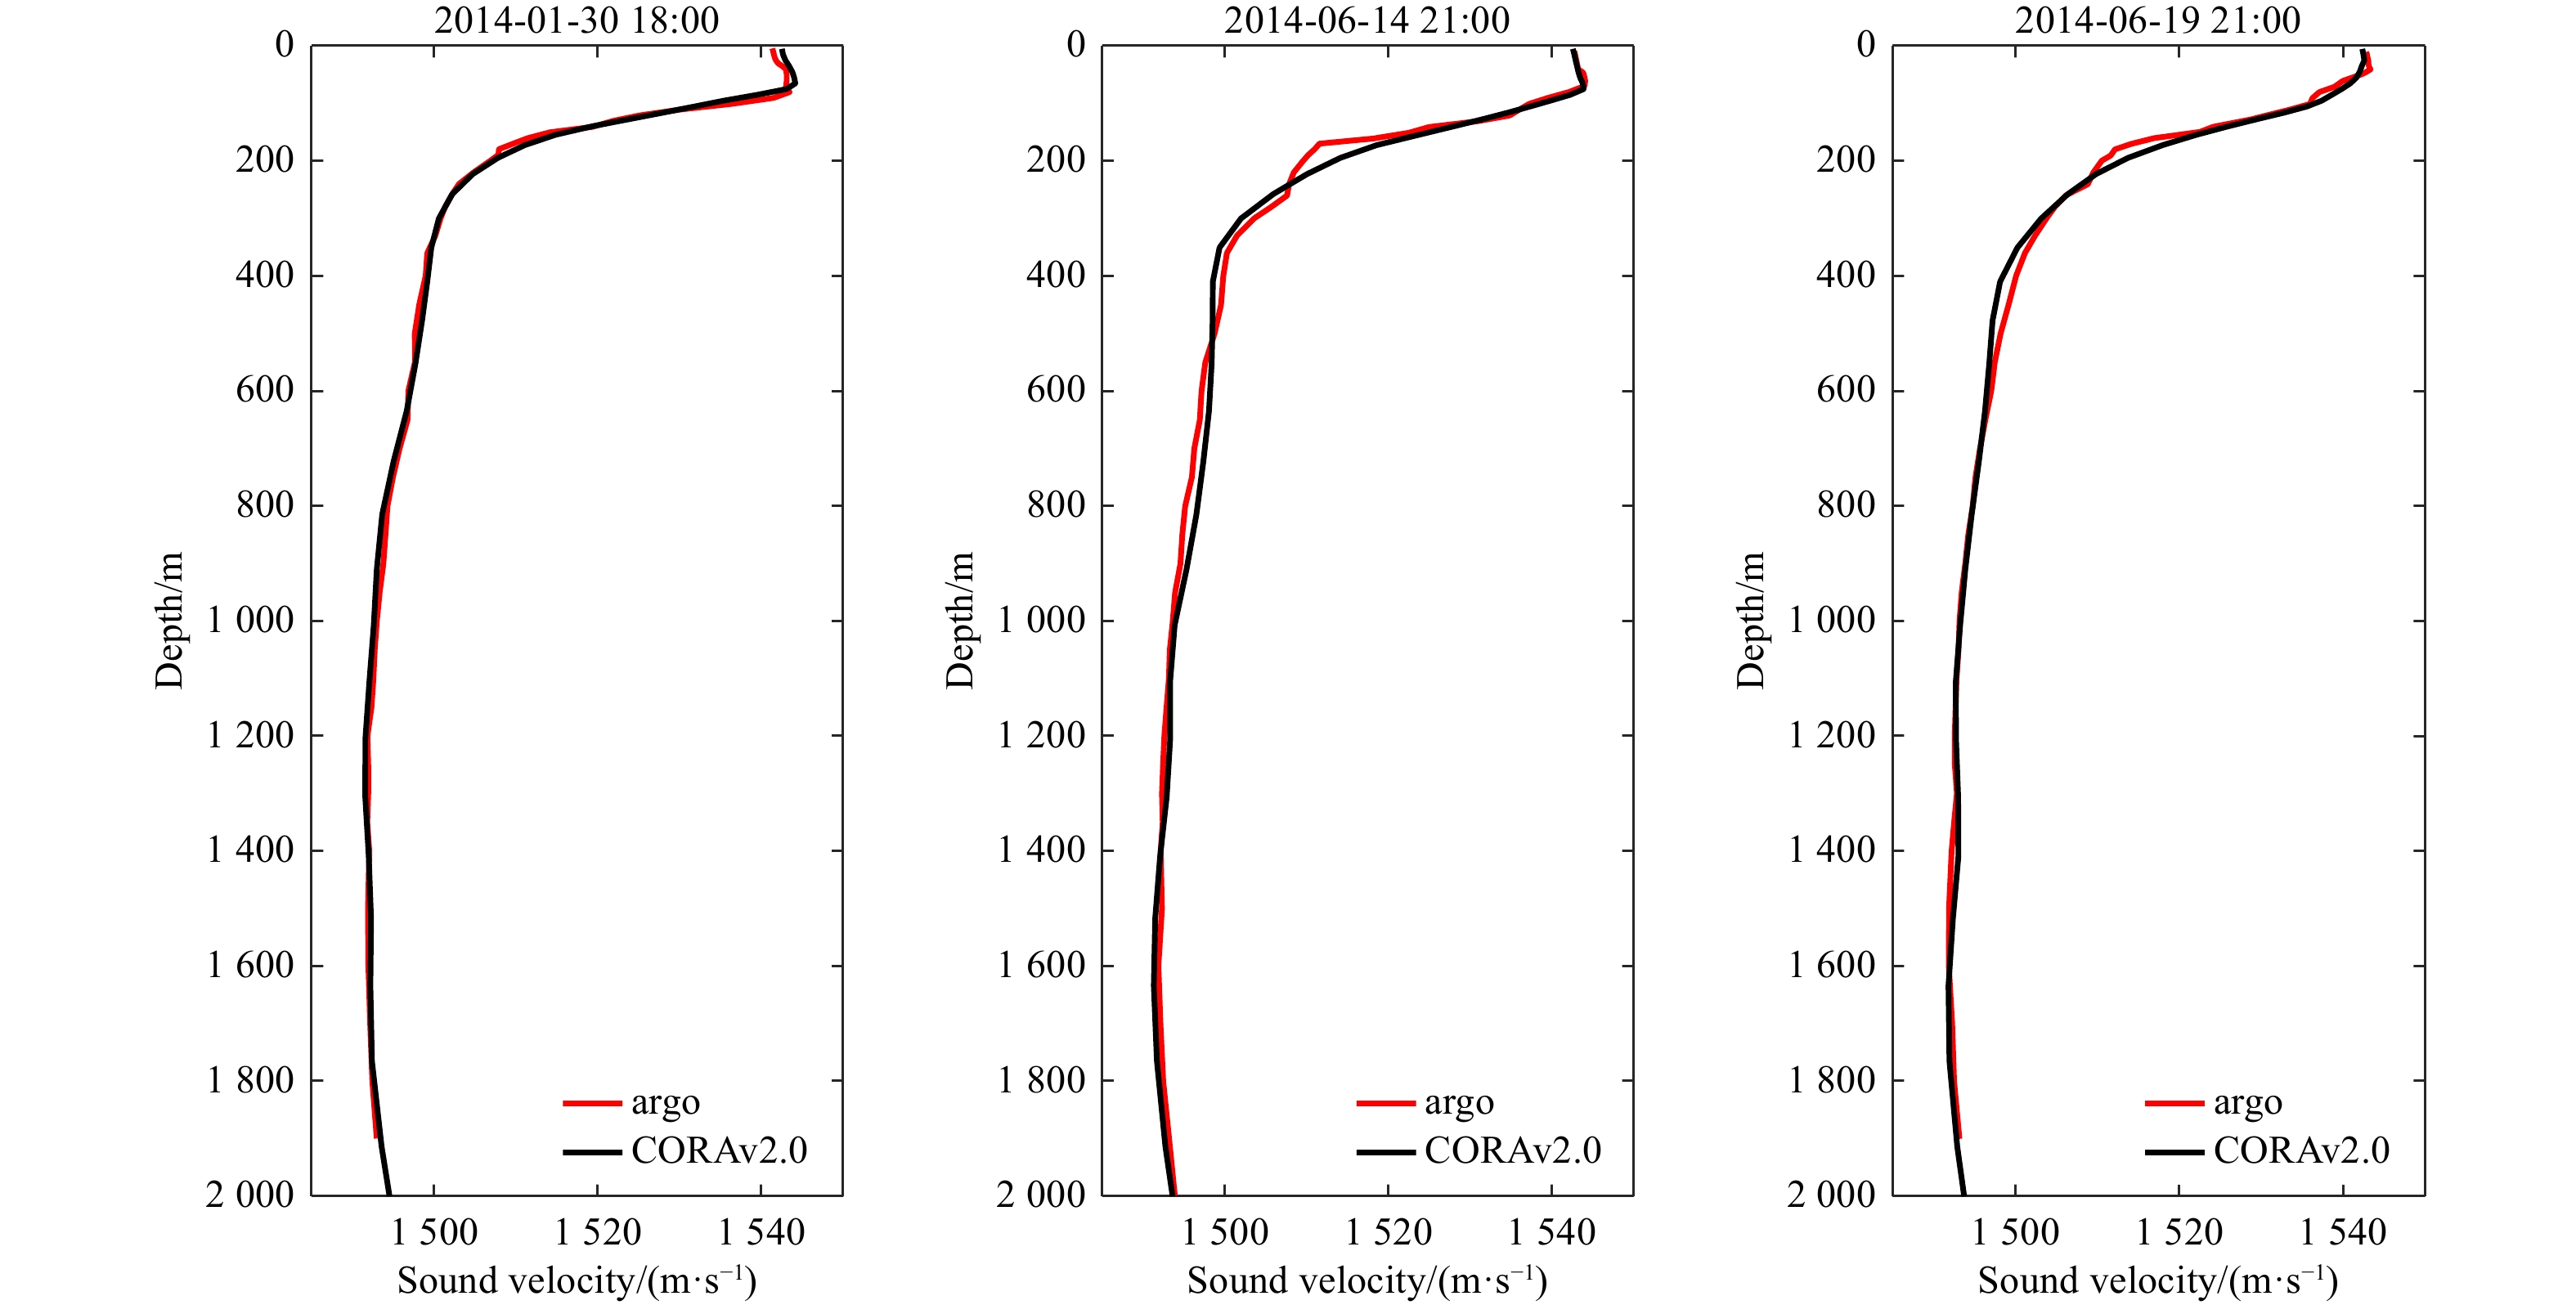
Figure 5. At three time points, 18:00 on January 30, 2014, 21:00 on June 14, 2014, and 18:00 on June 19, 2014, the Argo and CORAv2.0 sound velocity profiles at Point D (5.25°N, 86.05°E) in the Indian Ocean.
Figure 6. Variation of sound speed deviation with depth for different months at Point A (11.55°N, 130.95°E) in the western Pacific Ocean, calculated by subtracting the CORA v2.0 dataset from the WOA dataset (a). Variation of sound speed deviation with both month and depth, calculated by subtracting the CORA v2.0 dataset from the GDEM dataset (b).
Figure 7. Average sound speed offset and mean square error between CORA v2.0 and WOA and GDEM datasets at Point A in the western Pacific Ocean for 2013.
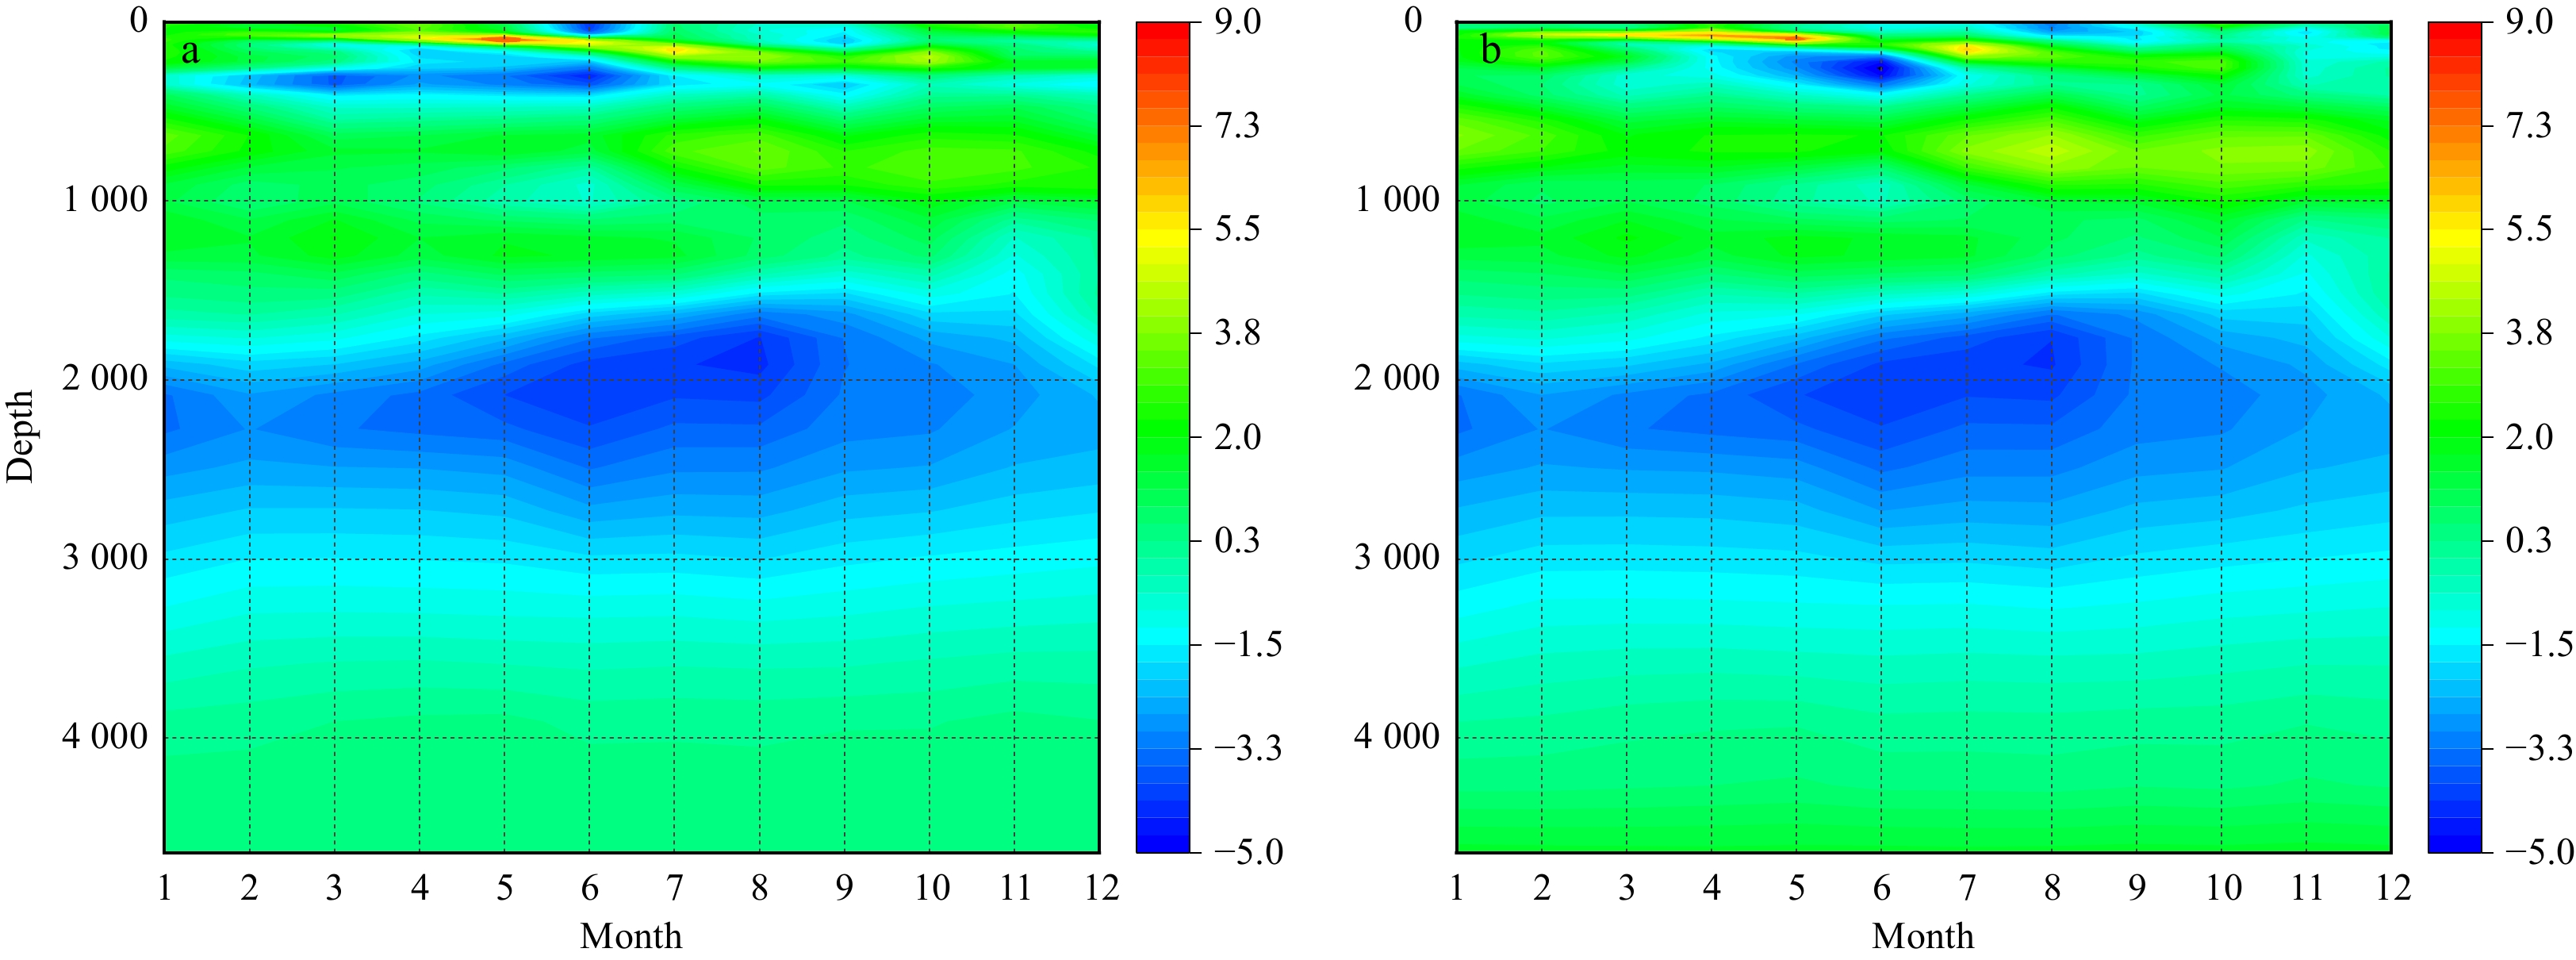
Figure 8. Variation of sound speed deviation with depth for different months at Point B (39.55°S, 147.35°W) in the South Pacific Ocean, calculated by subtracting the CORA v2.0 dataset from the WOA dataset (a). Variation of sound speed deviation with both month and depth, calculated by subtracting the CORA v2.0 dataset from the GDEM dataset (b).
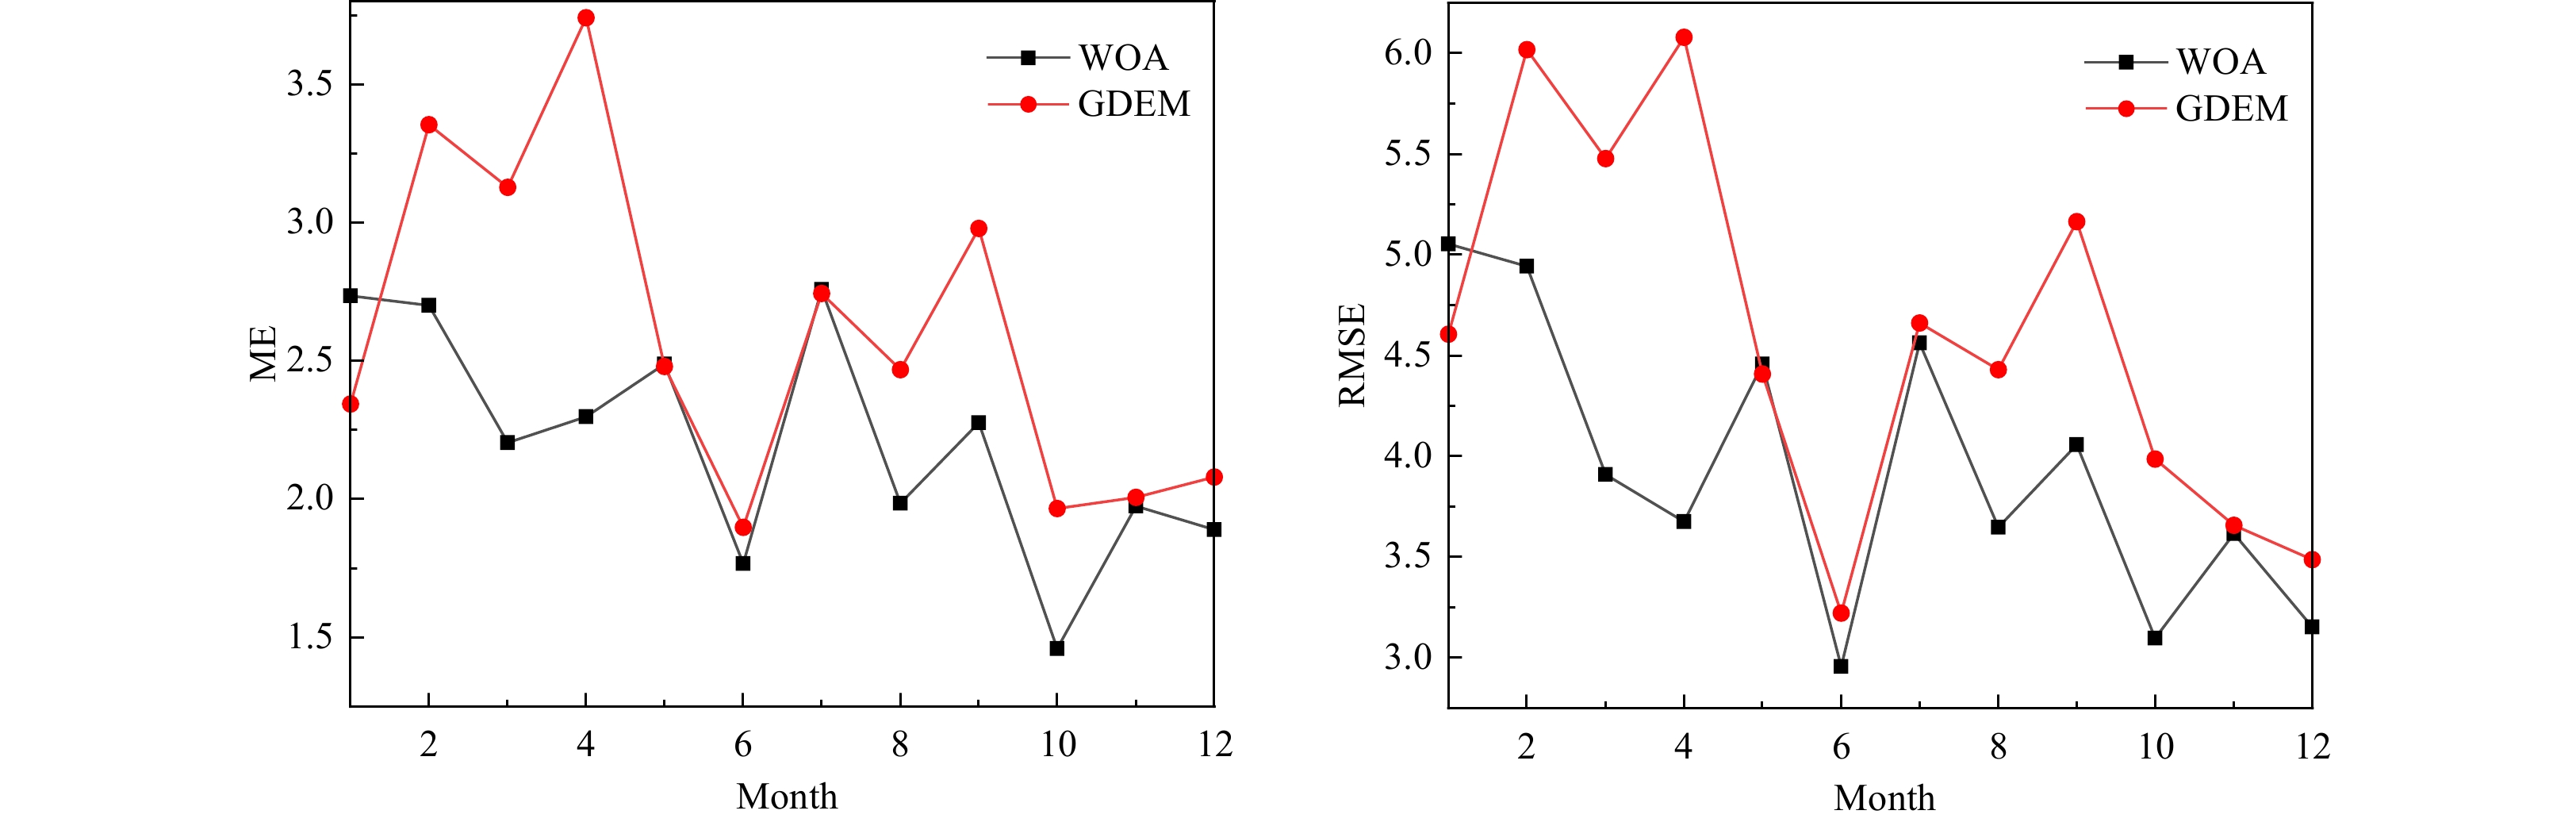
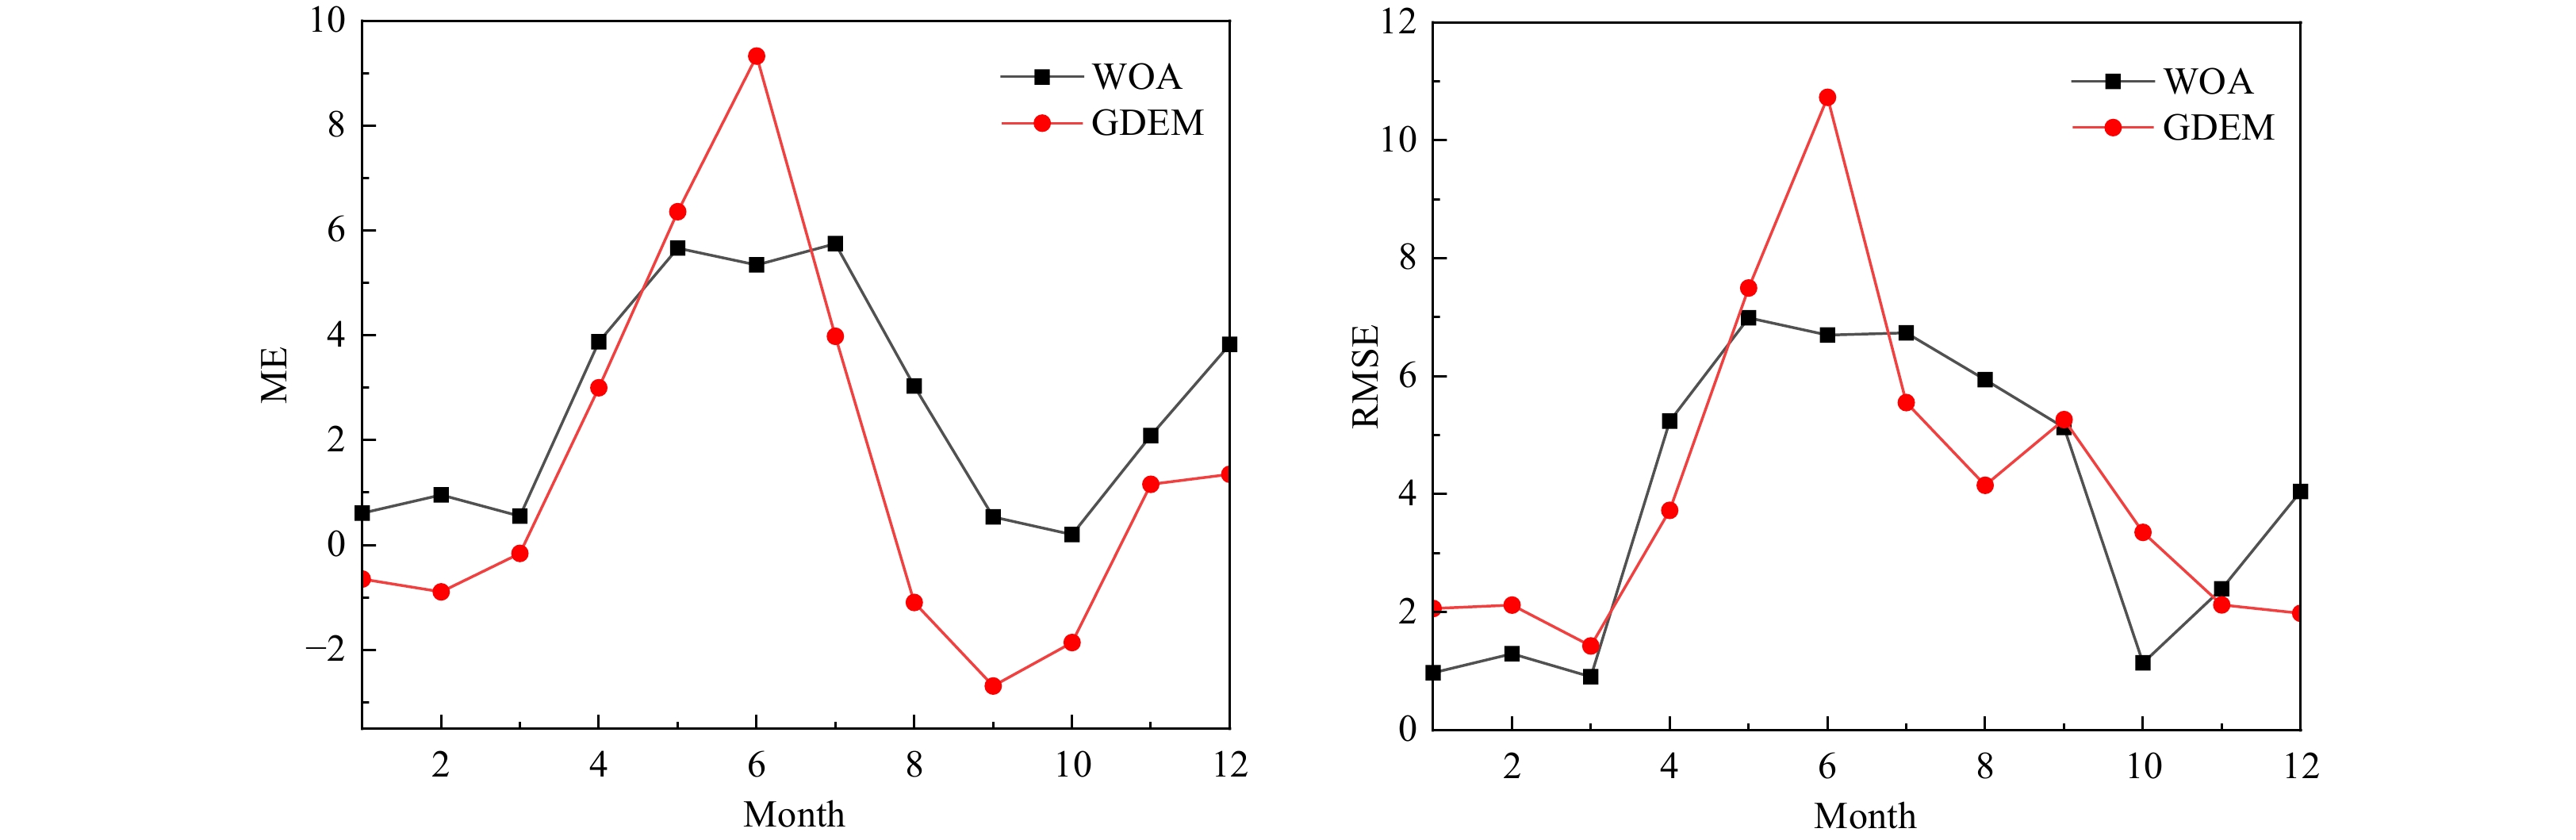
Figure 9. Average sound speed offset (a) and mean square error (b) between CORA v2.0 and WOA and GDEM datasets at Point A in the western Pacific Ocean for 2013.
Figure 10. Variation of sound speed deviation with depth for different months at Point C (18.15°N, 117.95°E) in the South China Sea, calculated by subtracting the CORA v2.0 dataset from the WOA dataset (a). Variation of sound speed deviation with both month and depth, calculated by subtracting the CORA v2.0 dataset from the GDEM dataset (b).
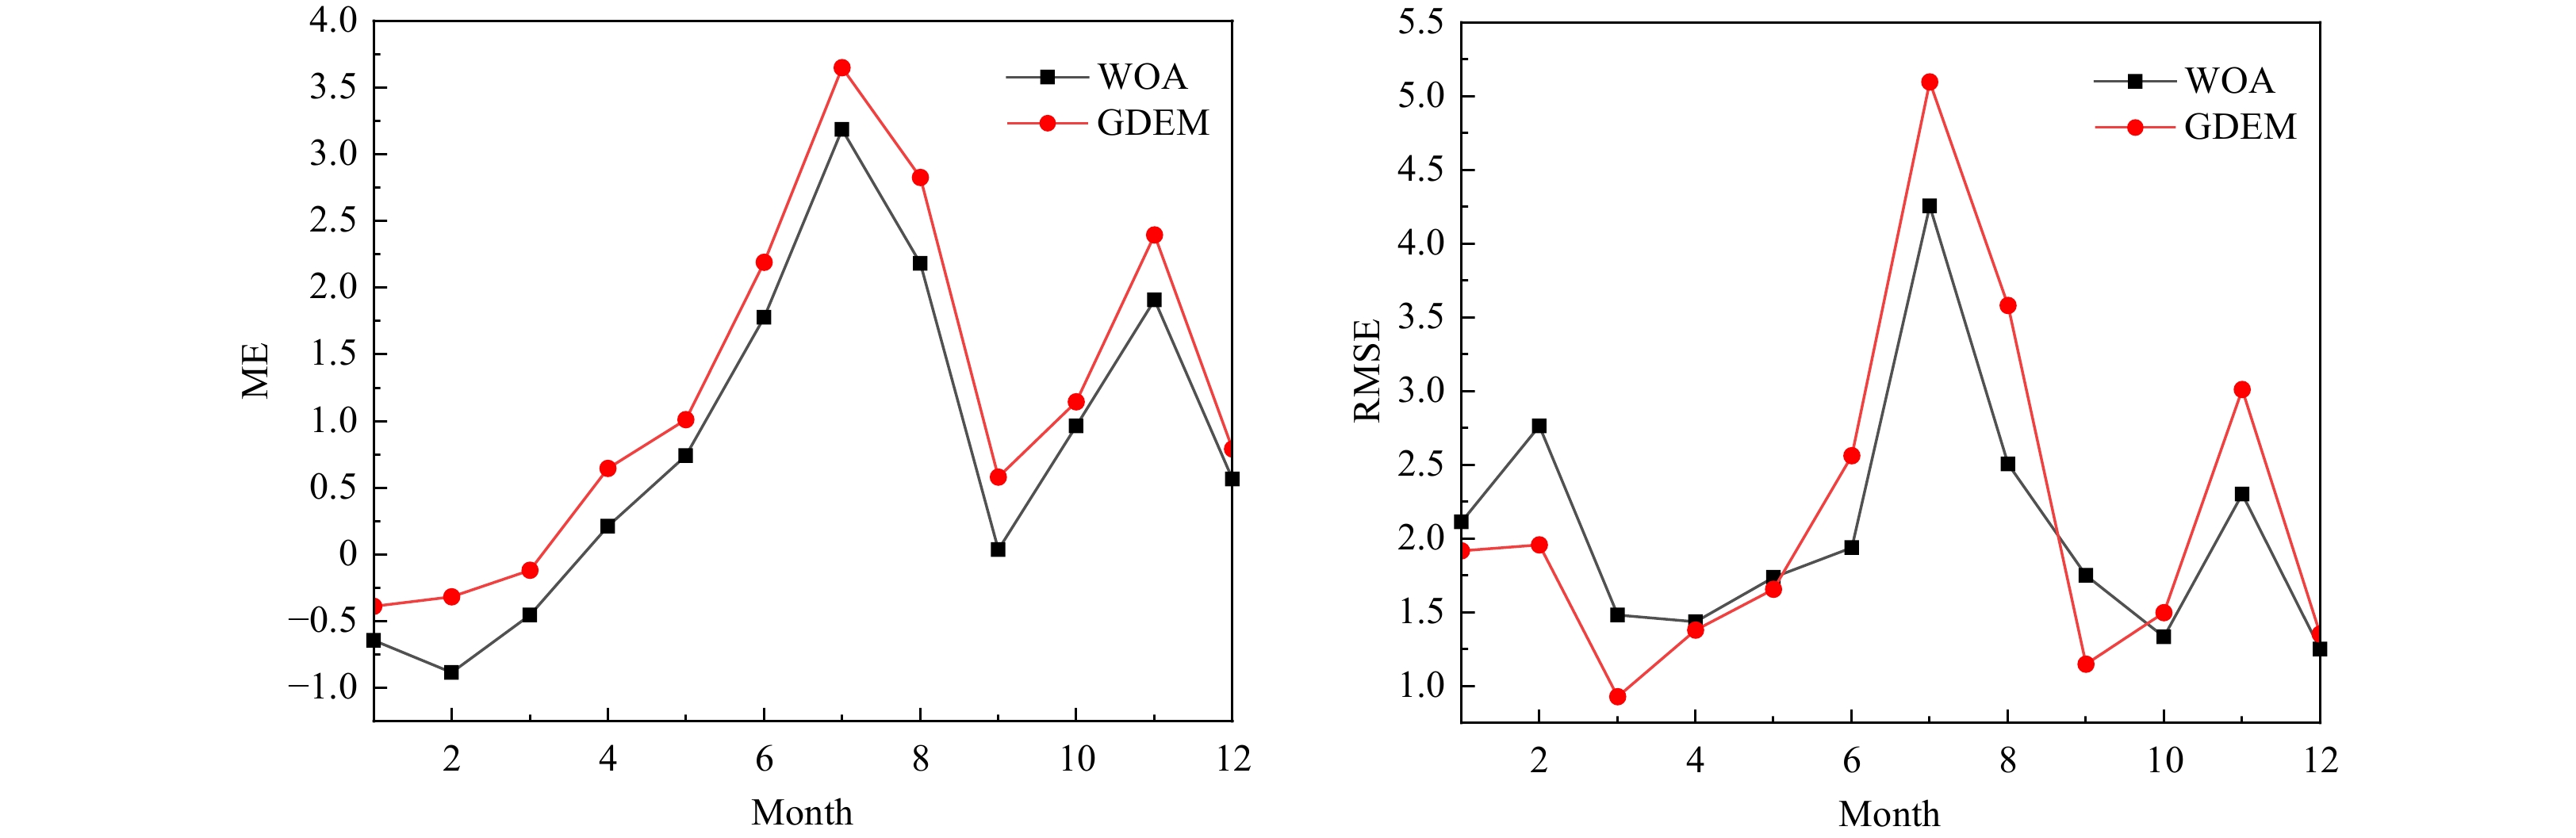
Figure 11. Average sound speed offset and mean square error between CORA v2.0 and WOA and GDEM datasets at Point C in the South China Sea for 2013.
Figure 12. Variation of sound speed deviation with depth for different months at Point D (5.25°N, 86.05°E) in the Indian Ocean, calculated by subtracting the CORA v2.0 dataset from the WOA dataset (a). Variation of sound speed deviation with both month and depth, calculated by subtracting the CORA v2.0 dataset from the GDEM dataset (b).
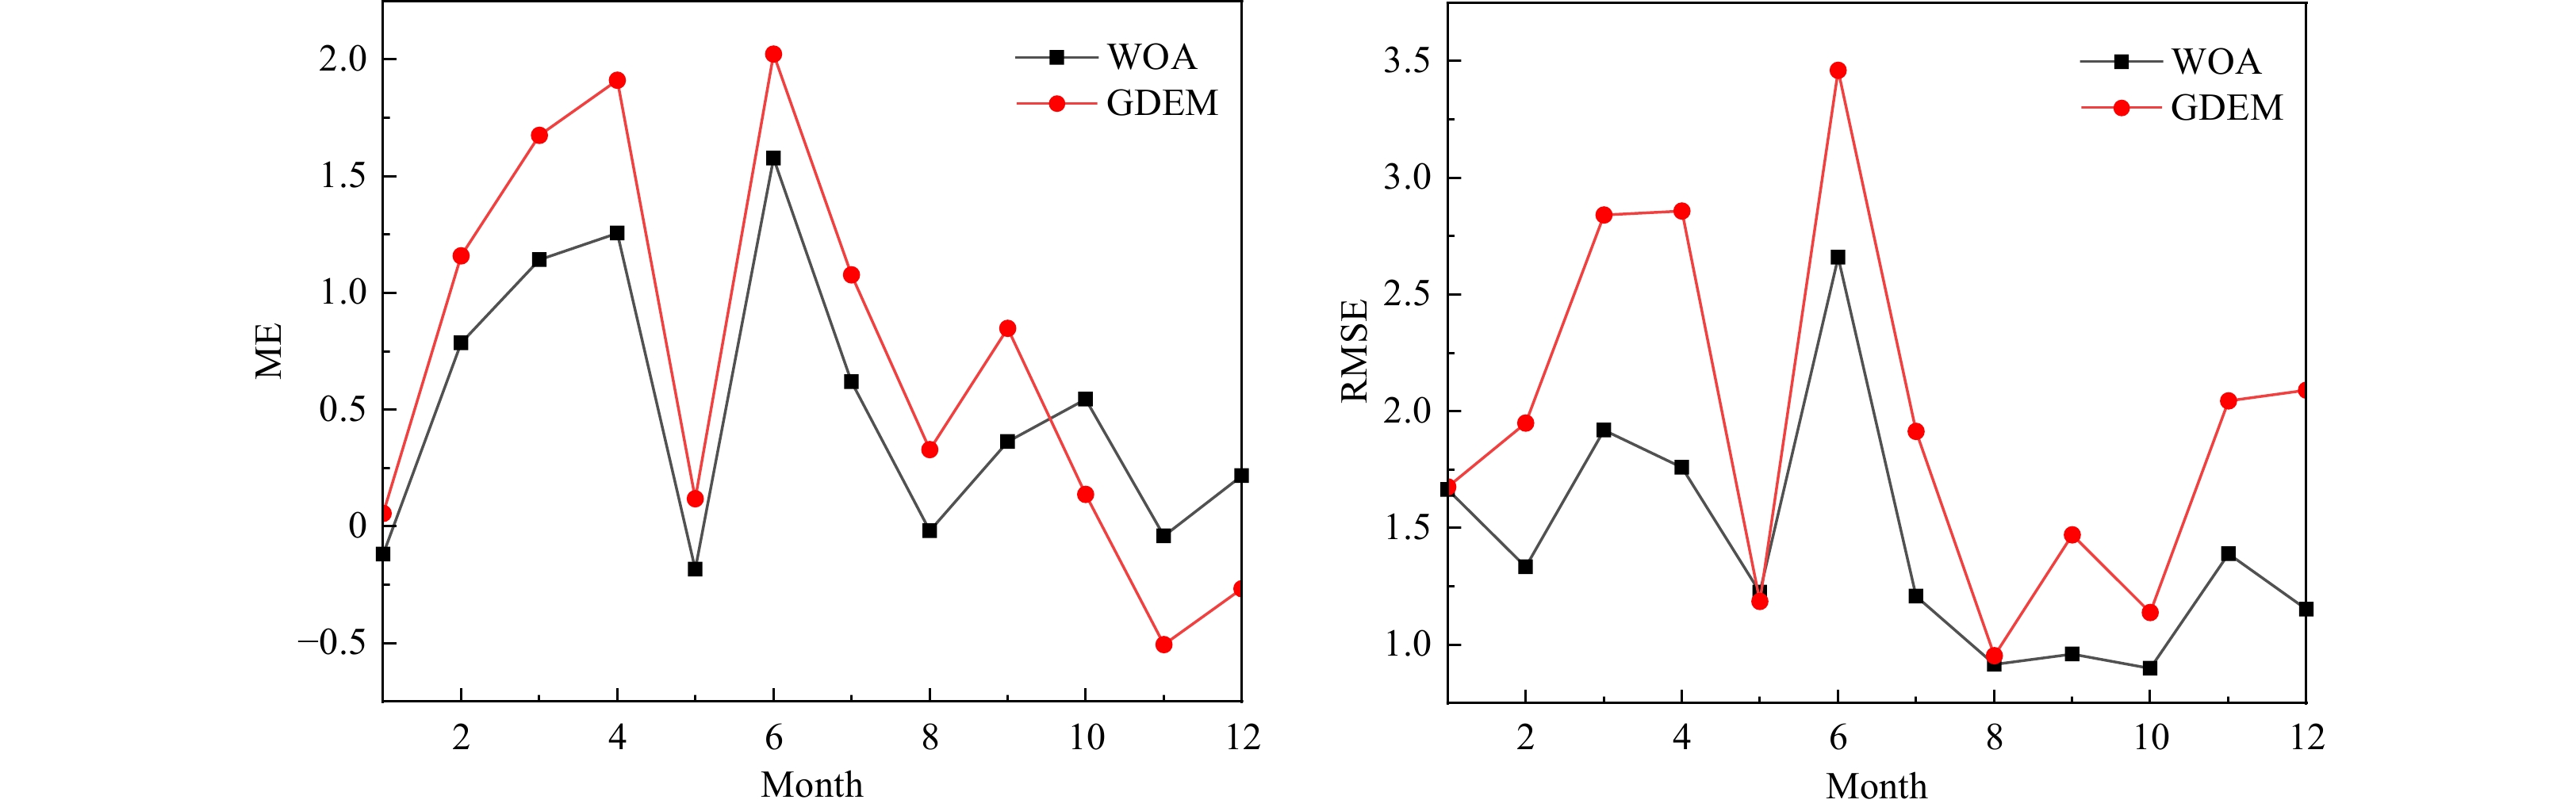
Figure 13. Average sound speed offset and mean square error between CORA v2.0 and WOA and GDEM datasets at Point D in the Indian Ocean for 2013.
Figure 14. Variation of sound speed deviation with depth for different months at Point E (11.65°N, 43.55°E) in the Gulf of Aden, calculated by subtracting the CORA v2.0 dataset from the WOA dataset (a). Variation of sound speed deviation with both month and depth, calculated by subtracting the CORA v2.0 dataset from the GDEM dataset (b).
Figure 15. Average sound speed offset and mean square error between CORA v2.0 and WOA and GDEM datasets at Point E in the Gulf of Aden for 2013.
Figure 16. Variation of sound speed deviation with depth for different months at Point F (75.45°N, 144.05°W) in the Arctic Ocean, calculated by subtracting the CORA v2.0 dataset from the WOA dataset (a). Variation of sound speed deviation with both month and depth, calculated by subtracting the CORA v2.0 dataset from the GDEM dataset (b).
Figure 17. Average sound speed offset and mean square error between CORA v2.0 and WOA and GDEM datasets at Point F in the Arctic Ocean for 2013.
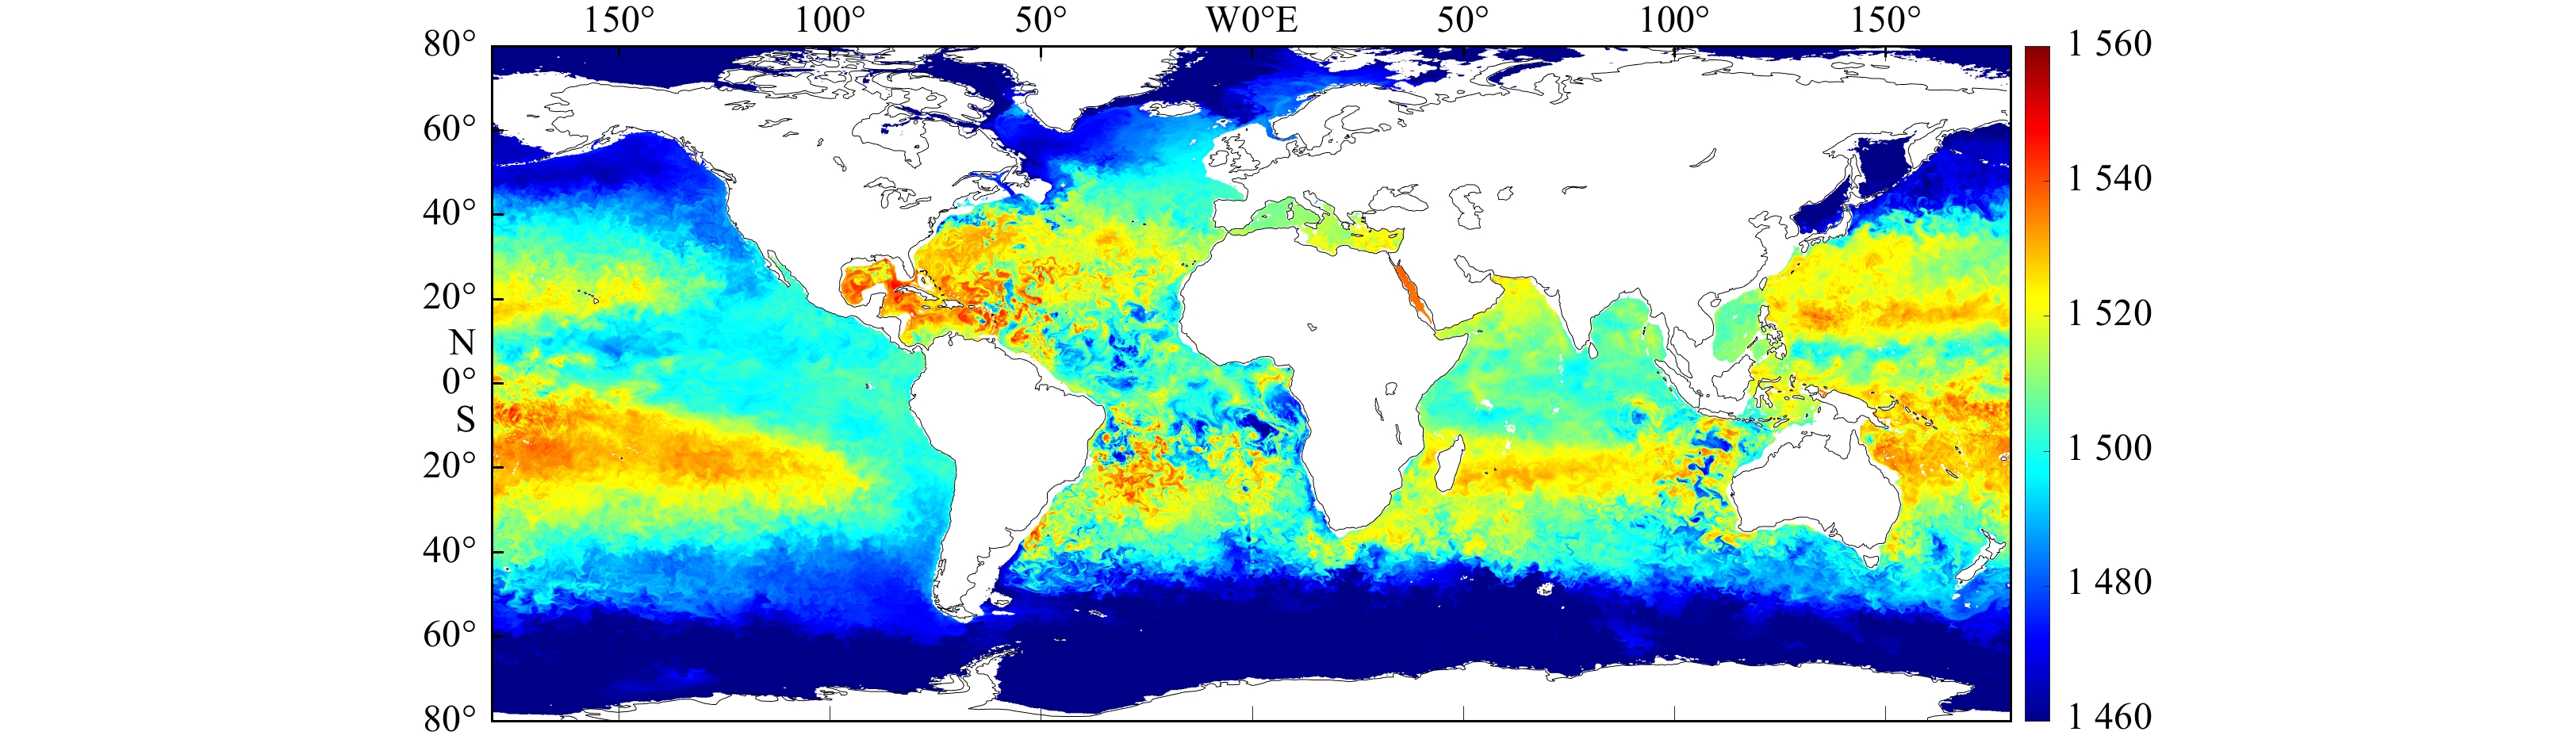
Figure 18. Sound speed distribution at a 25-m depth in the global ocean on January 15, 2014, at 12:00.
Figure 19. Sound speed distribution at a105-m depth in the global ocean on January 15, 2014, at 12:00.
Figure 20. Sound speed distribution at a 195-m depth in the global ocean on January 15, 2014, at 12:00.
Figure 21. Sound speed distribution at a 1 005-m depth in the global ocean on January 15, 2014, at 12:00.
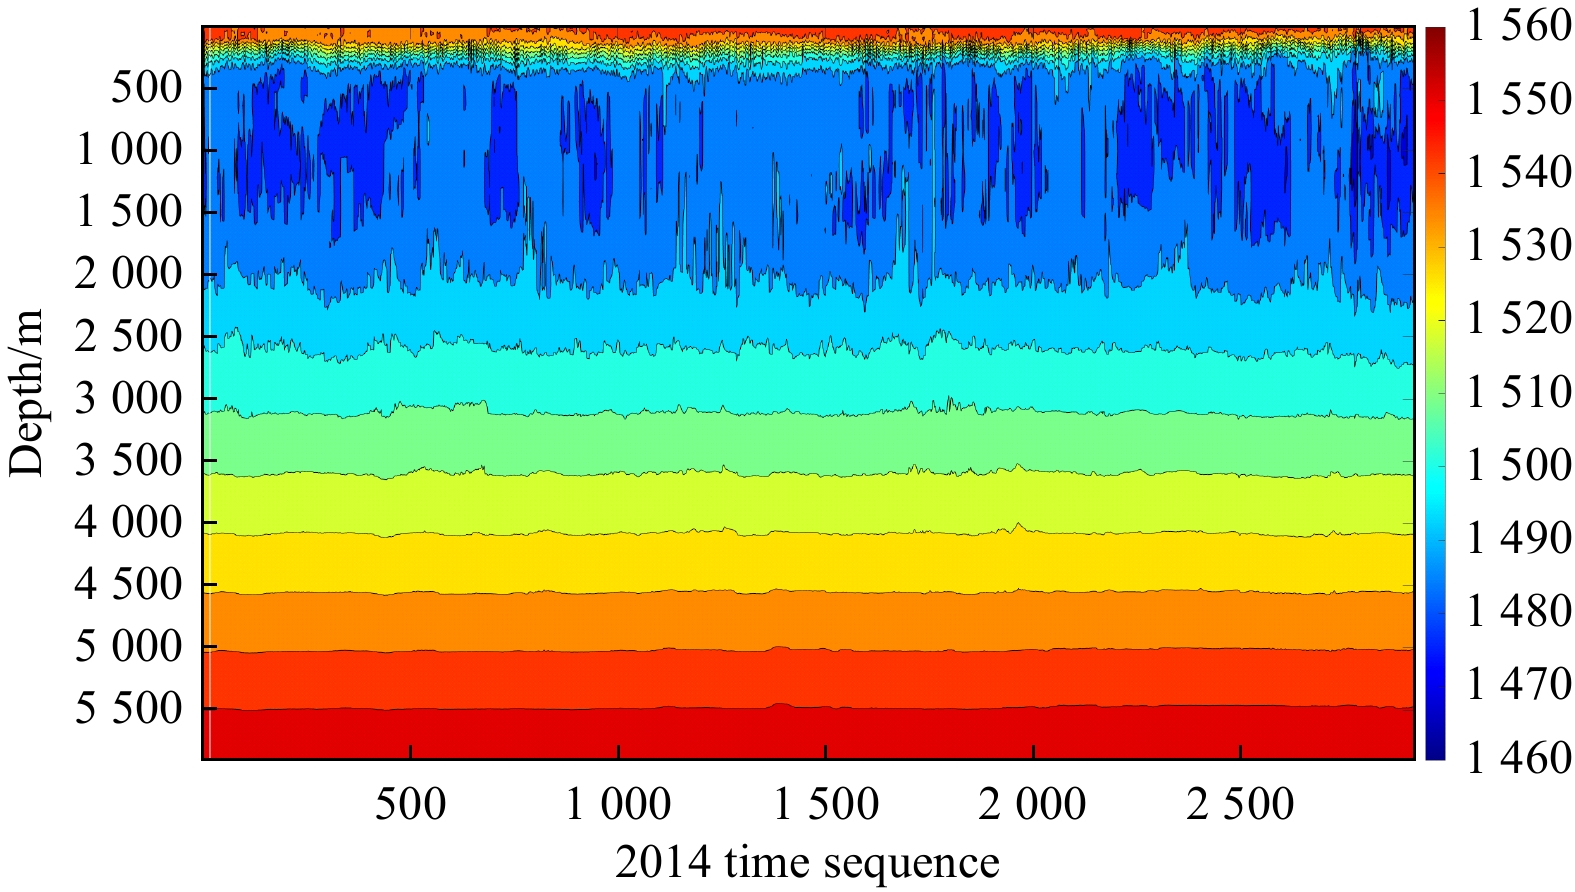
Figure 22. Sound speed profiles at Point A for all 2,920 time instances throughout 2014.
Figure 23. Sound speed profiles at Point B for all 2 920 time instances throughout 2014.
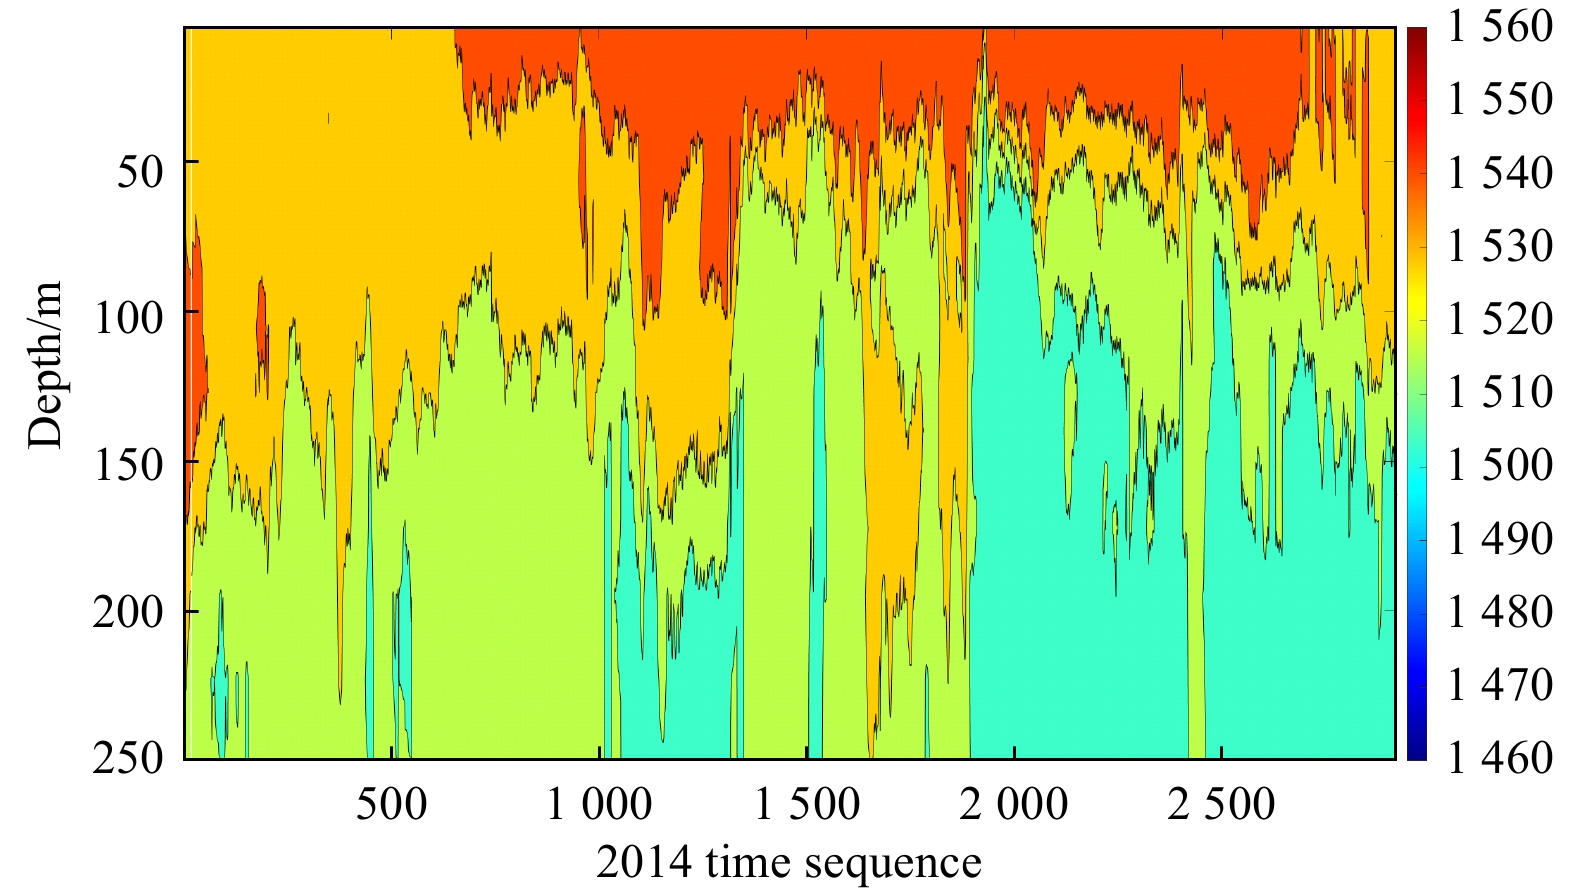
Figure 24. Sound speed profiles at Point C for all 2 920 time instances throughout 2014.
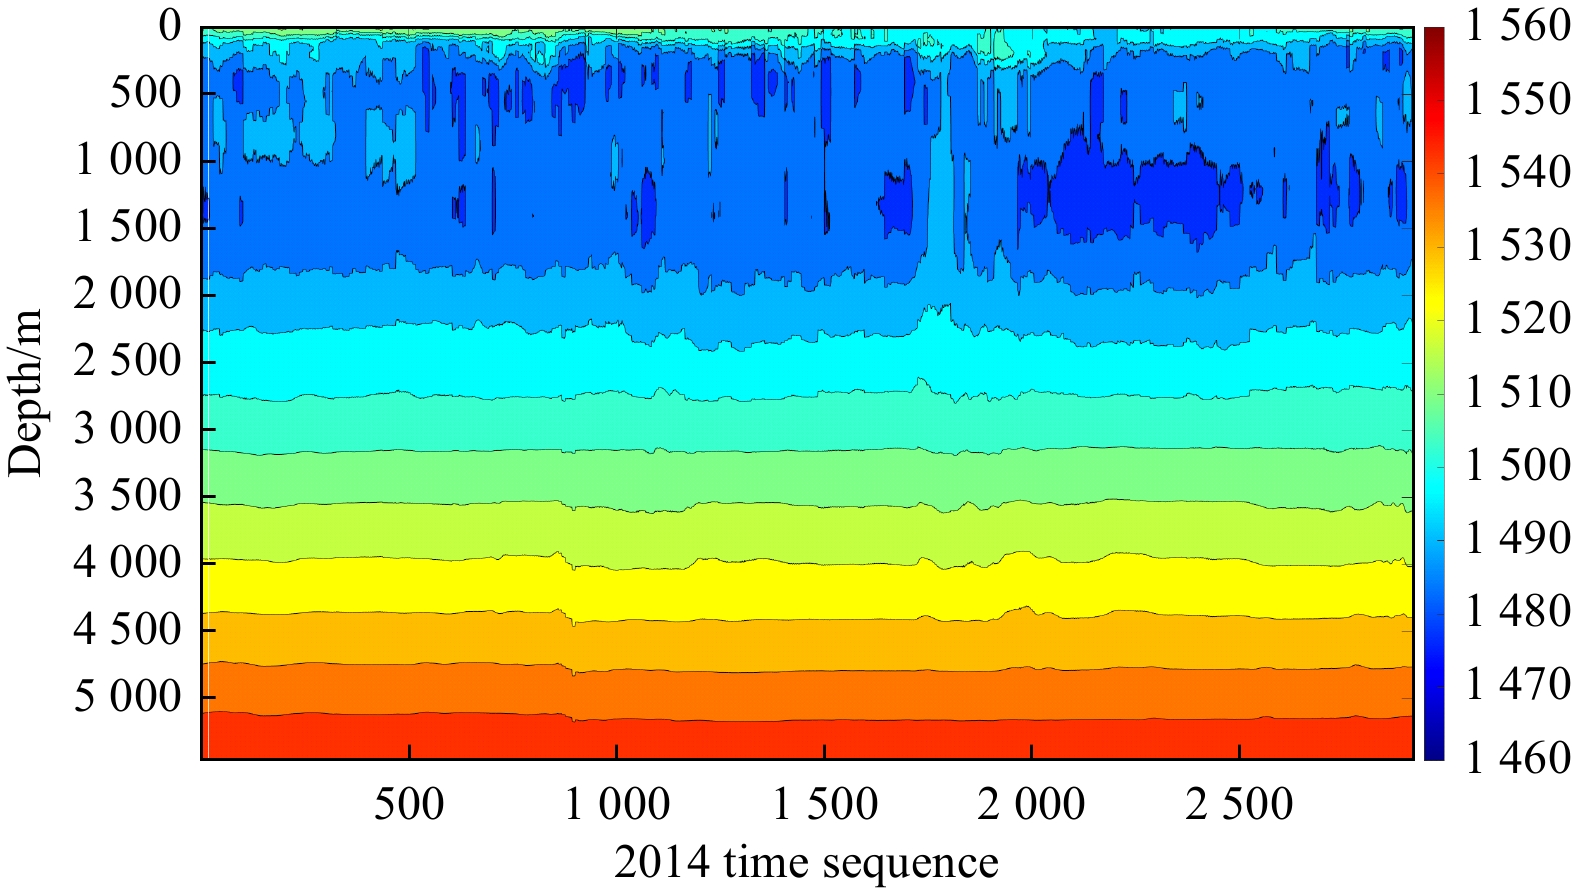
Figure 25. Sound speed profiles at Point D for all 2 920 time instances throughout 2014.
Figure 26. Sound speed profiles at Point E for all 2 920 time instances throughout 2014.
Figure 27. Sound speed profiles at Point D for all 2 920 time instances throughout 2014.
Figure 28. Sound speed value standardized deviation of three water layers at Point A (a). Sound speed value standardized deviation of three water layers at Point B (b). Sound speed value standardized deviation of three water layers at Point C (c). Sound speed value standardized deviation of three water layers at Point D (d). Sound speed value standardized deviation of three water layers at Point E (e). Sound speed value standardized deviation of three water layers at Point F (f)
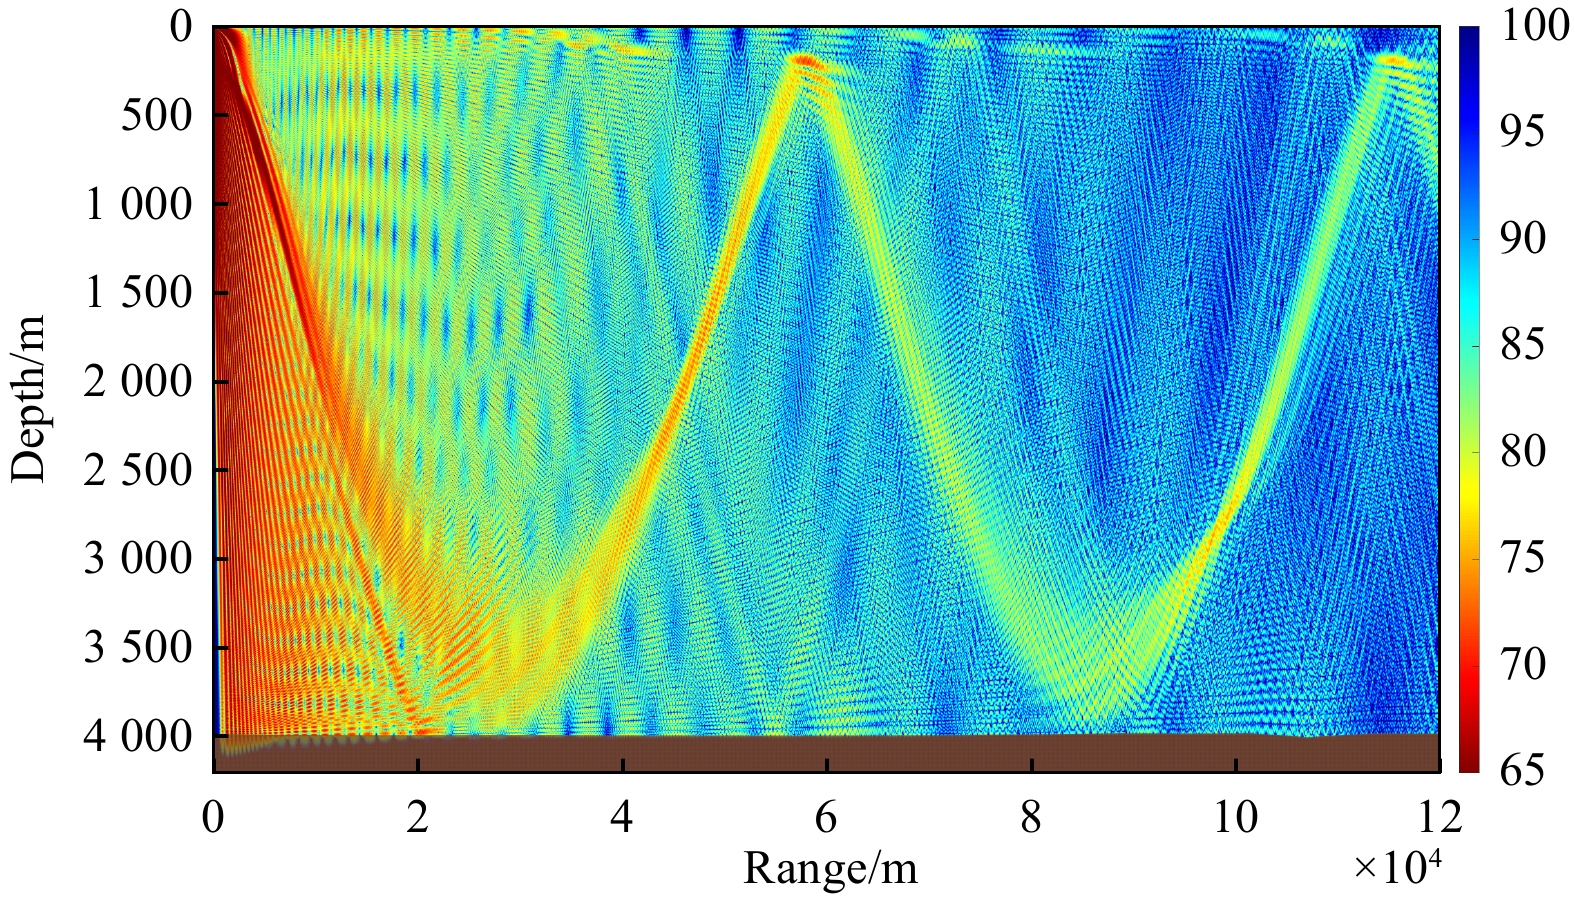
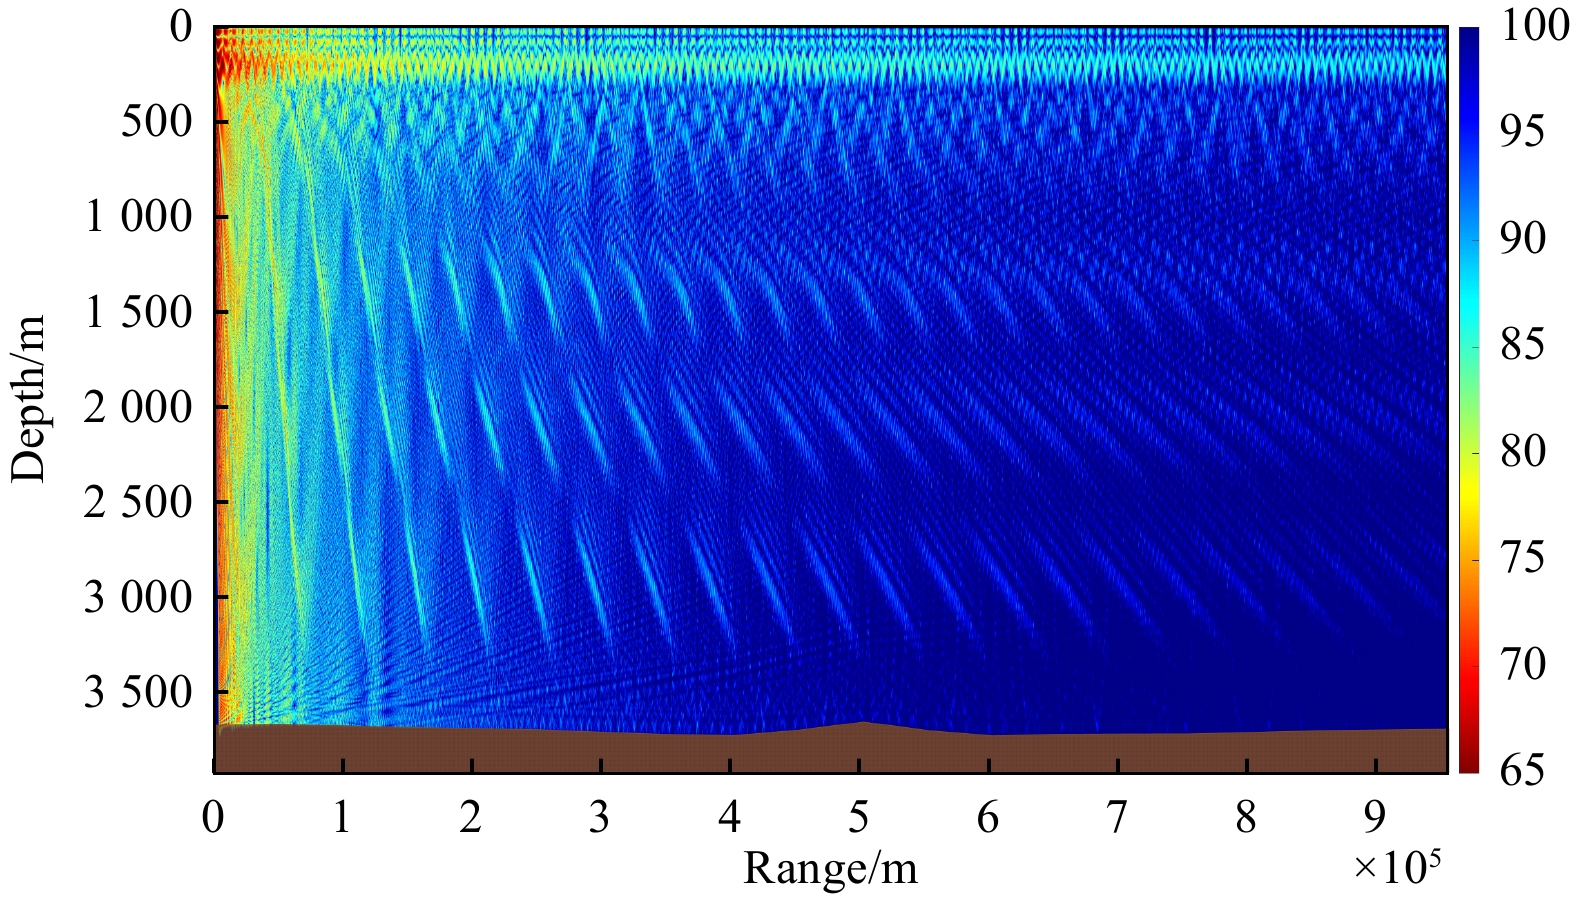
Figure 29. Sound propagation loss at Point C in the South China Sea at 12:00 on January 15th, 2014.
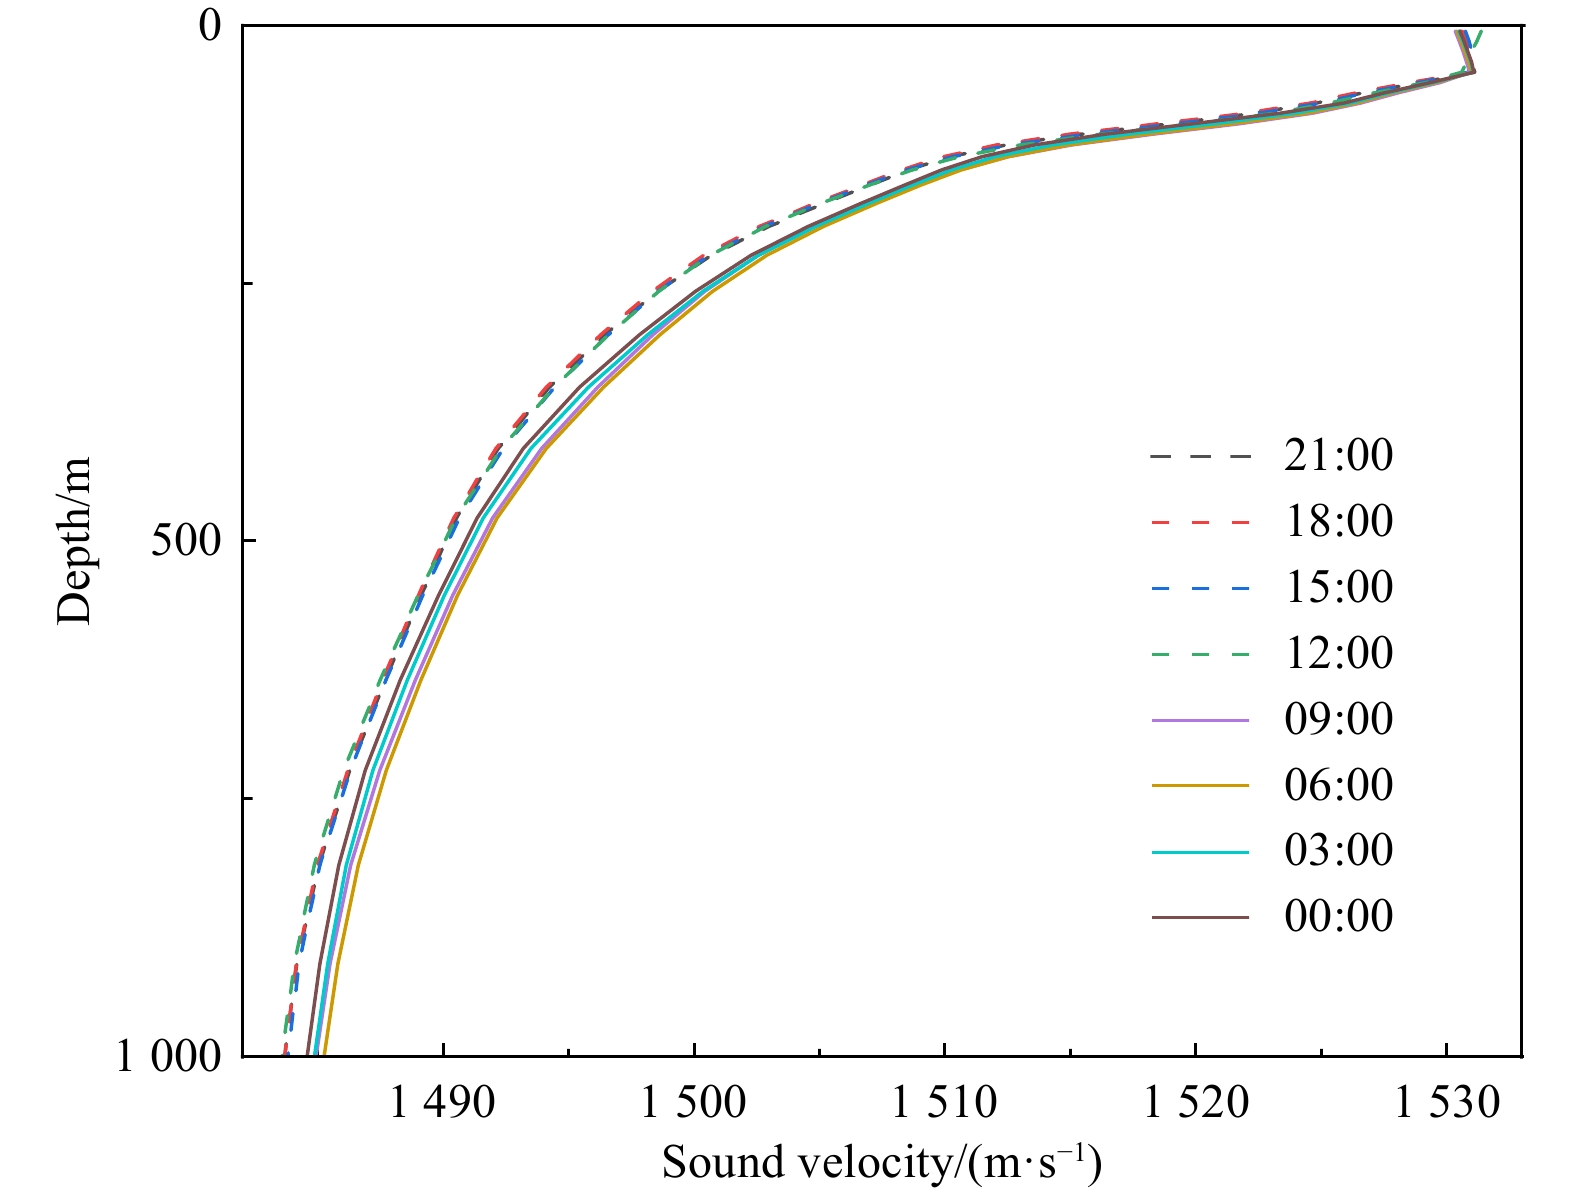
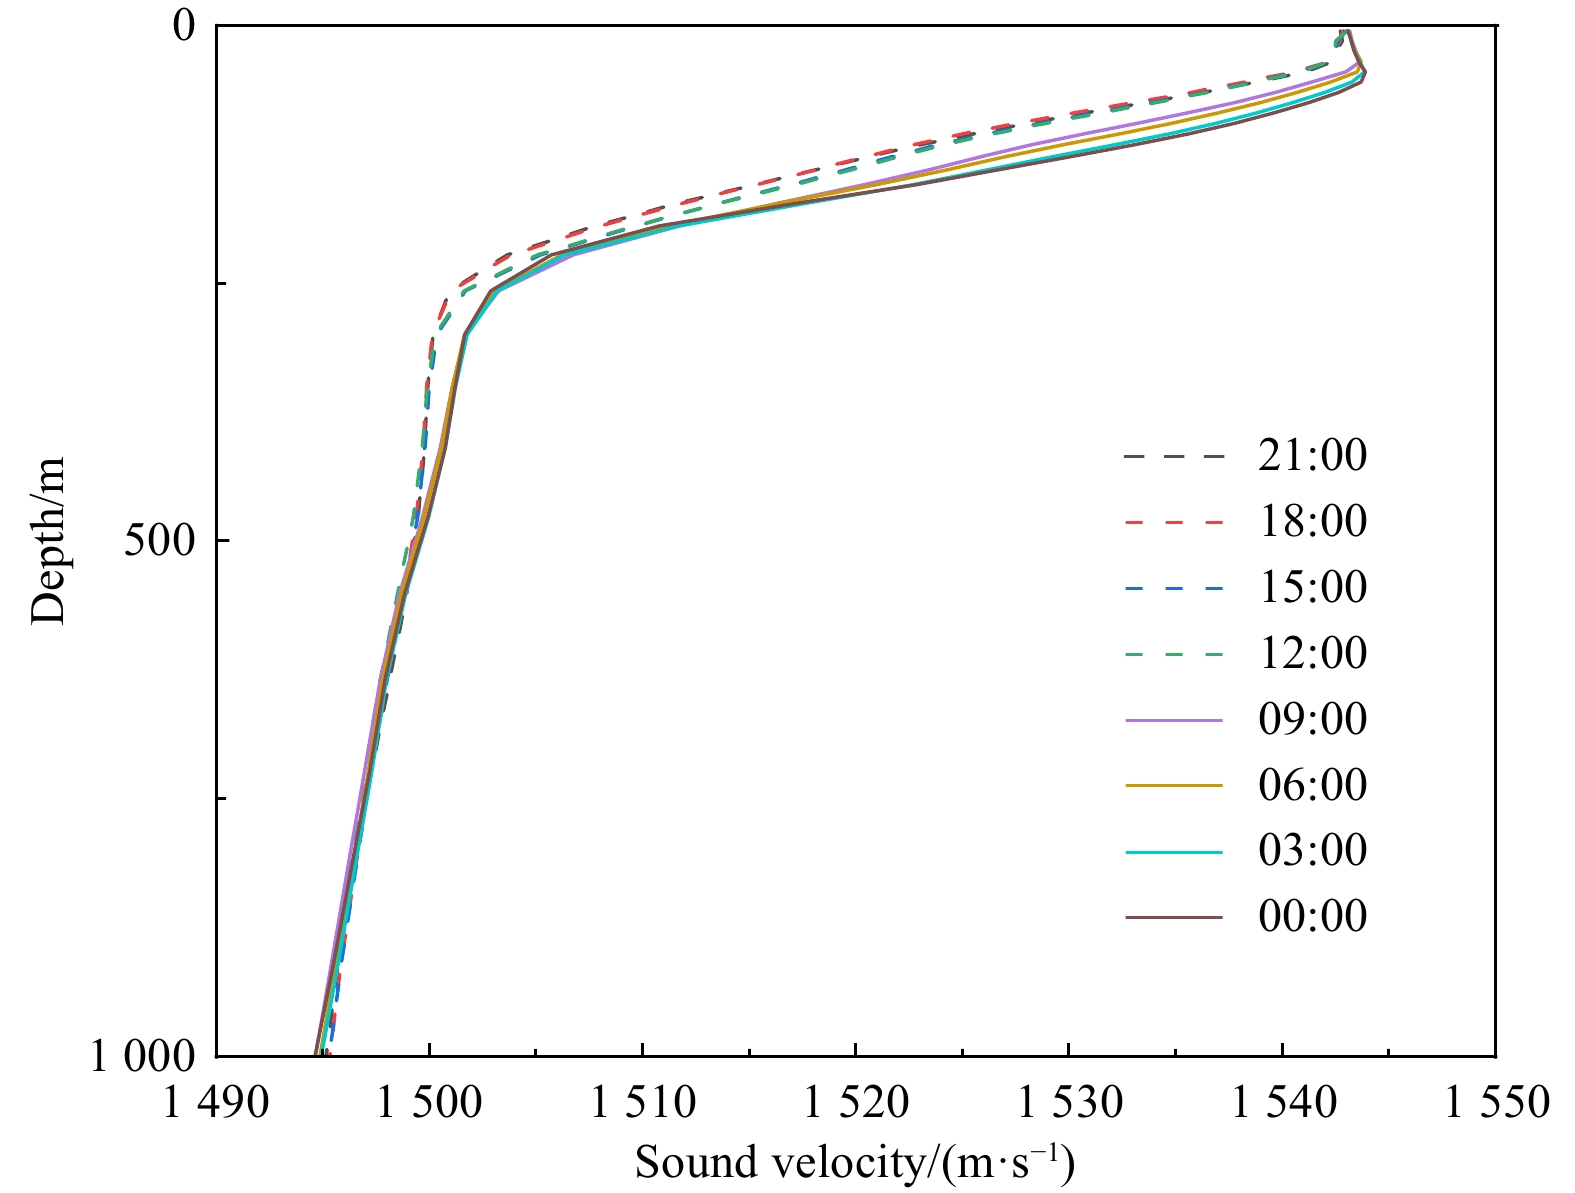
Figure 30. Variation of sound speed profile at Point C in the South China Sea at different times on January 15, 2014.
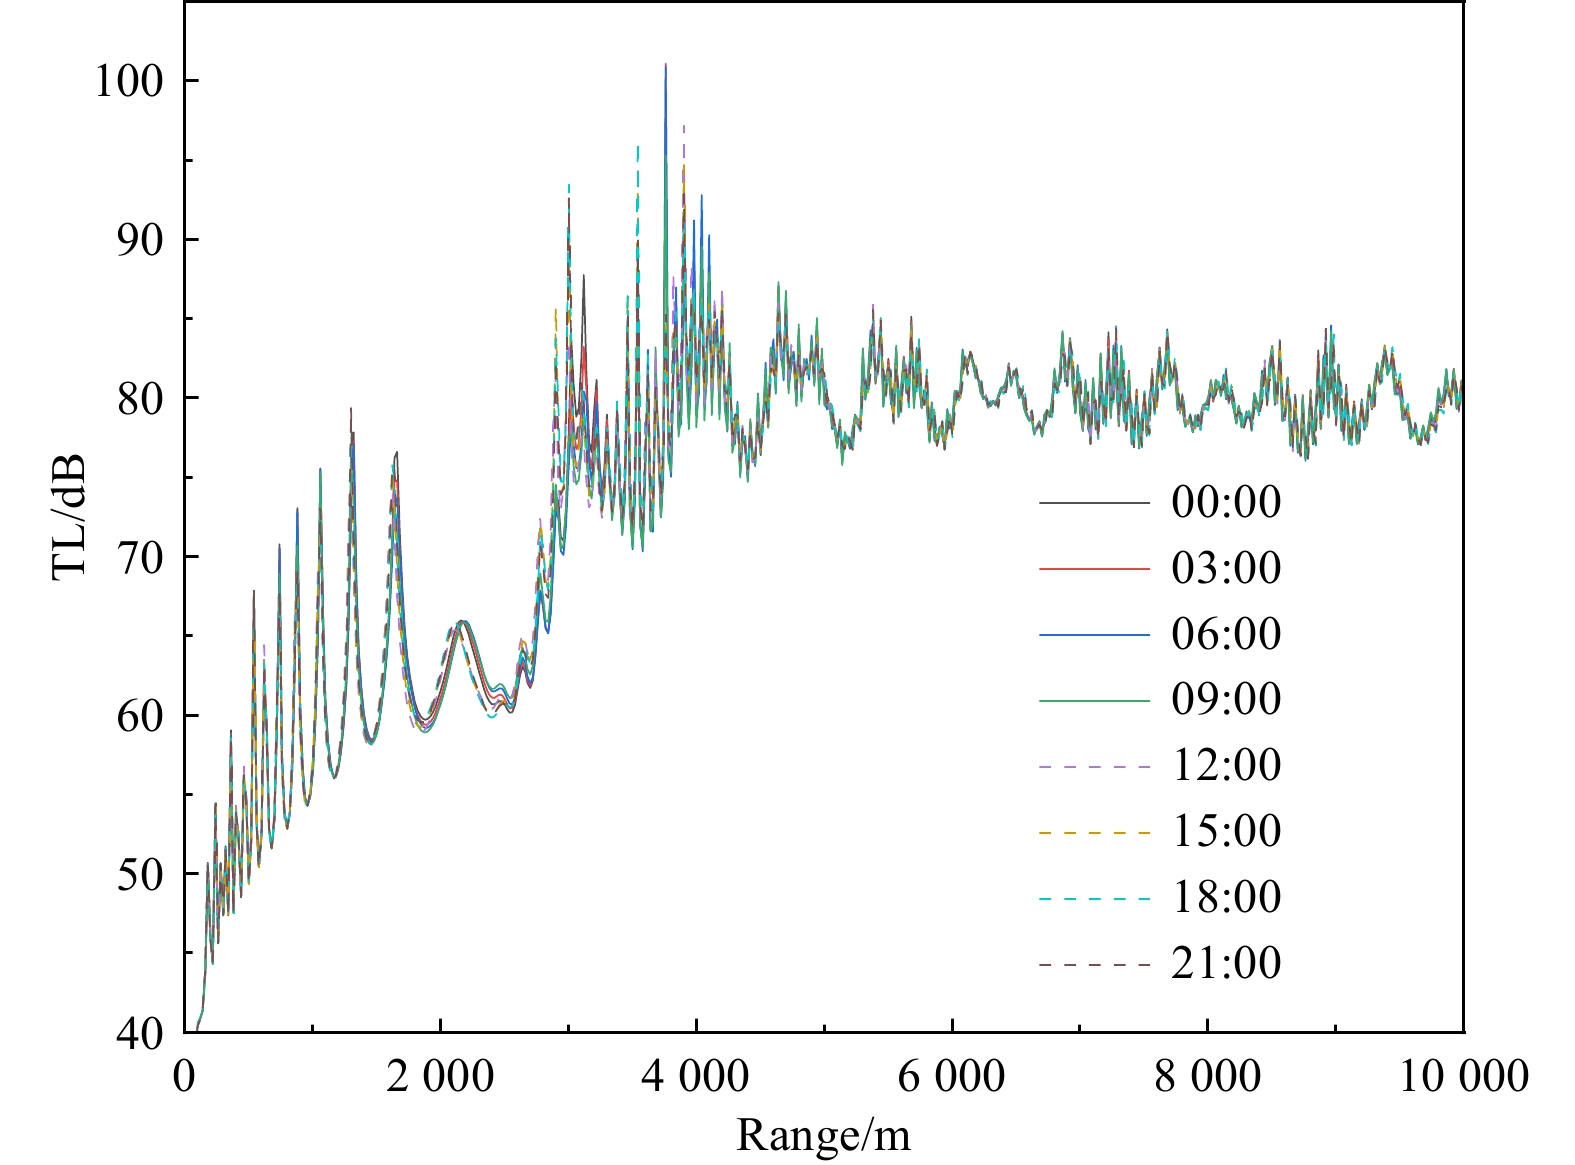
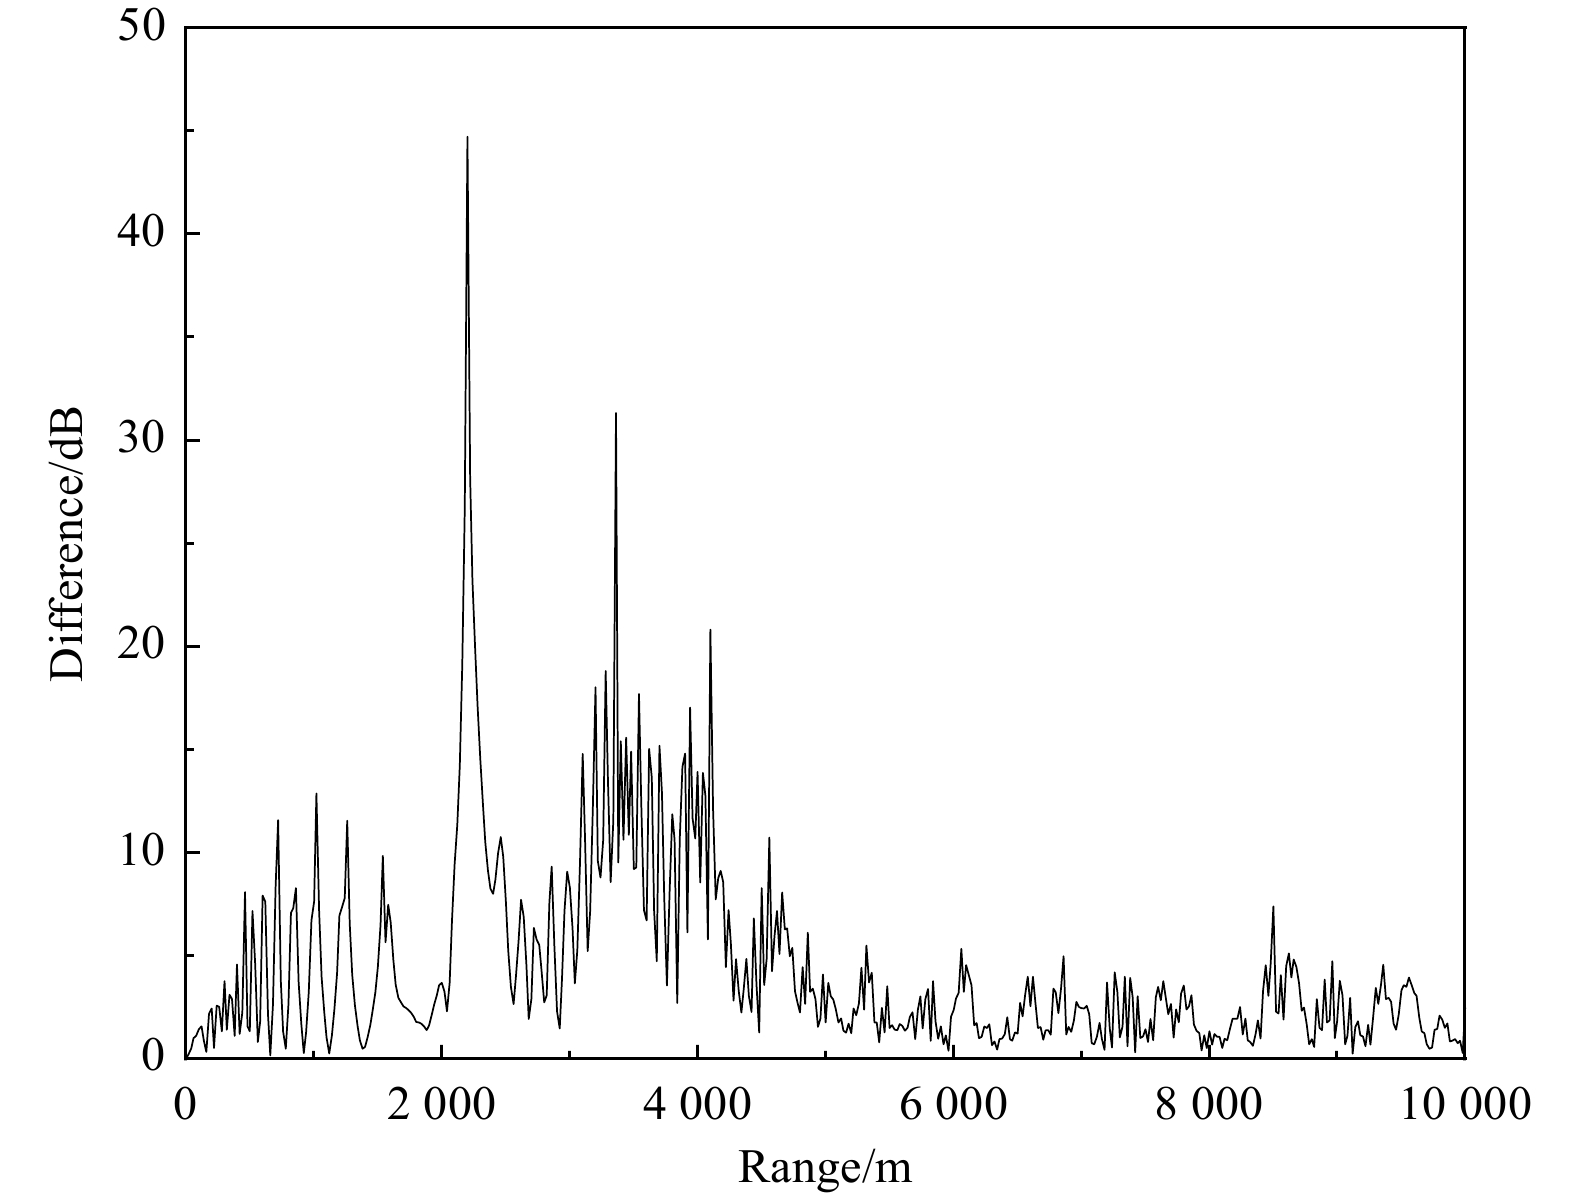
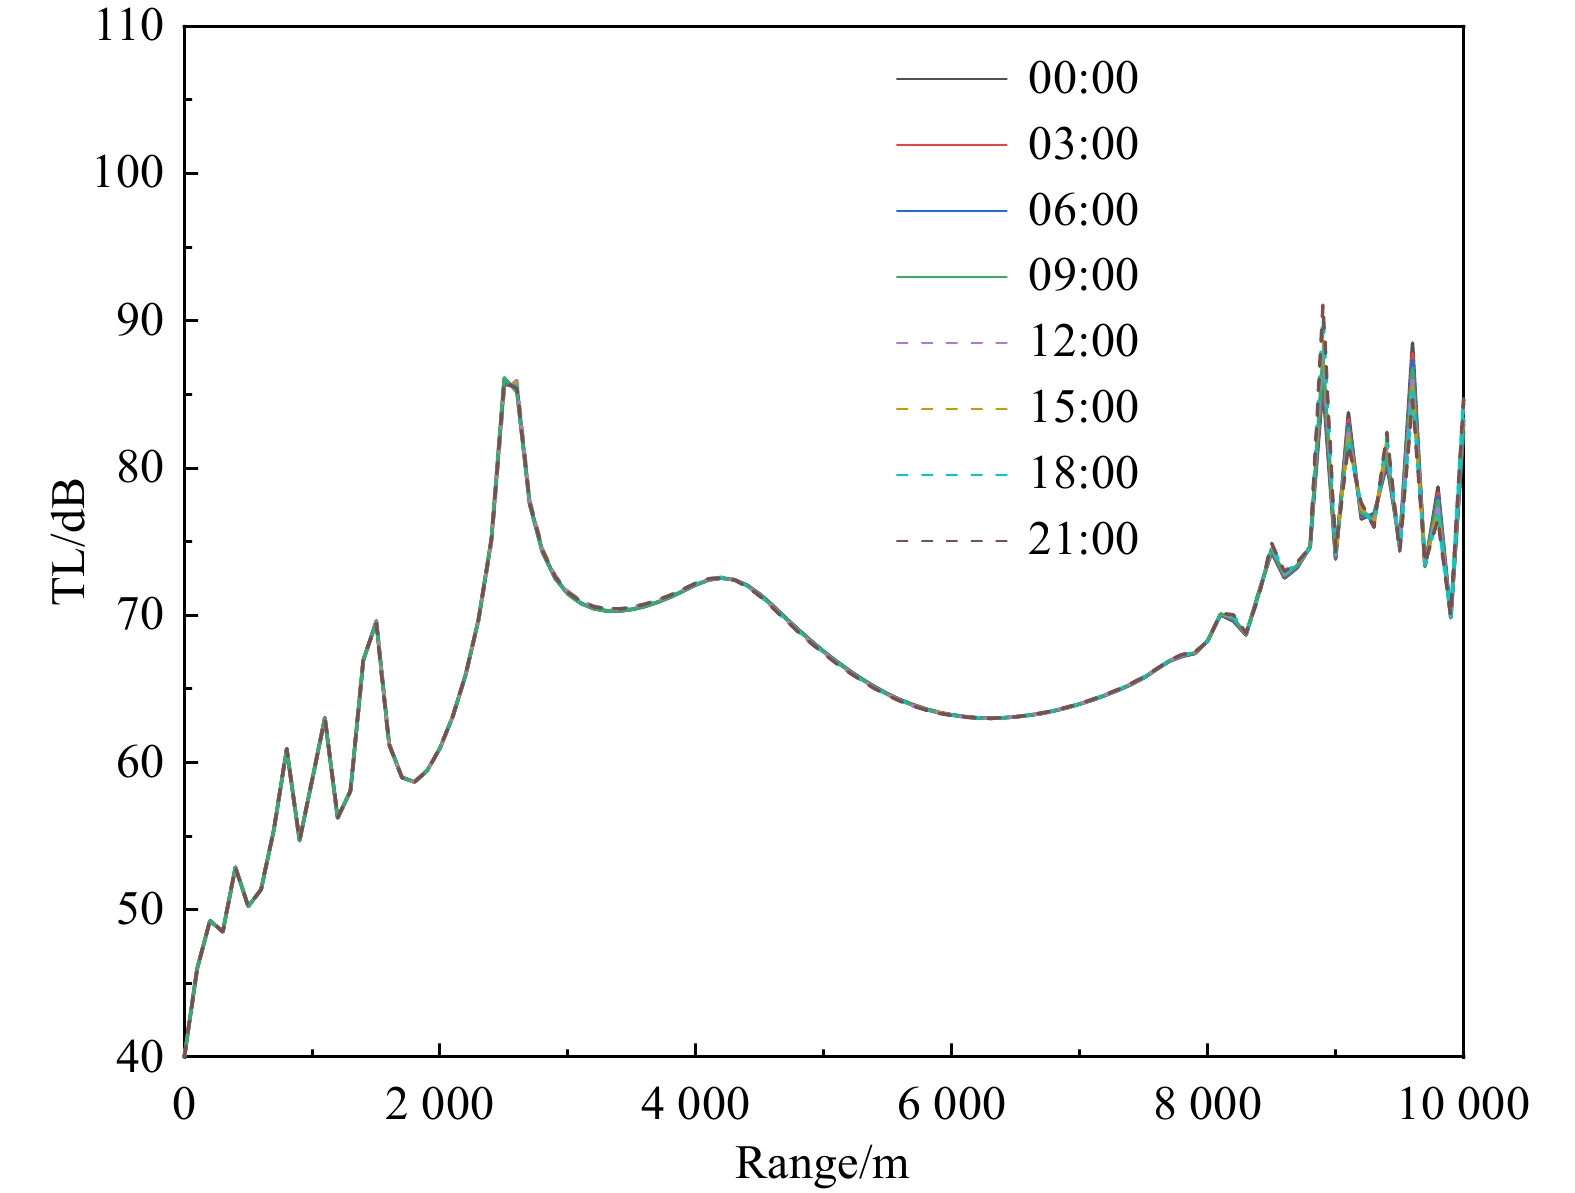
Figure 31. Sound propagation loss at Point C in the South China Sea at different times (at a receiving depth of 200 meters).
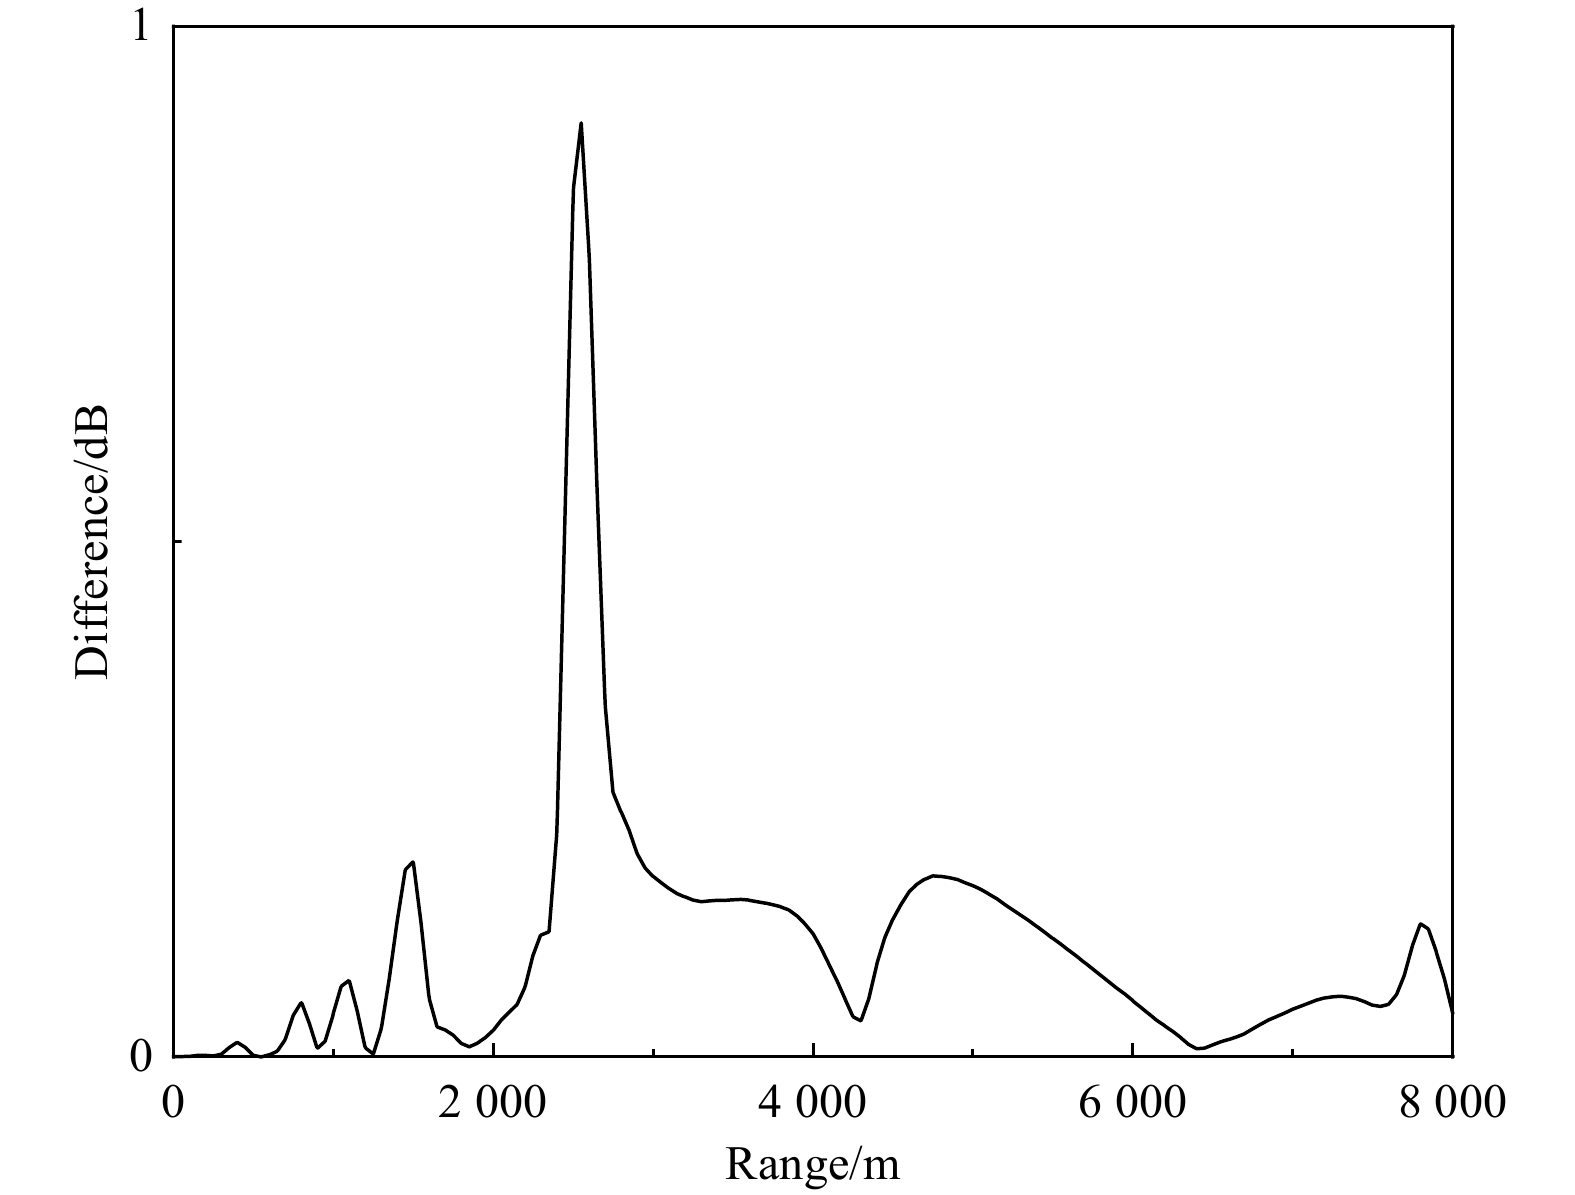
Figure 32. Variation in the difference between the maximum and minimum values of sound propagation loss at Point C in the South China Sea (at a receiving depth of 200 meters).
Figure 33. Sound propagation loss at Point D in the Indian Ocean on January 15, 2014, at 12:00.
Figure 34. Changes in the sound speed profile at different times at Point D in the Indian Ocean on January 15, 2014.
Figure 35. Water sound propagation loss at different times at Point D in the Indian Ocean (at a receiving depth of 200 meters).
Figure 36. Chart of changes in the difference between maximum and minimum sound propagation loss at Point D in the Indian Ocean (at a receiving depth of 200 meters).
Figure 37. Sound propagation loss at Point F in the Arctic Ocean on January 15, 2014 at 12:00.
Figure 38. Changes in the sound speed profile at different times at Point F in the Arctic Ocean on January 15, 2014 (at a receiving depth of 200 meters).
Figure 39. Water sound propagation loss at different times at Point F in the Arctic Ocean (at a receiving depth of 200 meters).
Figure 40. Chart of changes in the difference between maximum and minimum sound propagation loss at Point F in the Arctic Ocean (at a receiving depth of 200 meters).


 DownLoad: