

Significant wave height forecasts integrating ensemble empirical mode decomposition with sequence-to-sequence model
-
Abstract: As wave height is an important parameter in marine climate measurement, its accurate prediction is crucial in ocean engineering. It also plays an important role in marine disaster early warning and ship design, etc. However, challenges in the large demand for computing resources and the improvement of accuracy are currently encountered. To resolve the above mentioned problems, sequence-to-sequence deep learning model (Seq-to-Seq) is applied to intelligently explore the internal law between the continuous wave height data output by the model, so as to realize fast and accurate predictions on wave height data. Simultaneously, ensemble empirical mode decomposition (EEMD) is adopted to reduce the non-stationarity of wave height data and solve the problem of modal aliasing caused by empirical mode decomposition (EMD), and then improves the prediction accuracy. A significant wave height forecast method integrating EEMD with the Seq-to-Seq model (EEMD-Seq-to-Seq) is proposed in this paper, and the prediction models under different time spans are established. Compared with the long short-term memory model, the novel method demonstrates increased continuity for long-term prediction and reduces prediction errors. The experiments of wave height prediction on four buoys show that the EEMD-Seq-to-Seq algorithm effectively improves the prediction accuracy in short-term (3-h, 6-h, 12-h and 24-h forecast horizon) and long-term (48-h and 72-h forecast horizon) predictions.
-
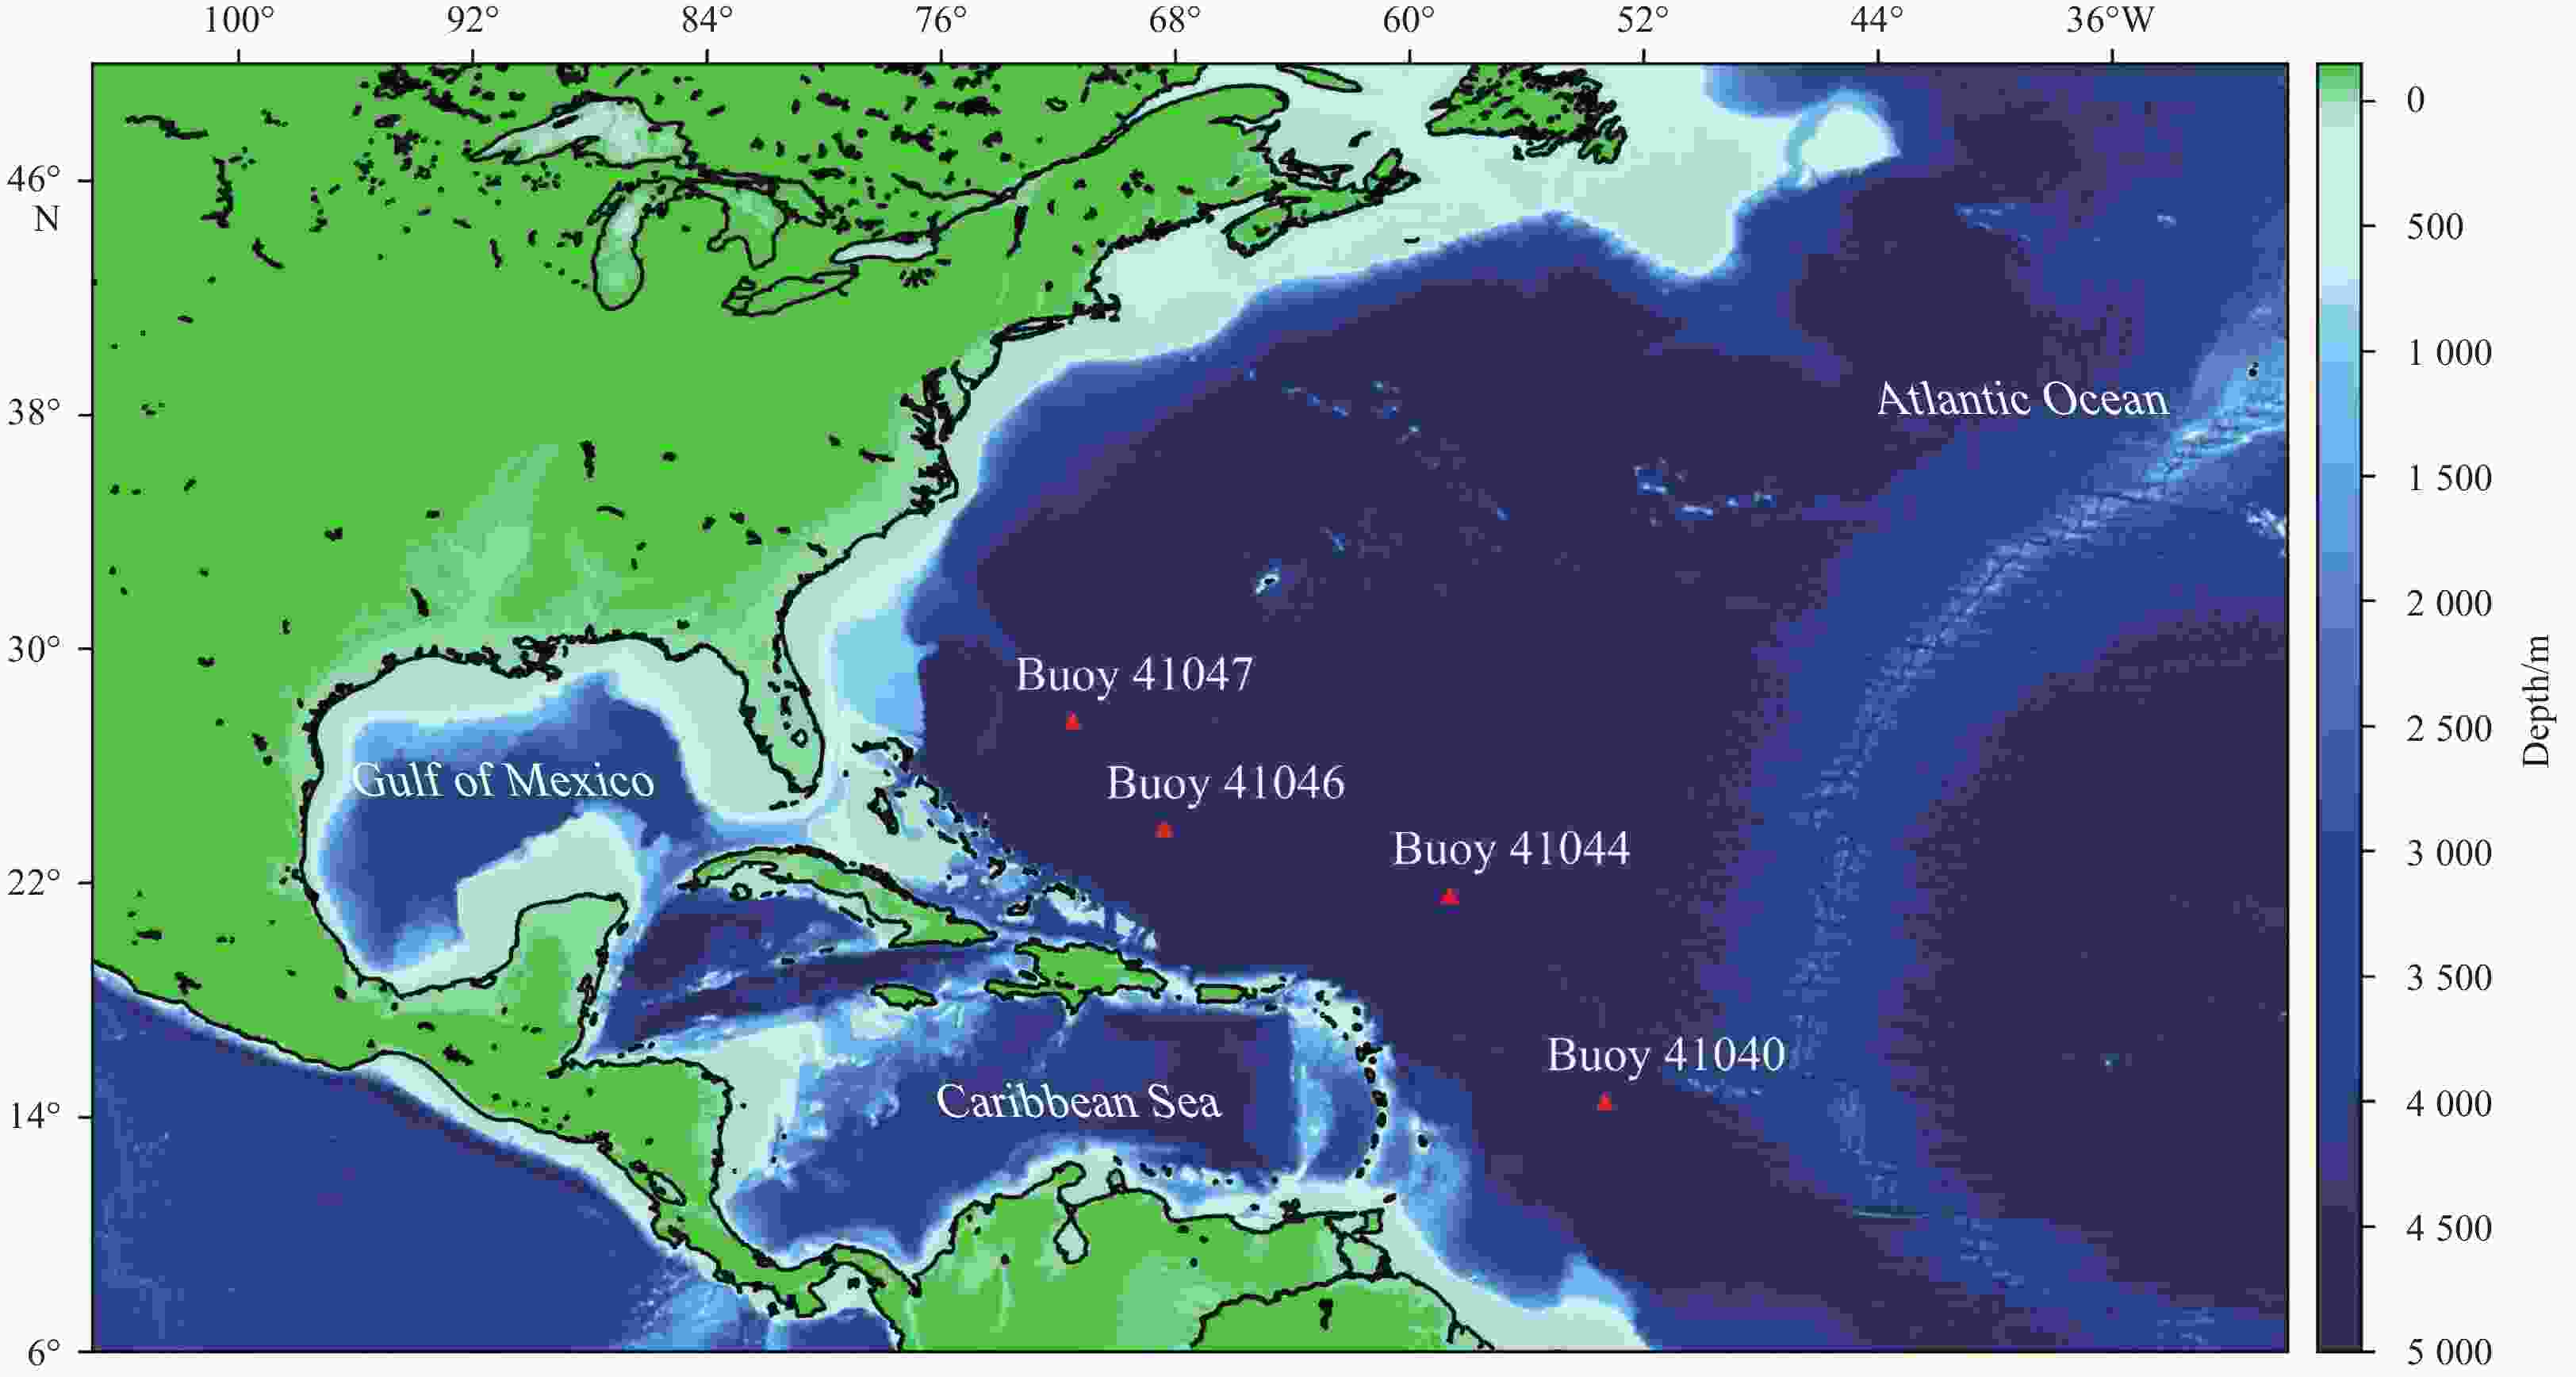
Figure 1. Location of Buoys 41040, 41044, 41046 and 41047 (data acquired from National Data Buoy Center).

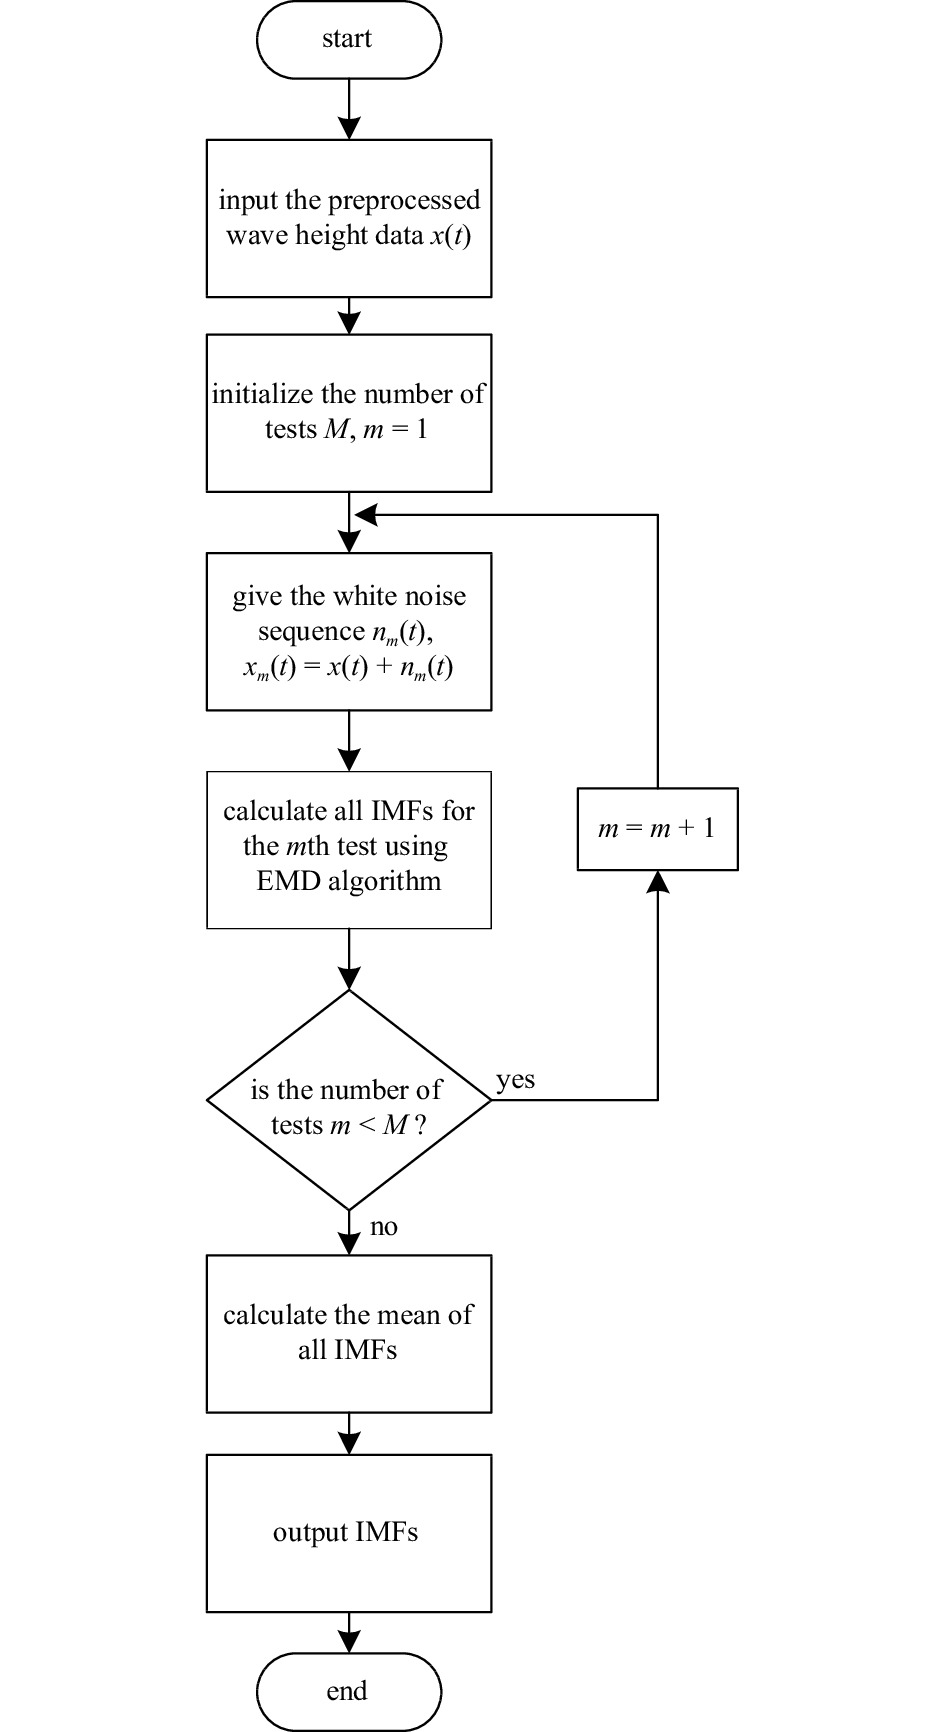
Figure 2. The flow chart of the ensemble empirical mode decomposition algorithm. m is the mean of the upper and lower envelope; IMF: intrinsic mode function.
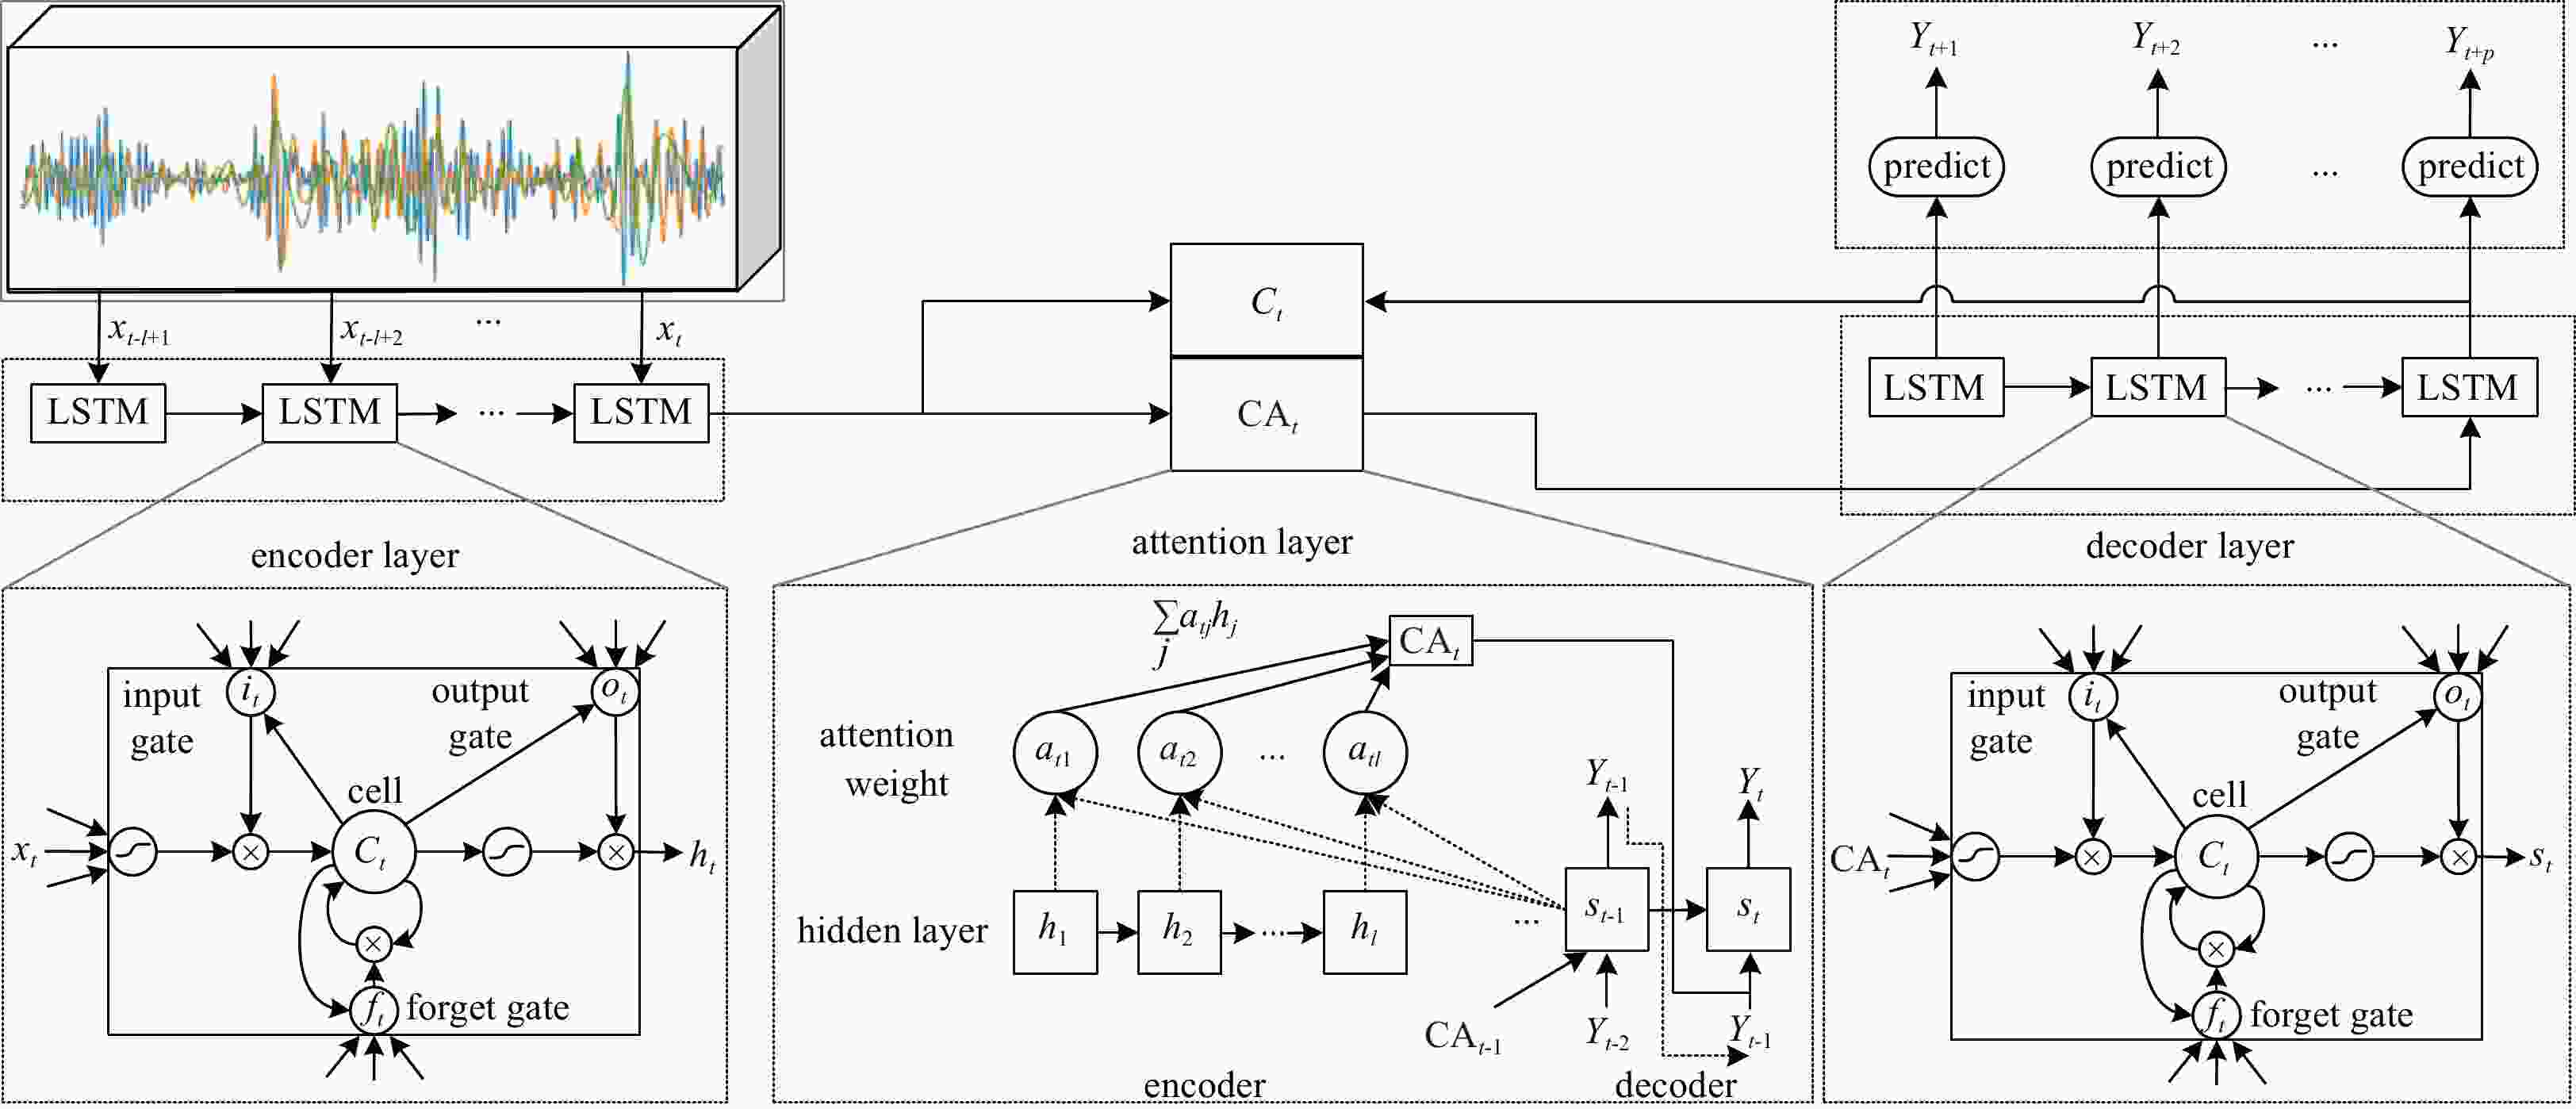
Figure 3. The structure of the sequence-to-sequence prediction model with attention mechanism. LSTM: long short-term memory; CA: encoded attention vector. The meanings of symbols refer to formula in the text.
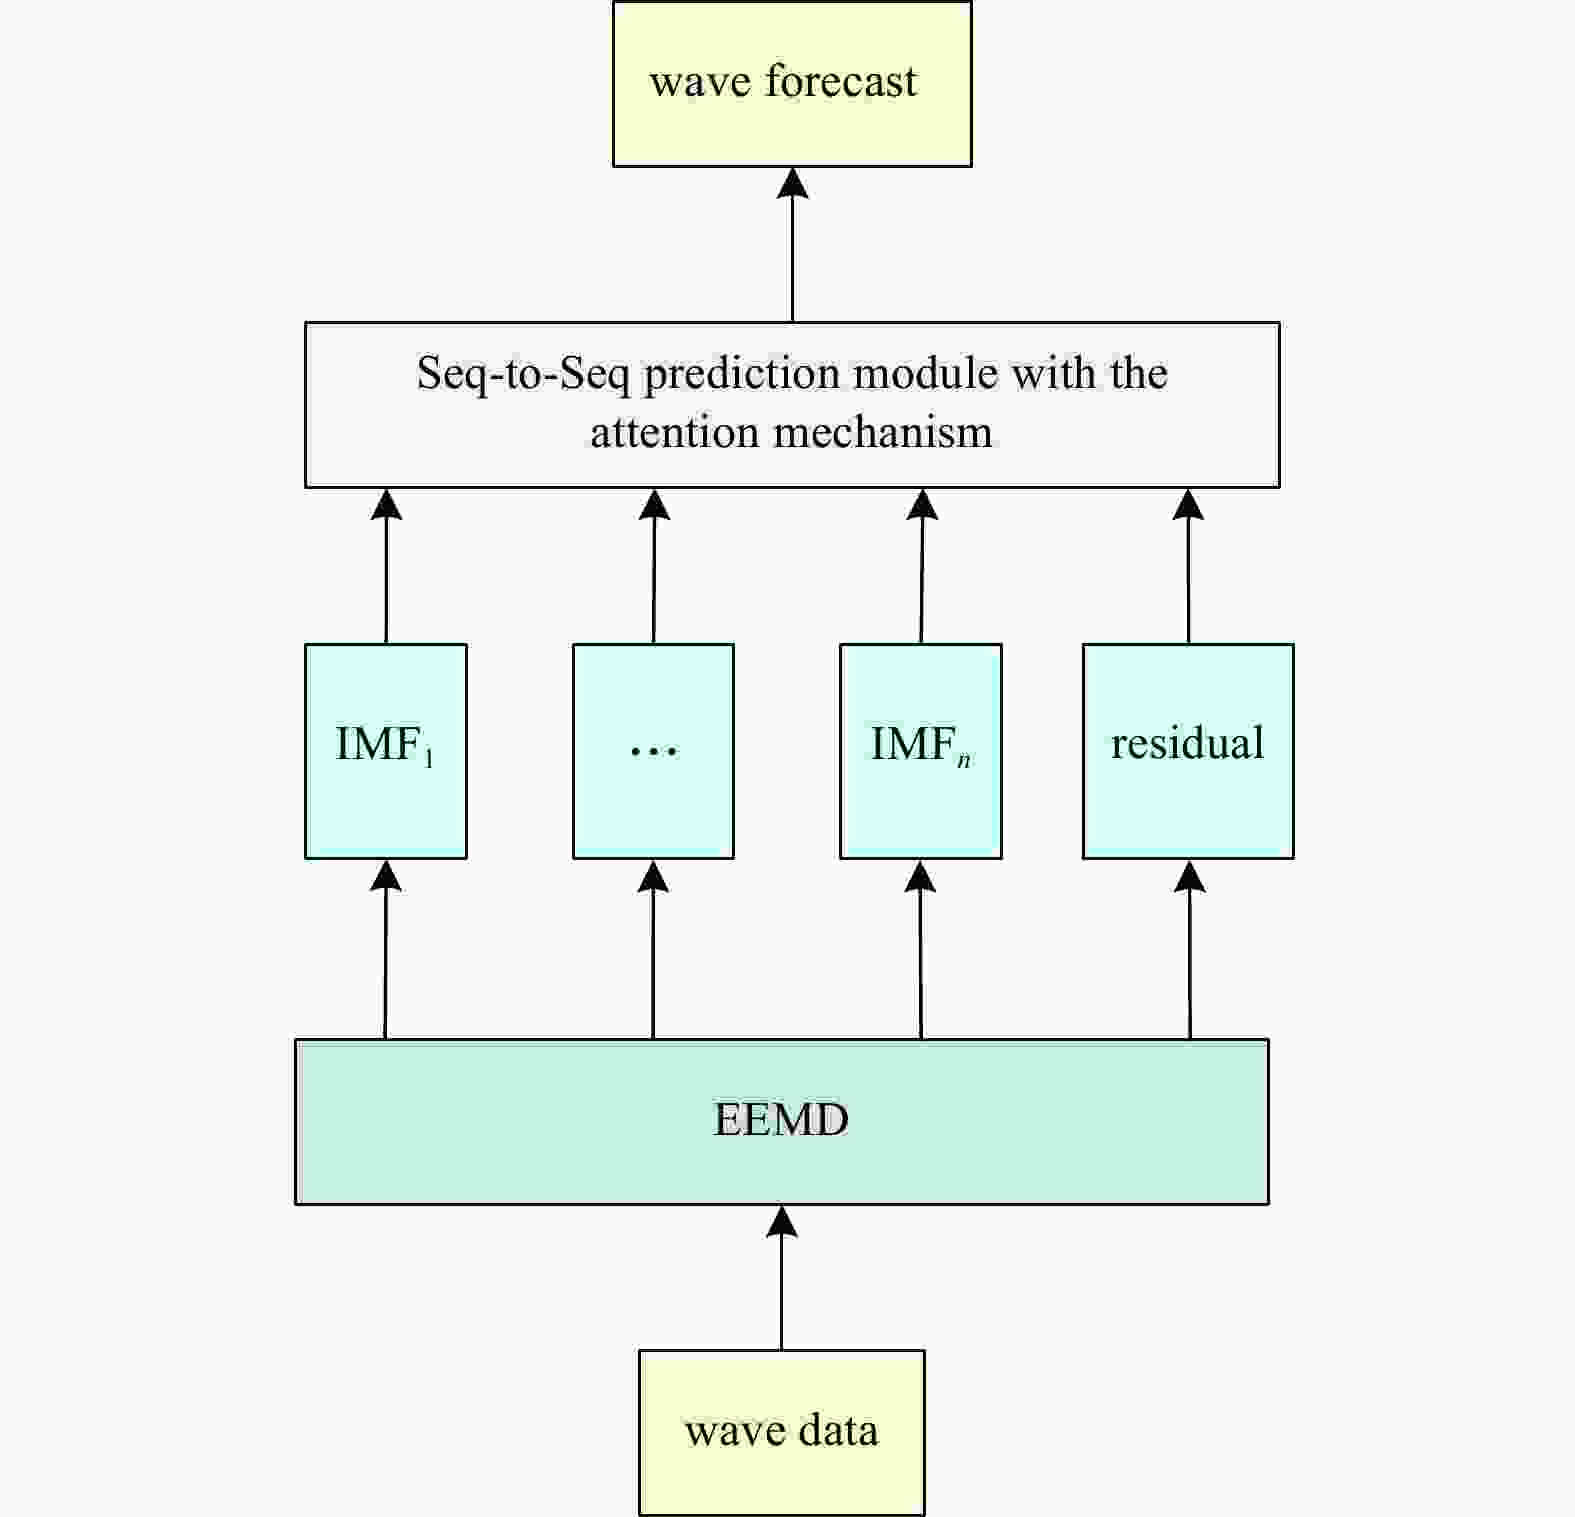
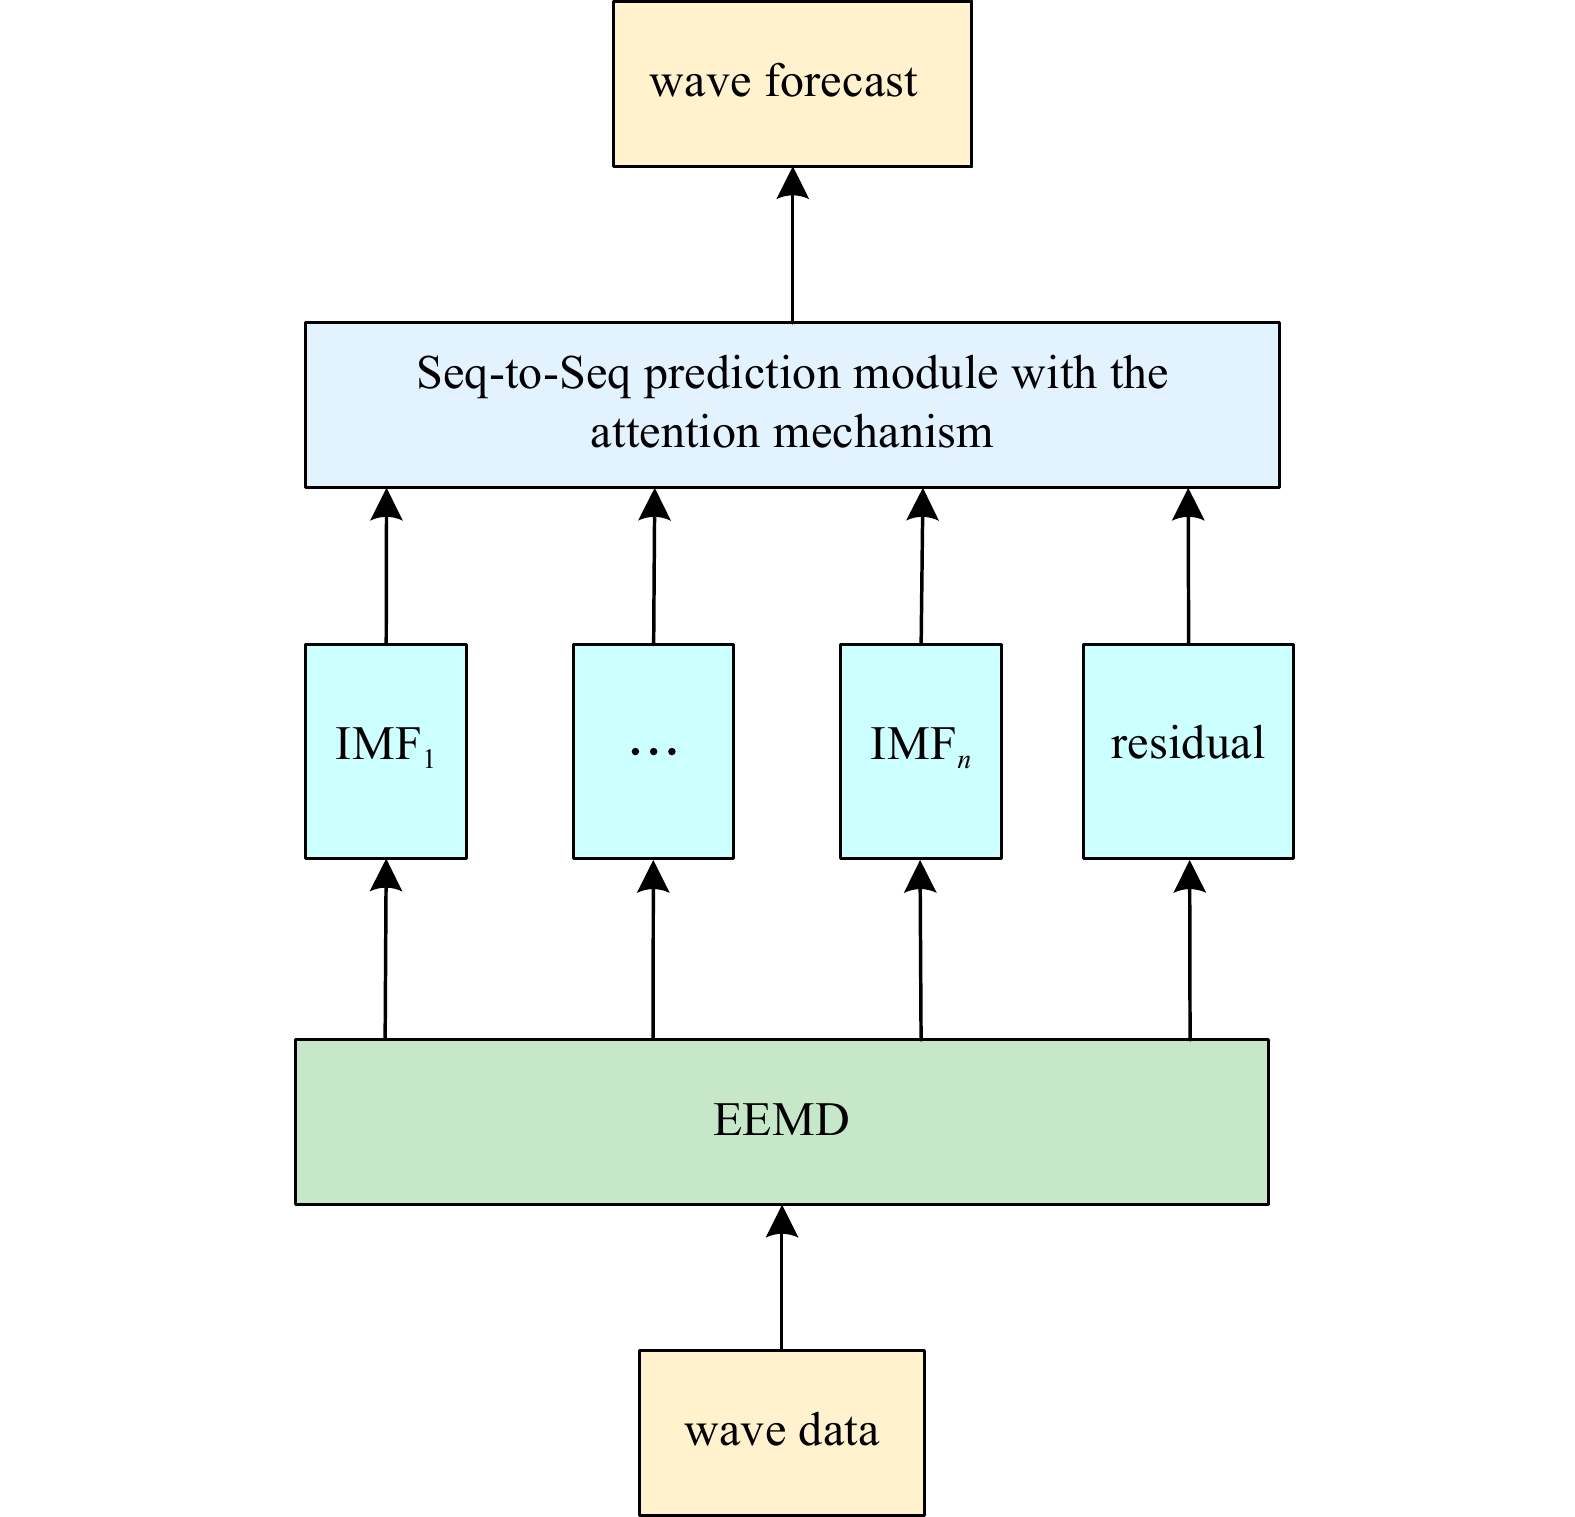
Figure 5. The structure of the ensemble empirical mode decomposition sequence-to-sequence (EEMD-Seq-to-Seq) prediction model. IMFs: intrinsic mode functions.

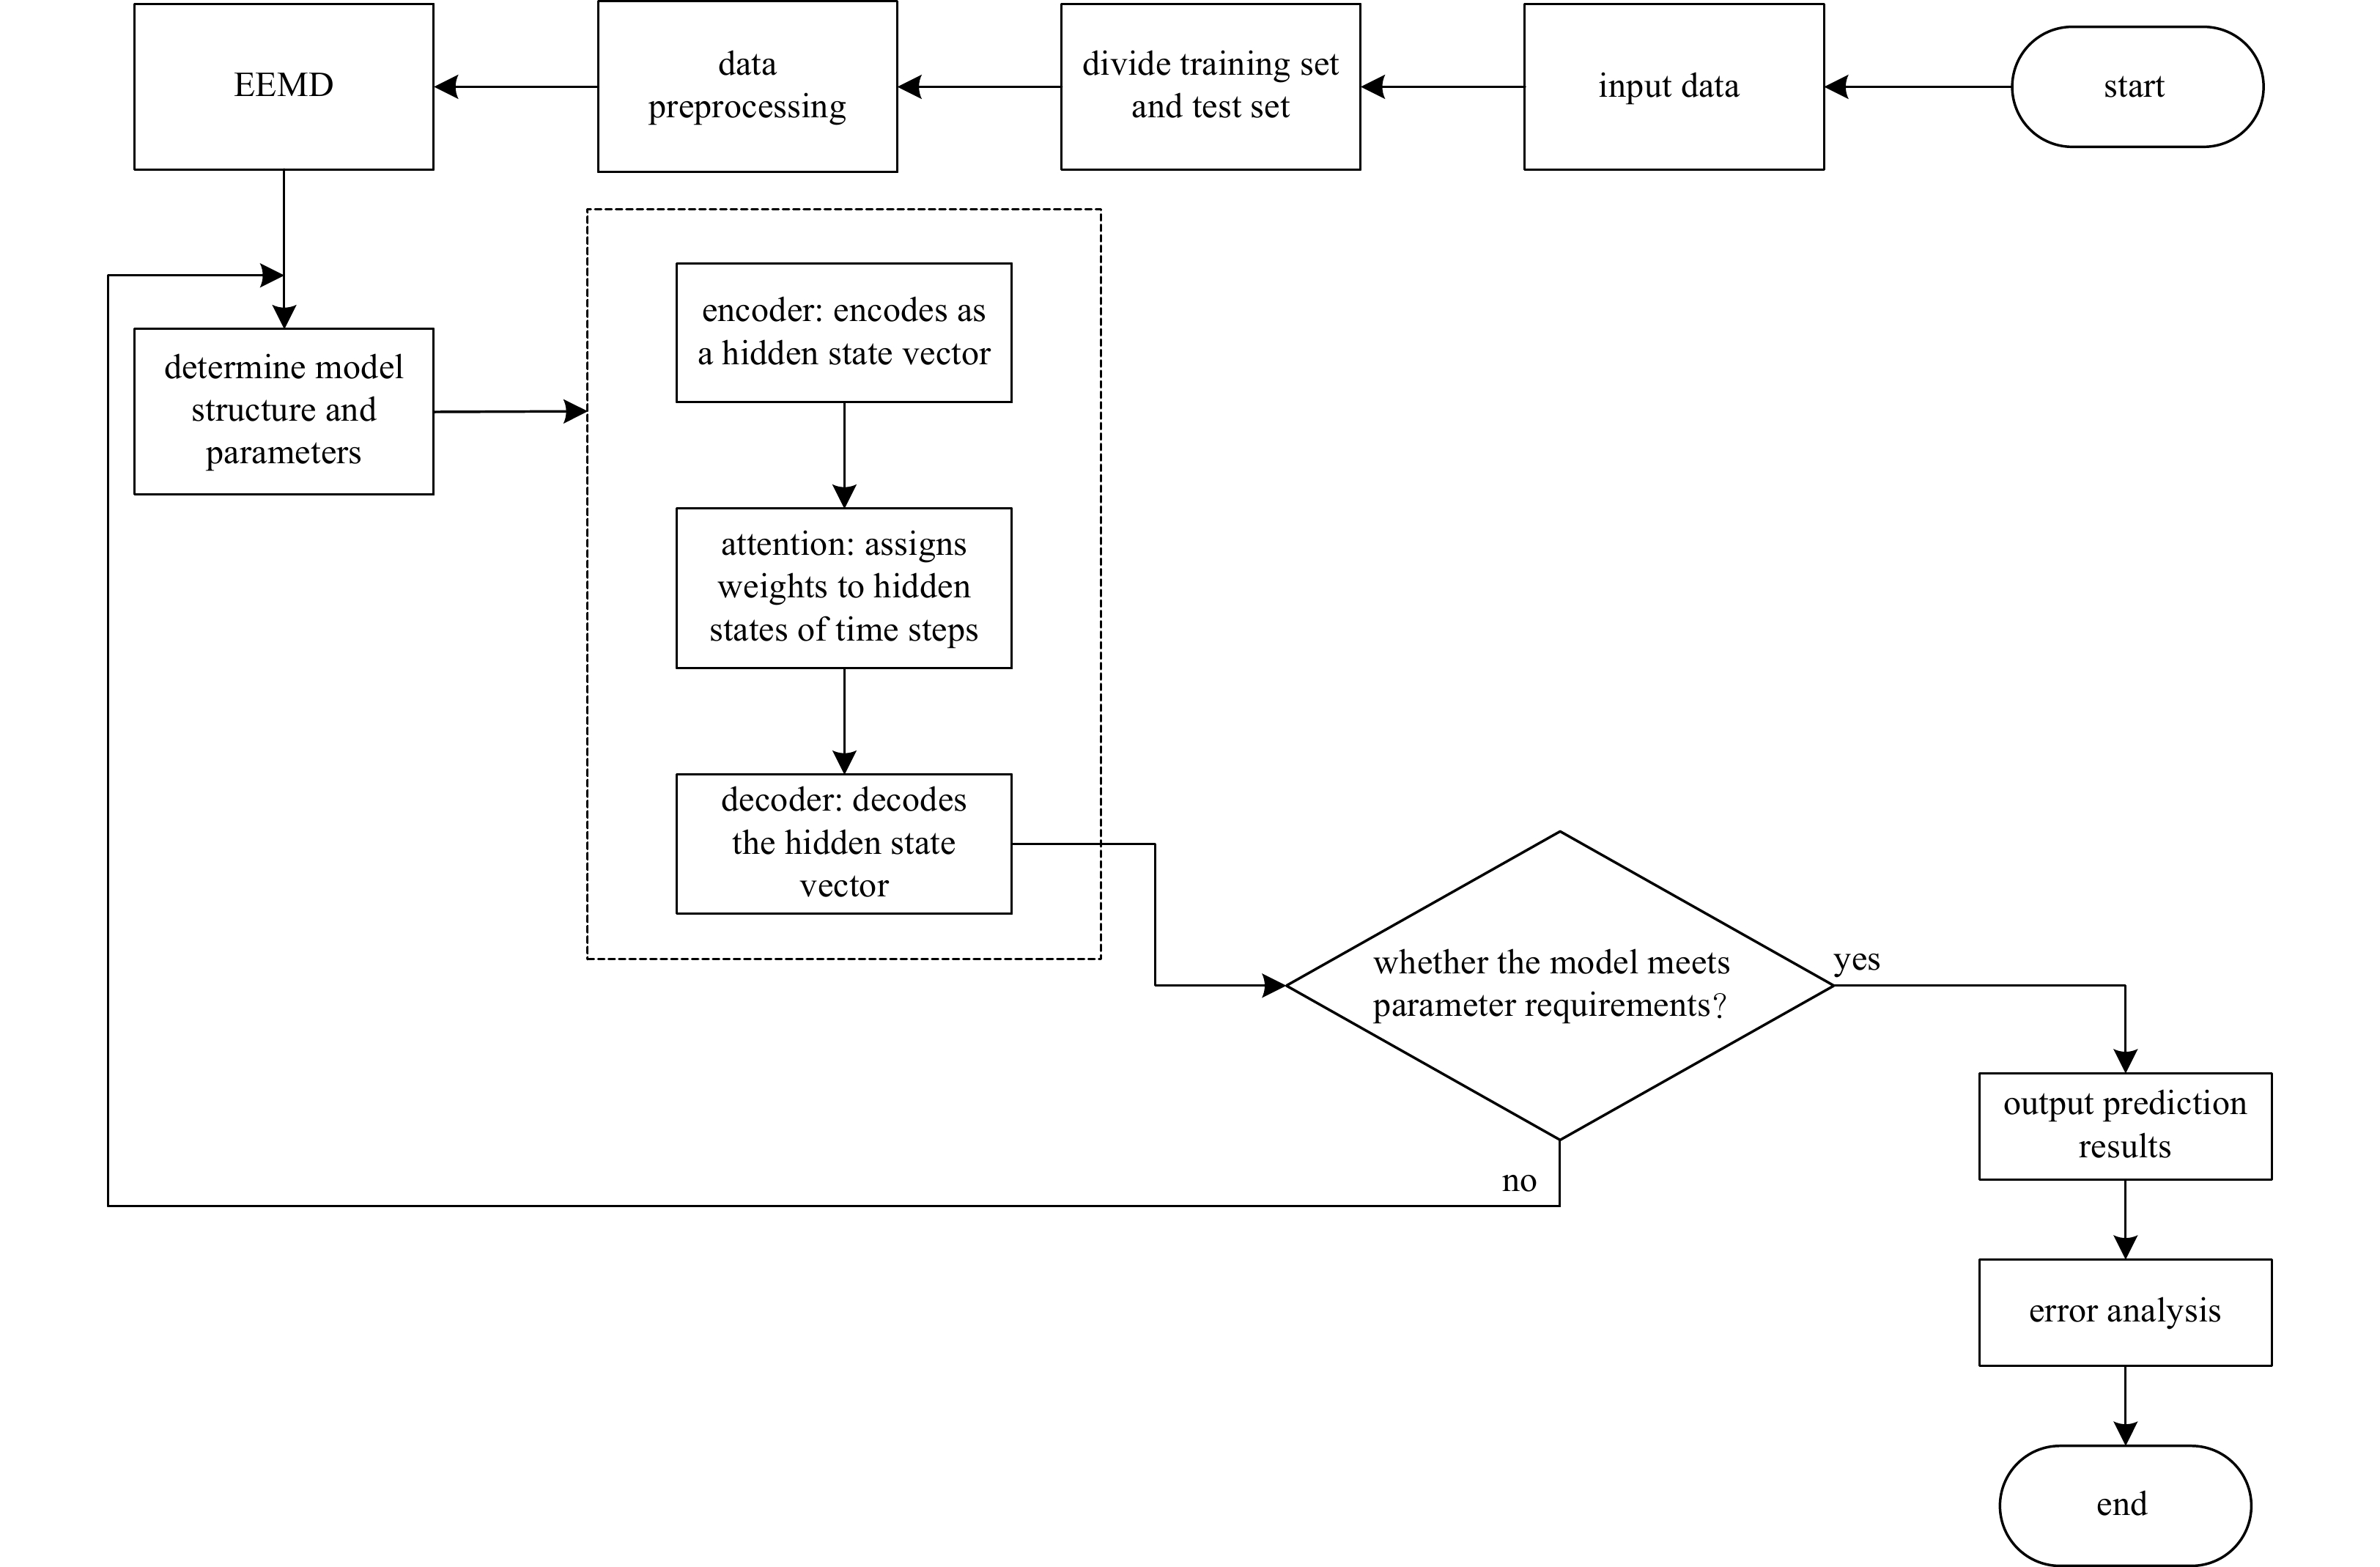
Figure 6. The flowchart of ensemble empirical mode decomposition sequence-to-sequence (EEMD-Seq-to-Seq) prediction model.
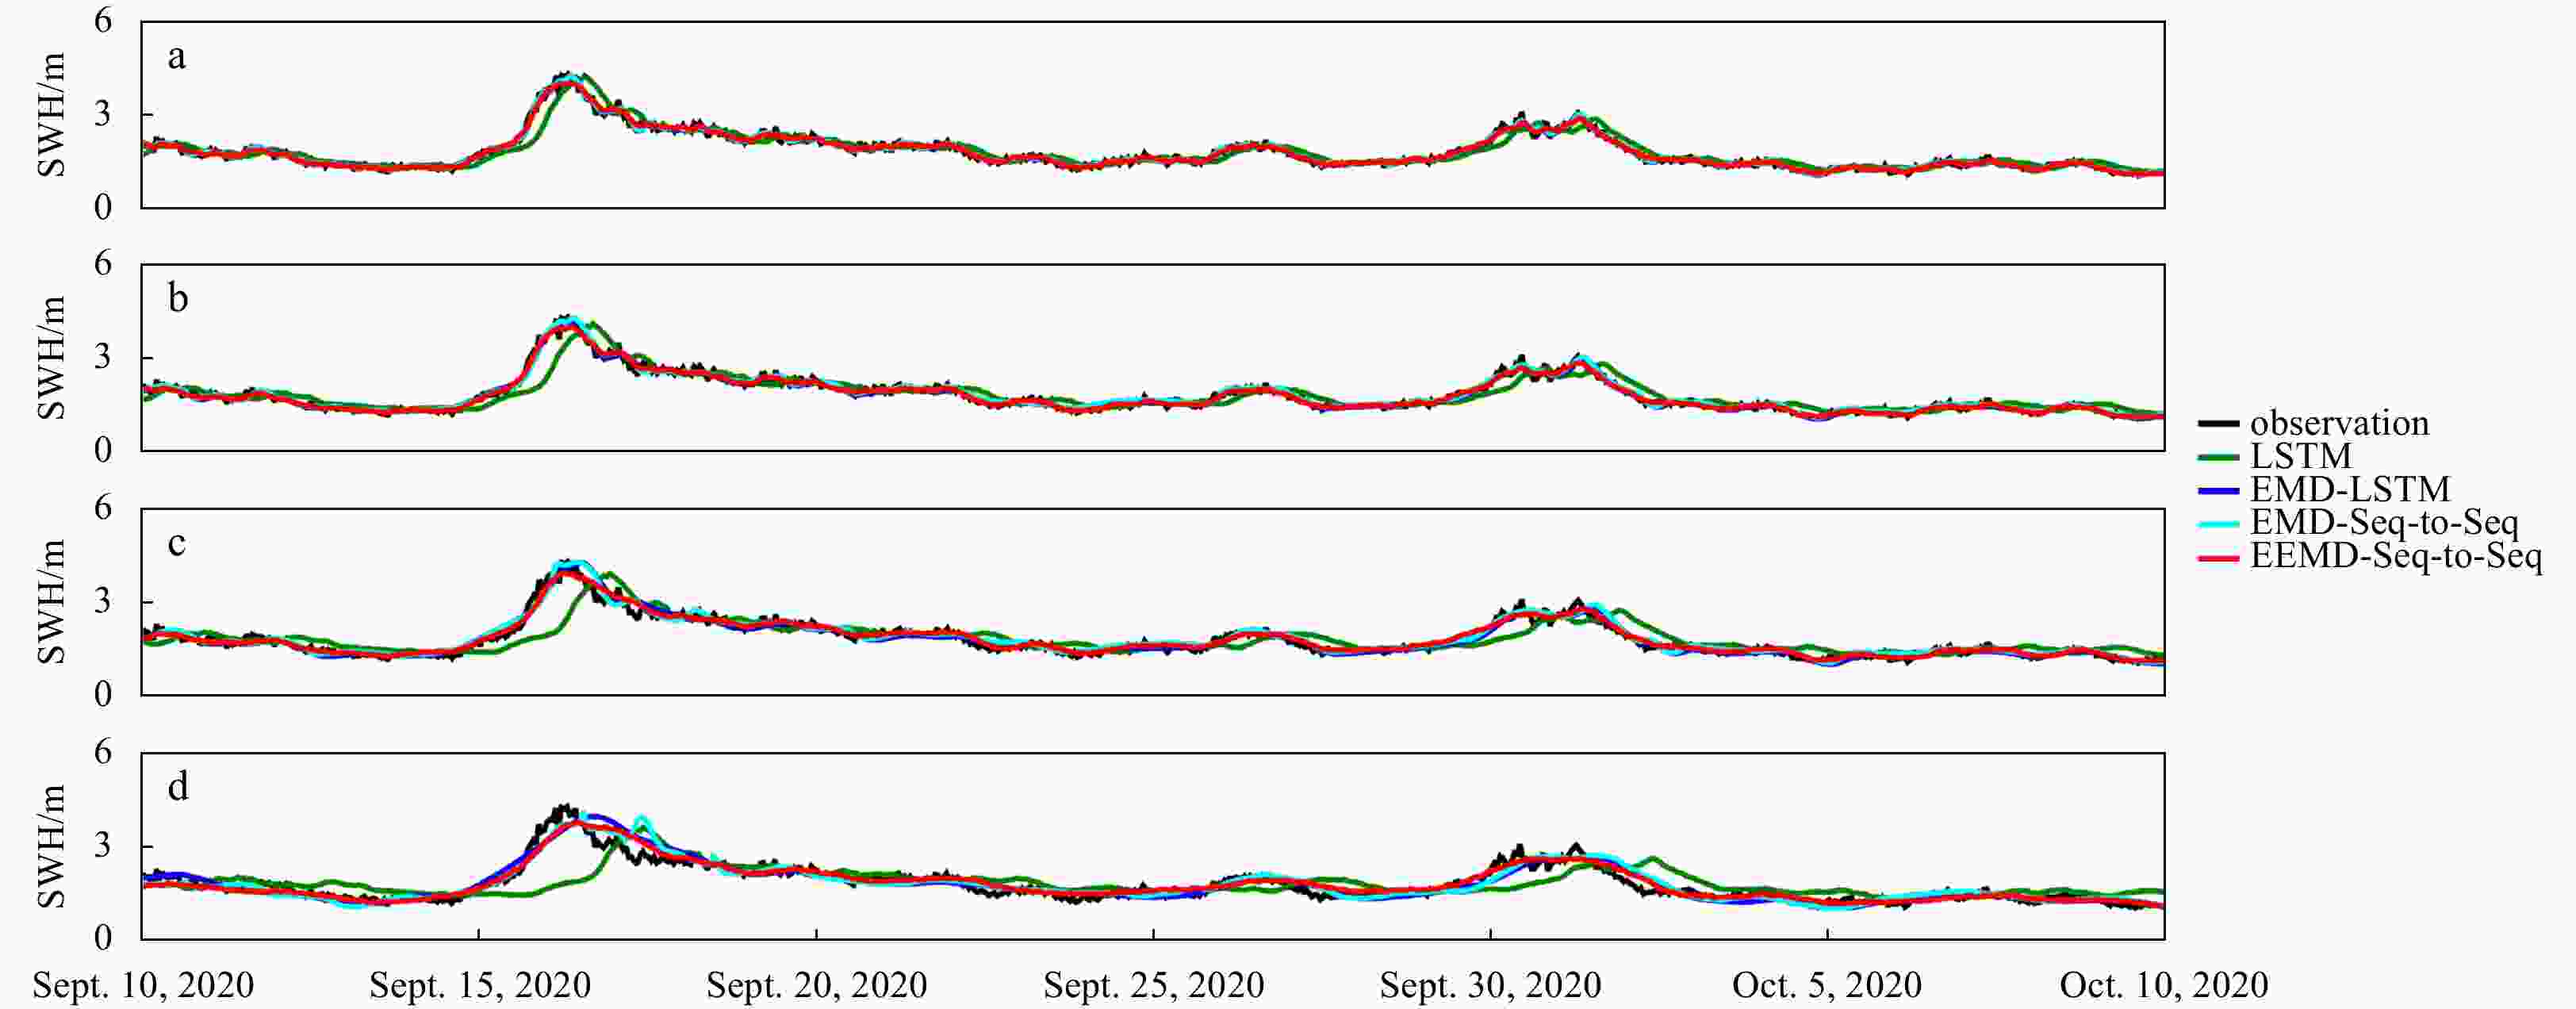
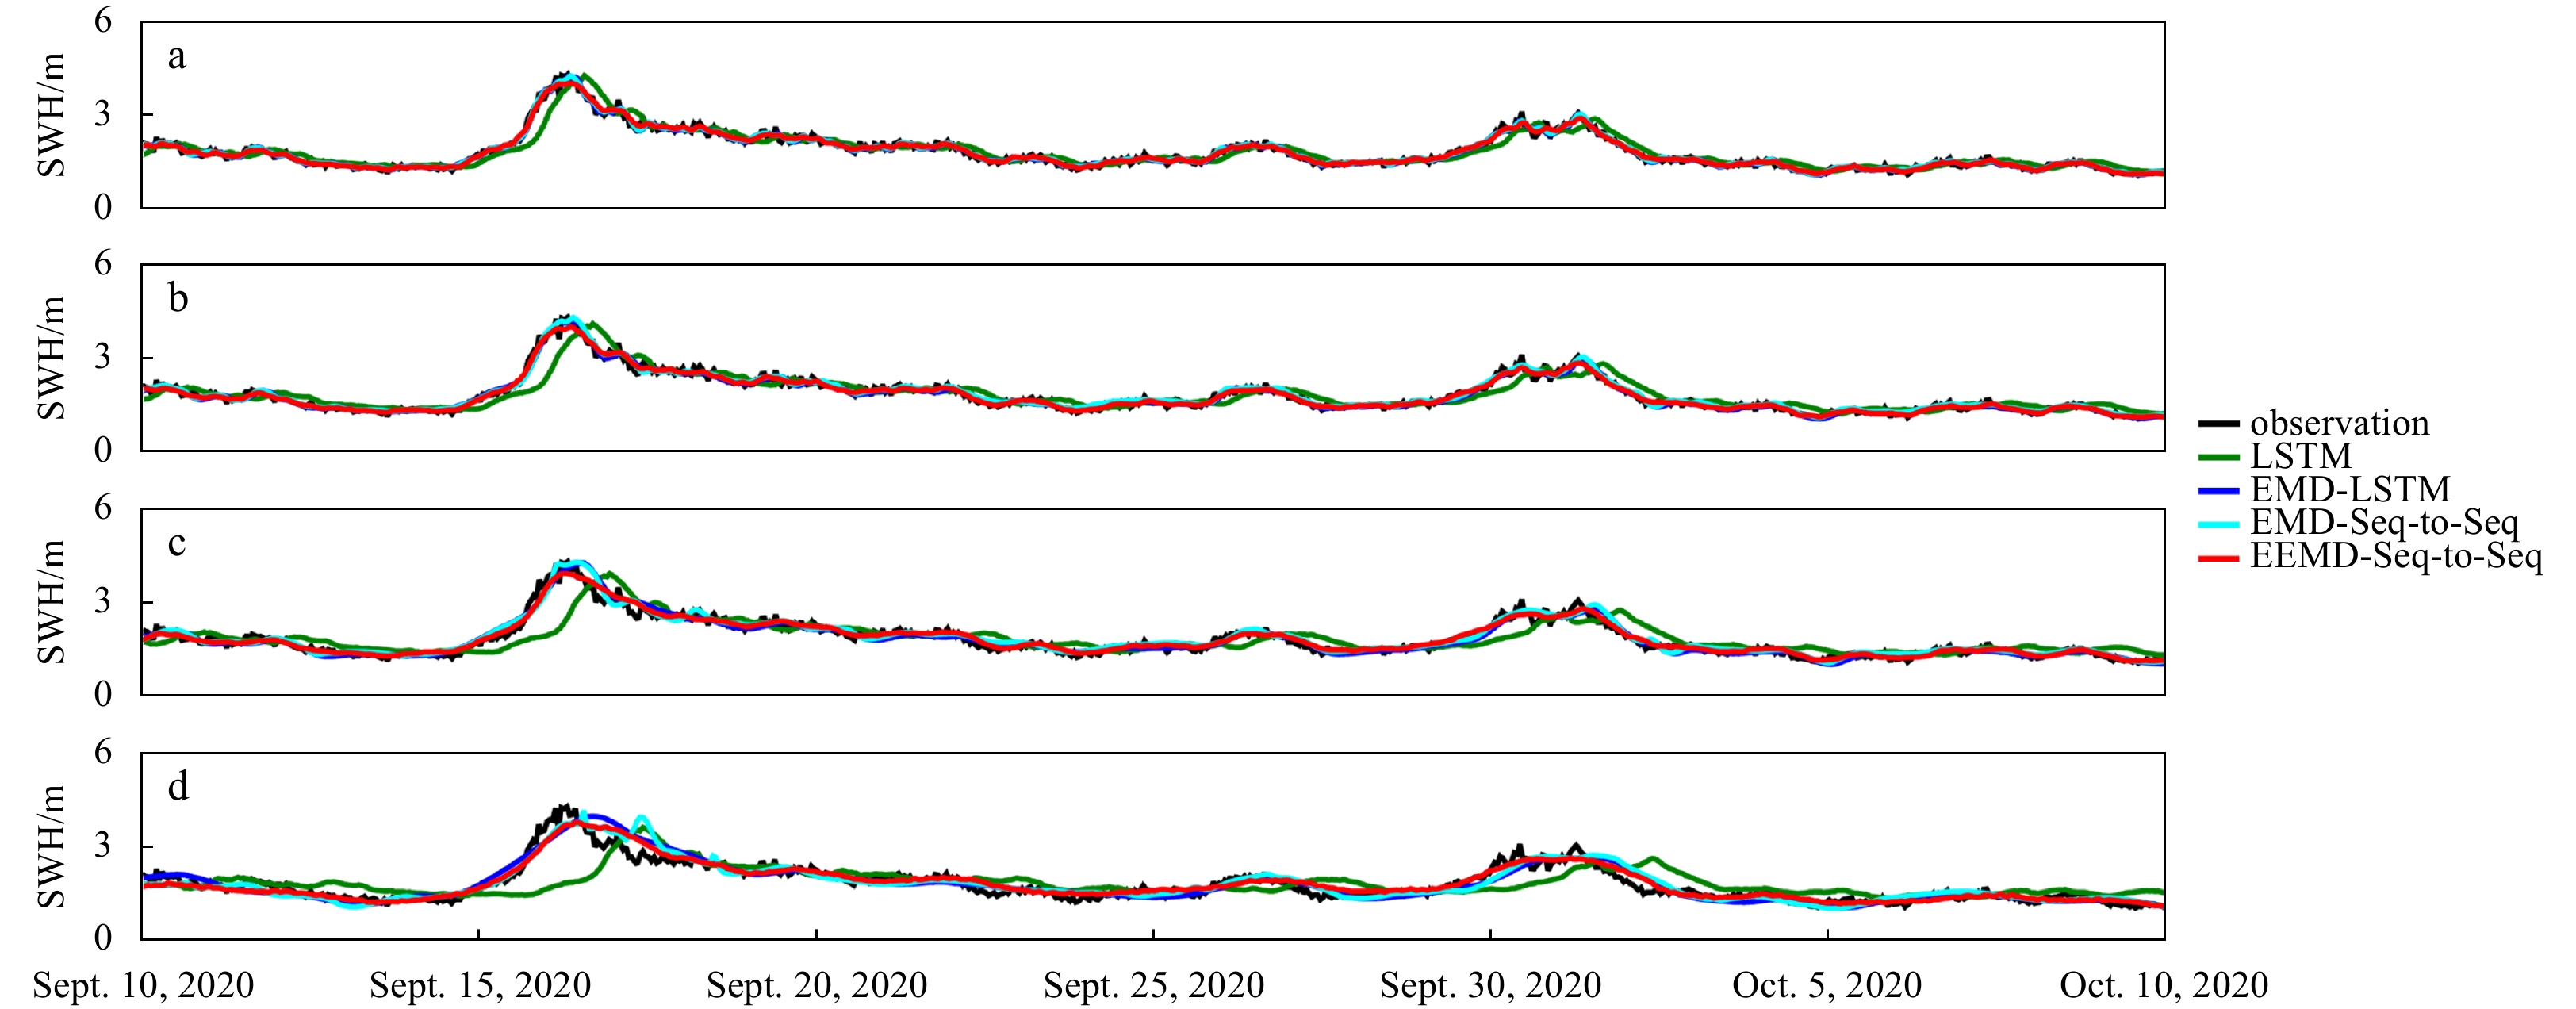
Figure 7. Comparison of significant wave height (SWH) forecasts of different models for Buoy 41040 at the 3-h (a), 6-h (b), 12-h (c) and 24-h (d) windows. LSTM: long short-term memory; EEMD-Seq-to-Seq: ensemble empirical mode decomposition with the sequence-to-sequence model.
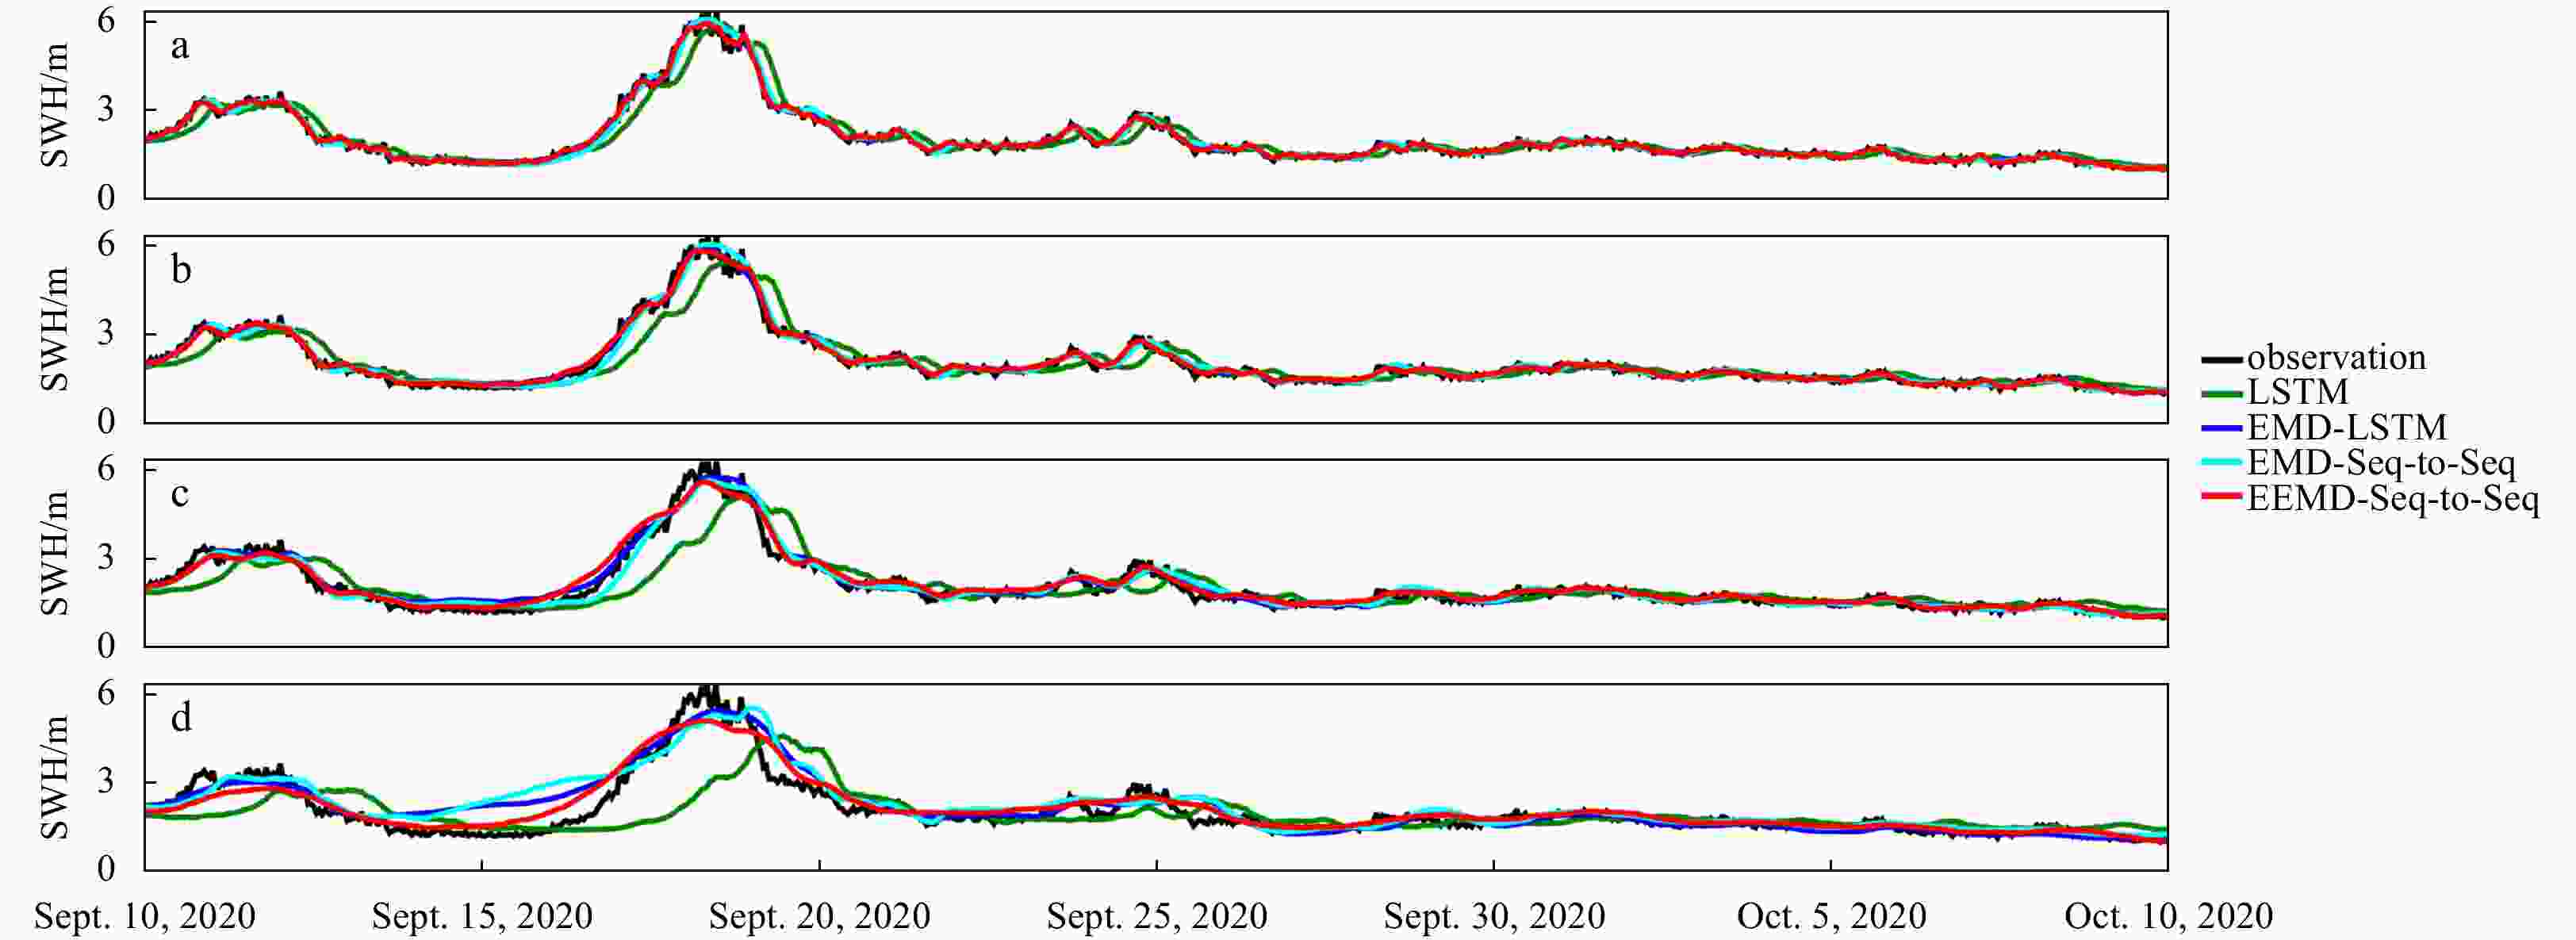
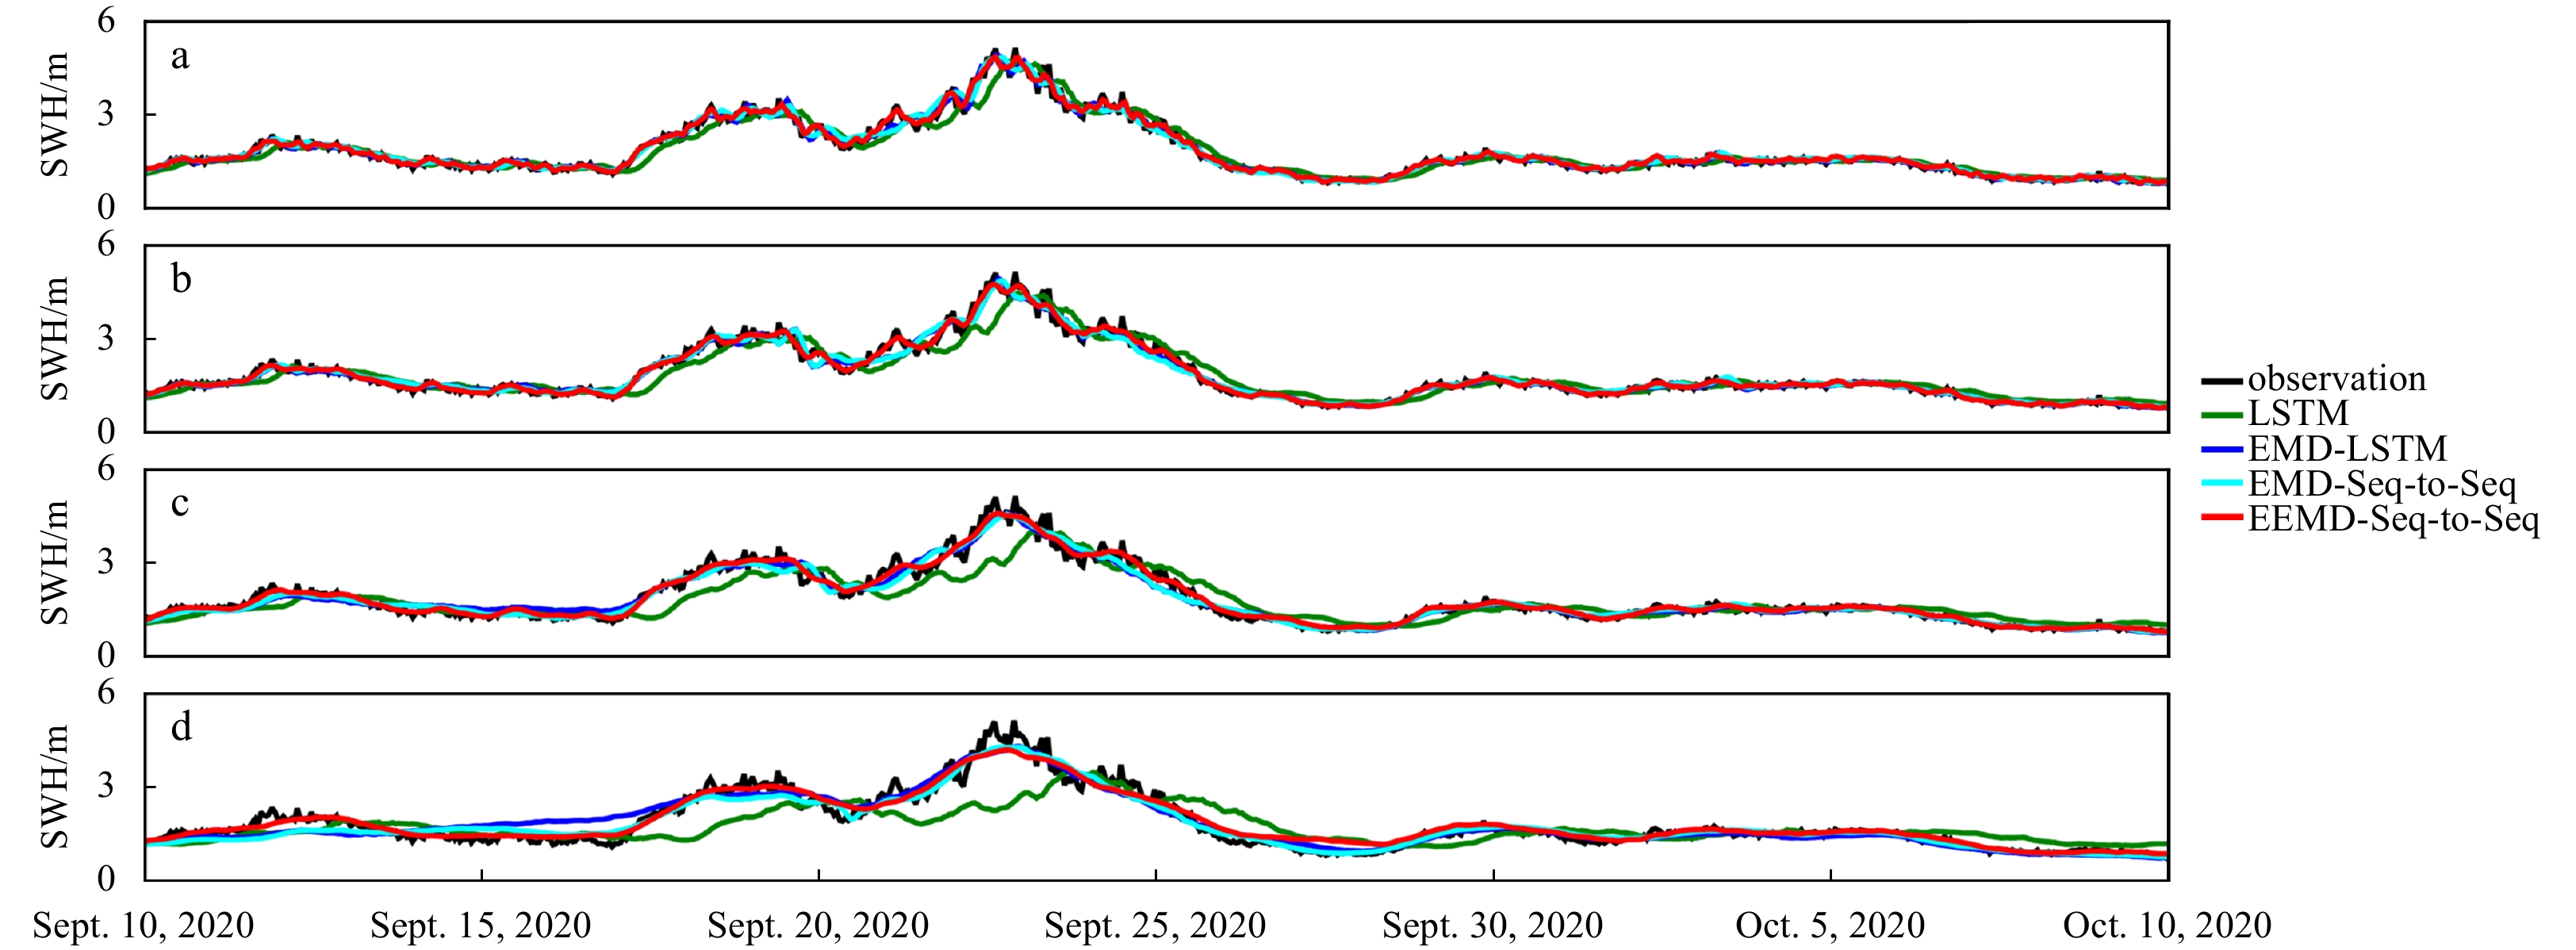
Figure 8. Comparison of significant wave height (SWH) forecasts of different models for Buoy 41044 at the 3-h (a), 6-h (b), 12-h (c) and 24-h (d) windows. LSTM: long short-term memory; EEMD-Seq-to-Seq: ensemble empirical mode decomposition with the sequence-to-sequence model.
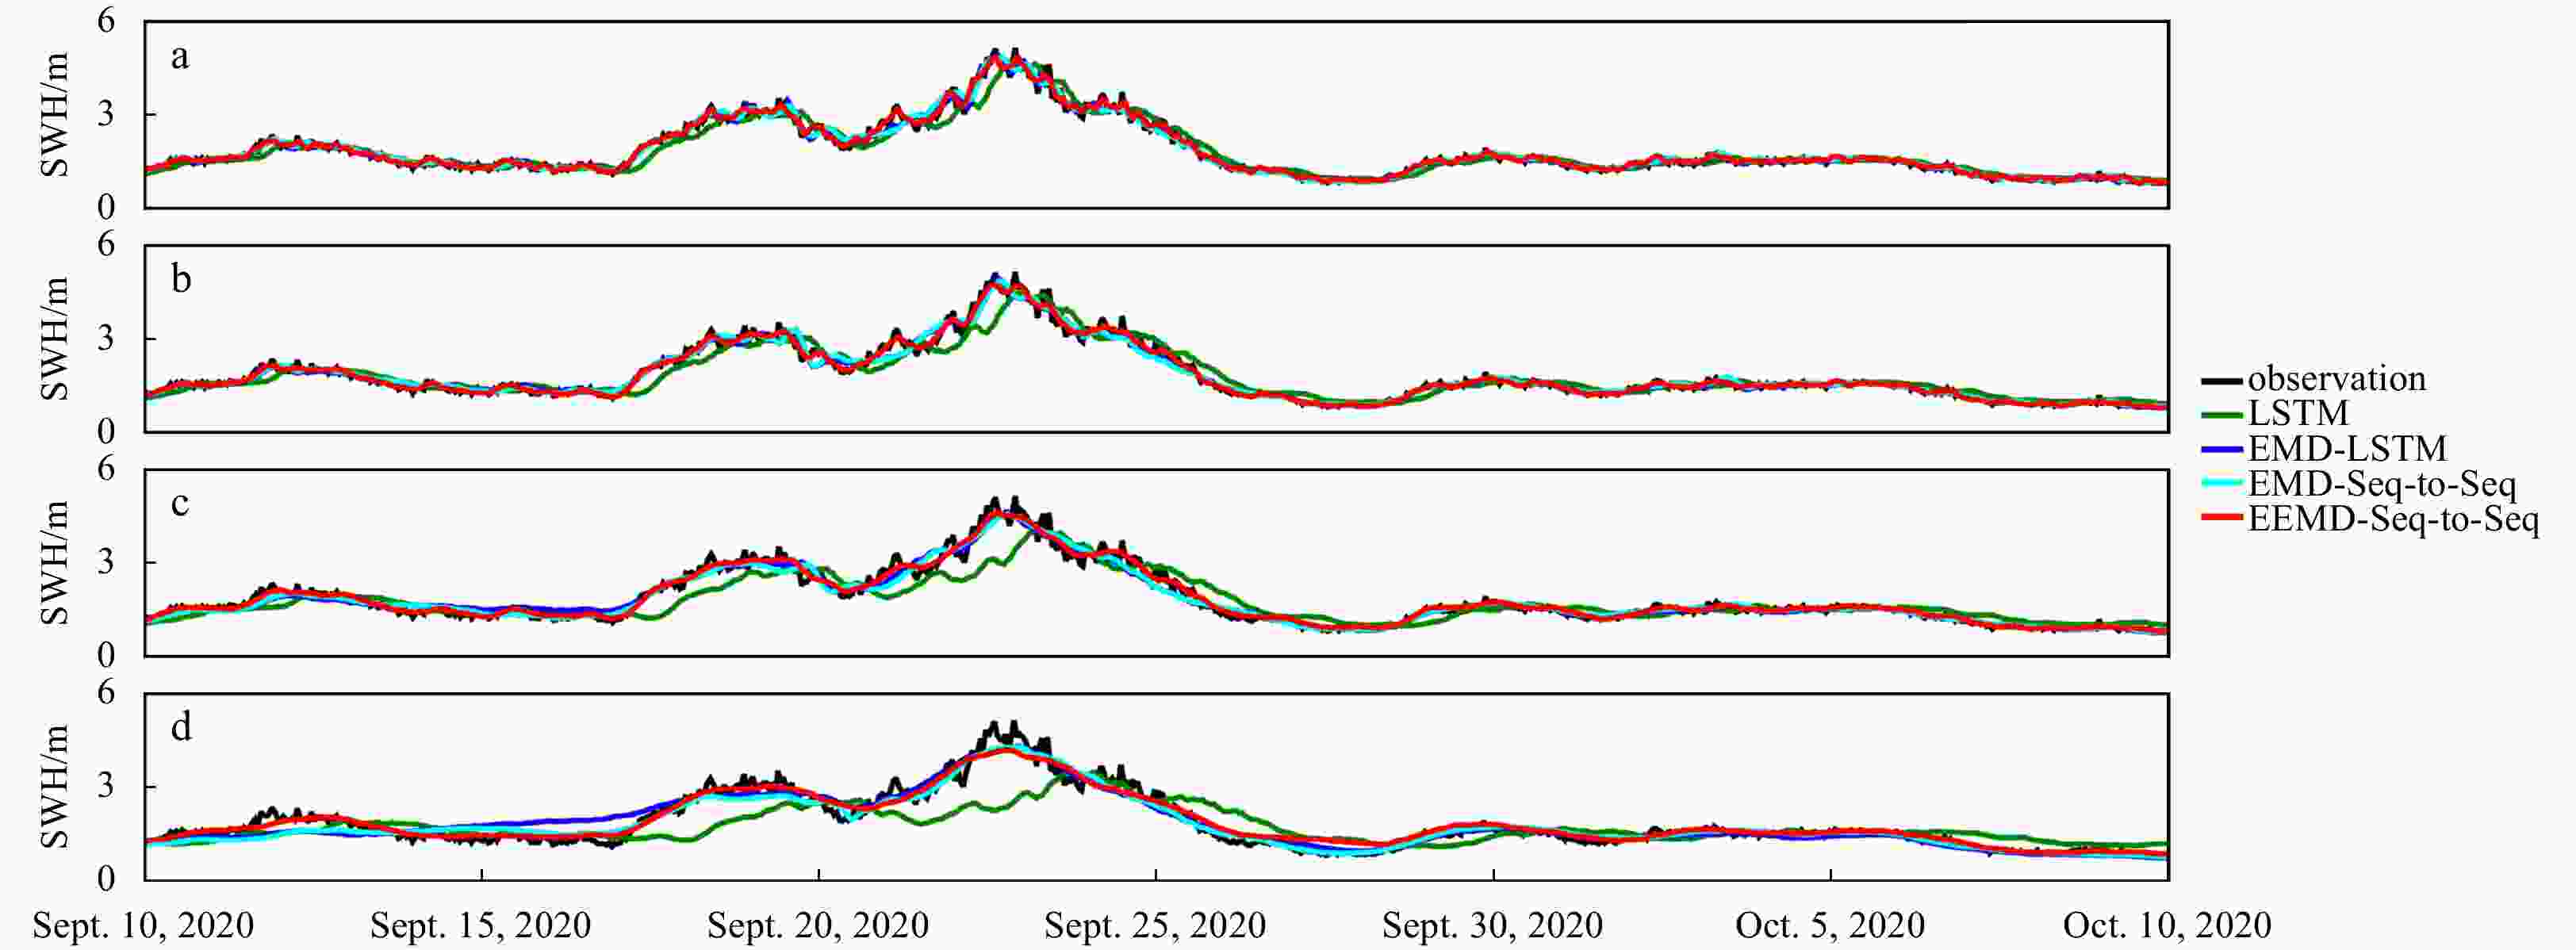
Figure 9. Comparison of significant wave height (SWH) forecasts of different models for Buoy 41046 at the 3-h (a), 6-h (b), 12-h (c) and 24-h (d) windows. LSTM: long short-term memory; EEMD-Seq-to-Seq: ensemble empirical mode decomposition with the sequence-to-sequence model.
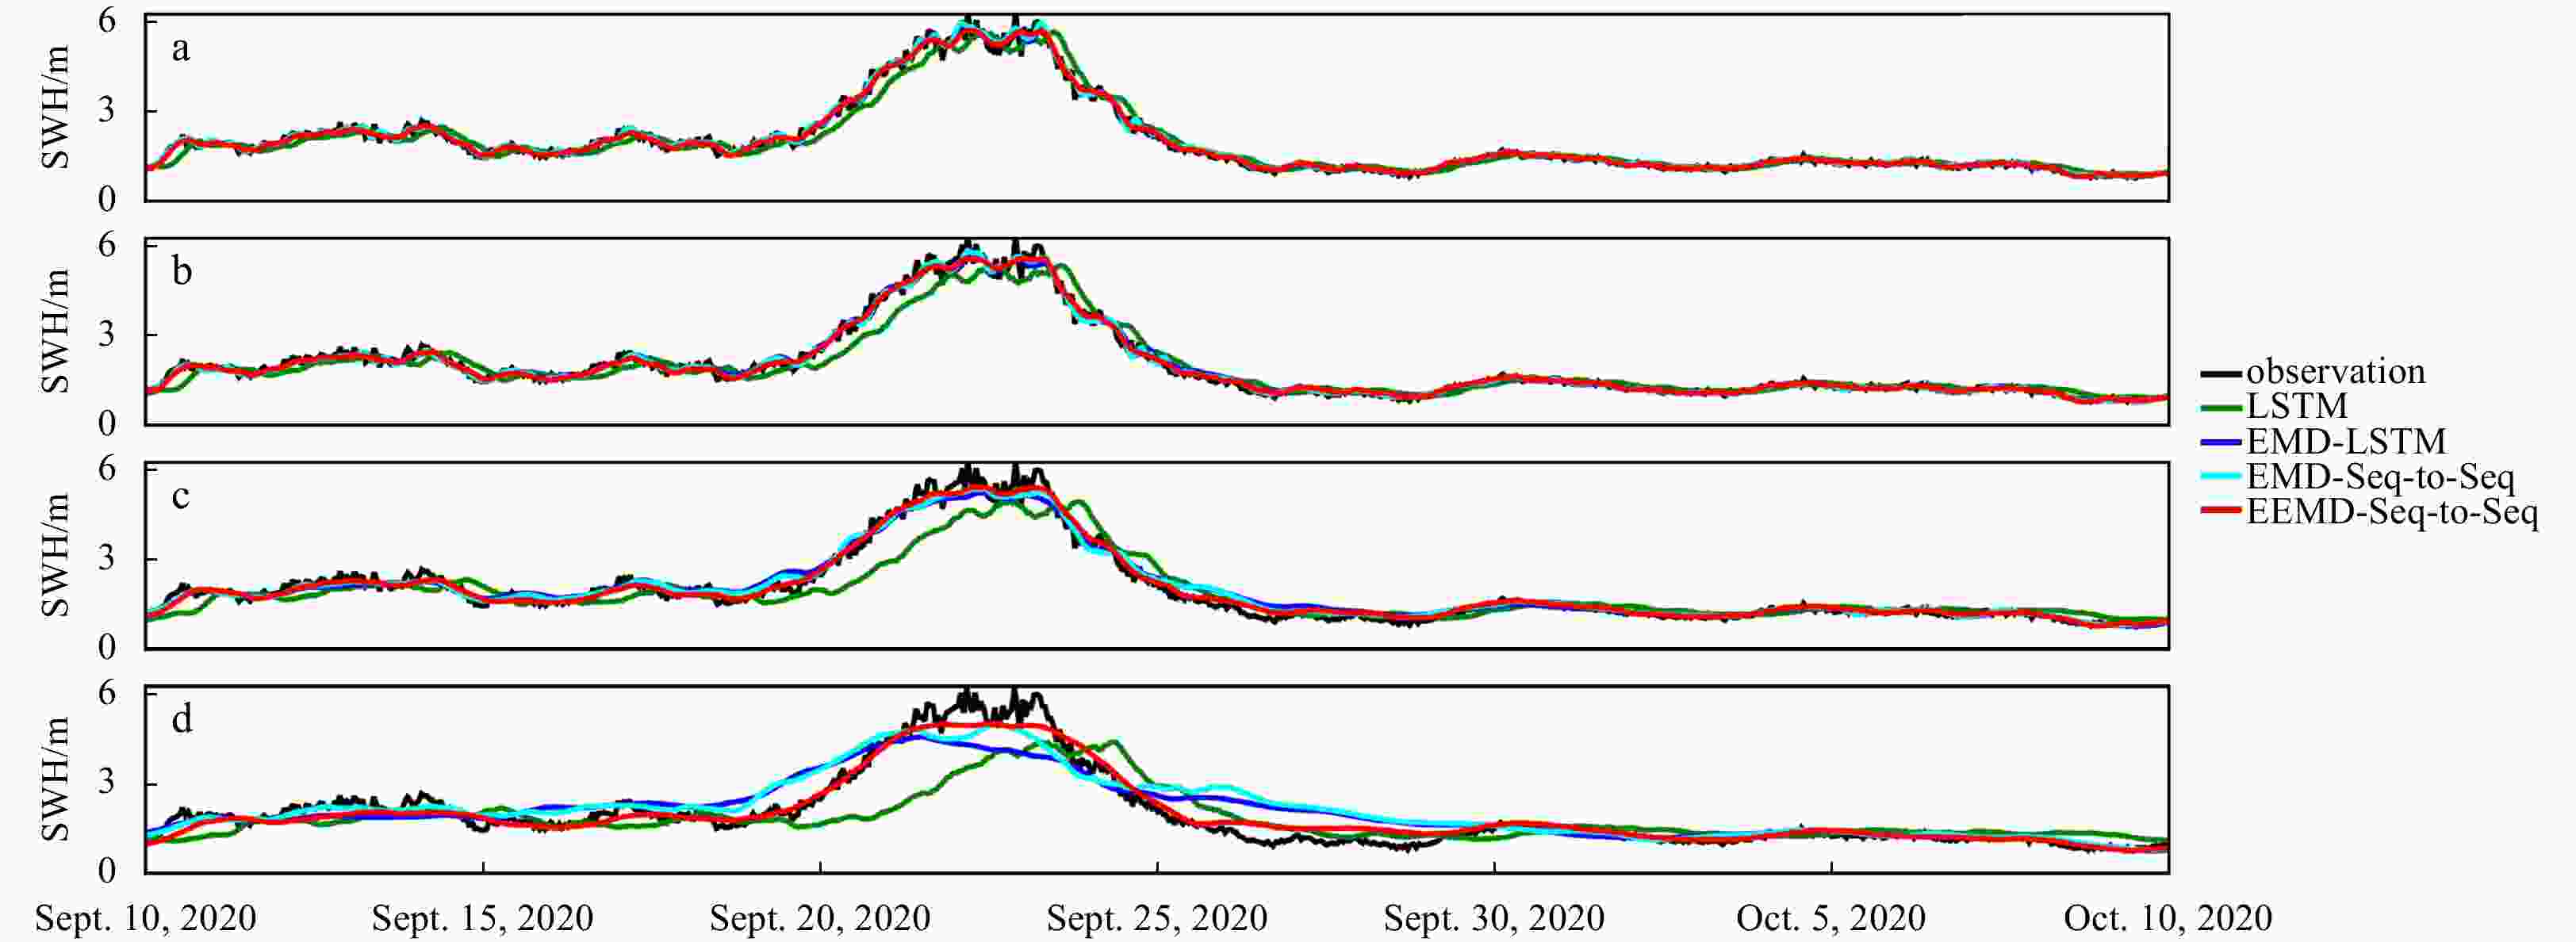
Figure 10. Comparison of significant wave height (SWH) forecasts of different models for Buoy 41047 at the 3-h (a), 6-h (b), 12-h (c) and 24-h (d) windows. LSTM: long short-term memory; EEMD-Seq-to-Seq: ensemble empirical mode decomposition with the sequence-to-sequence model.
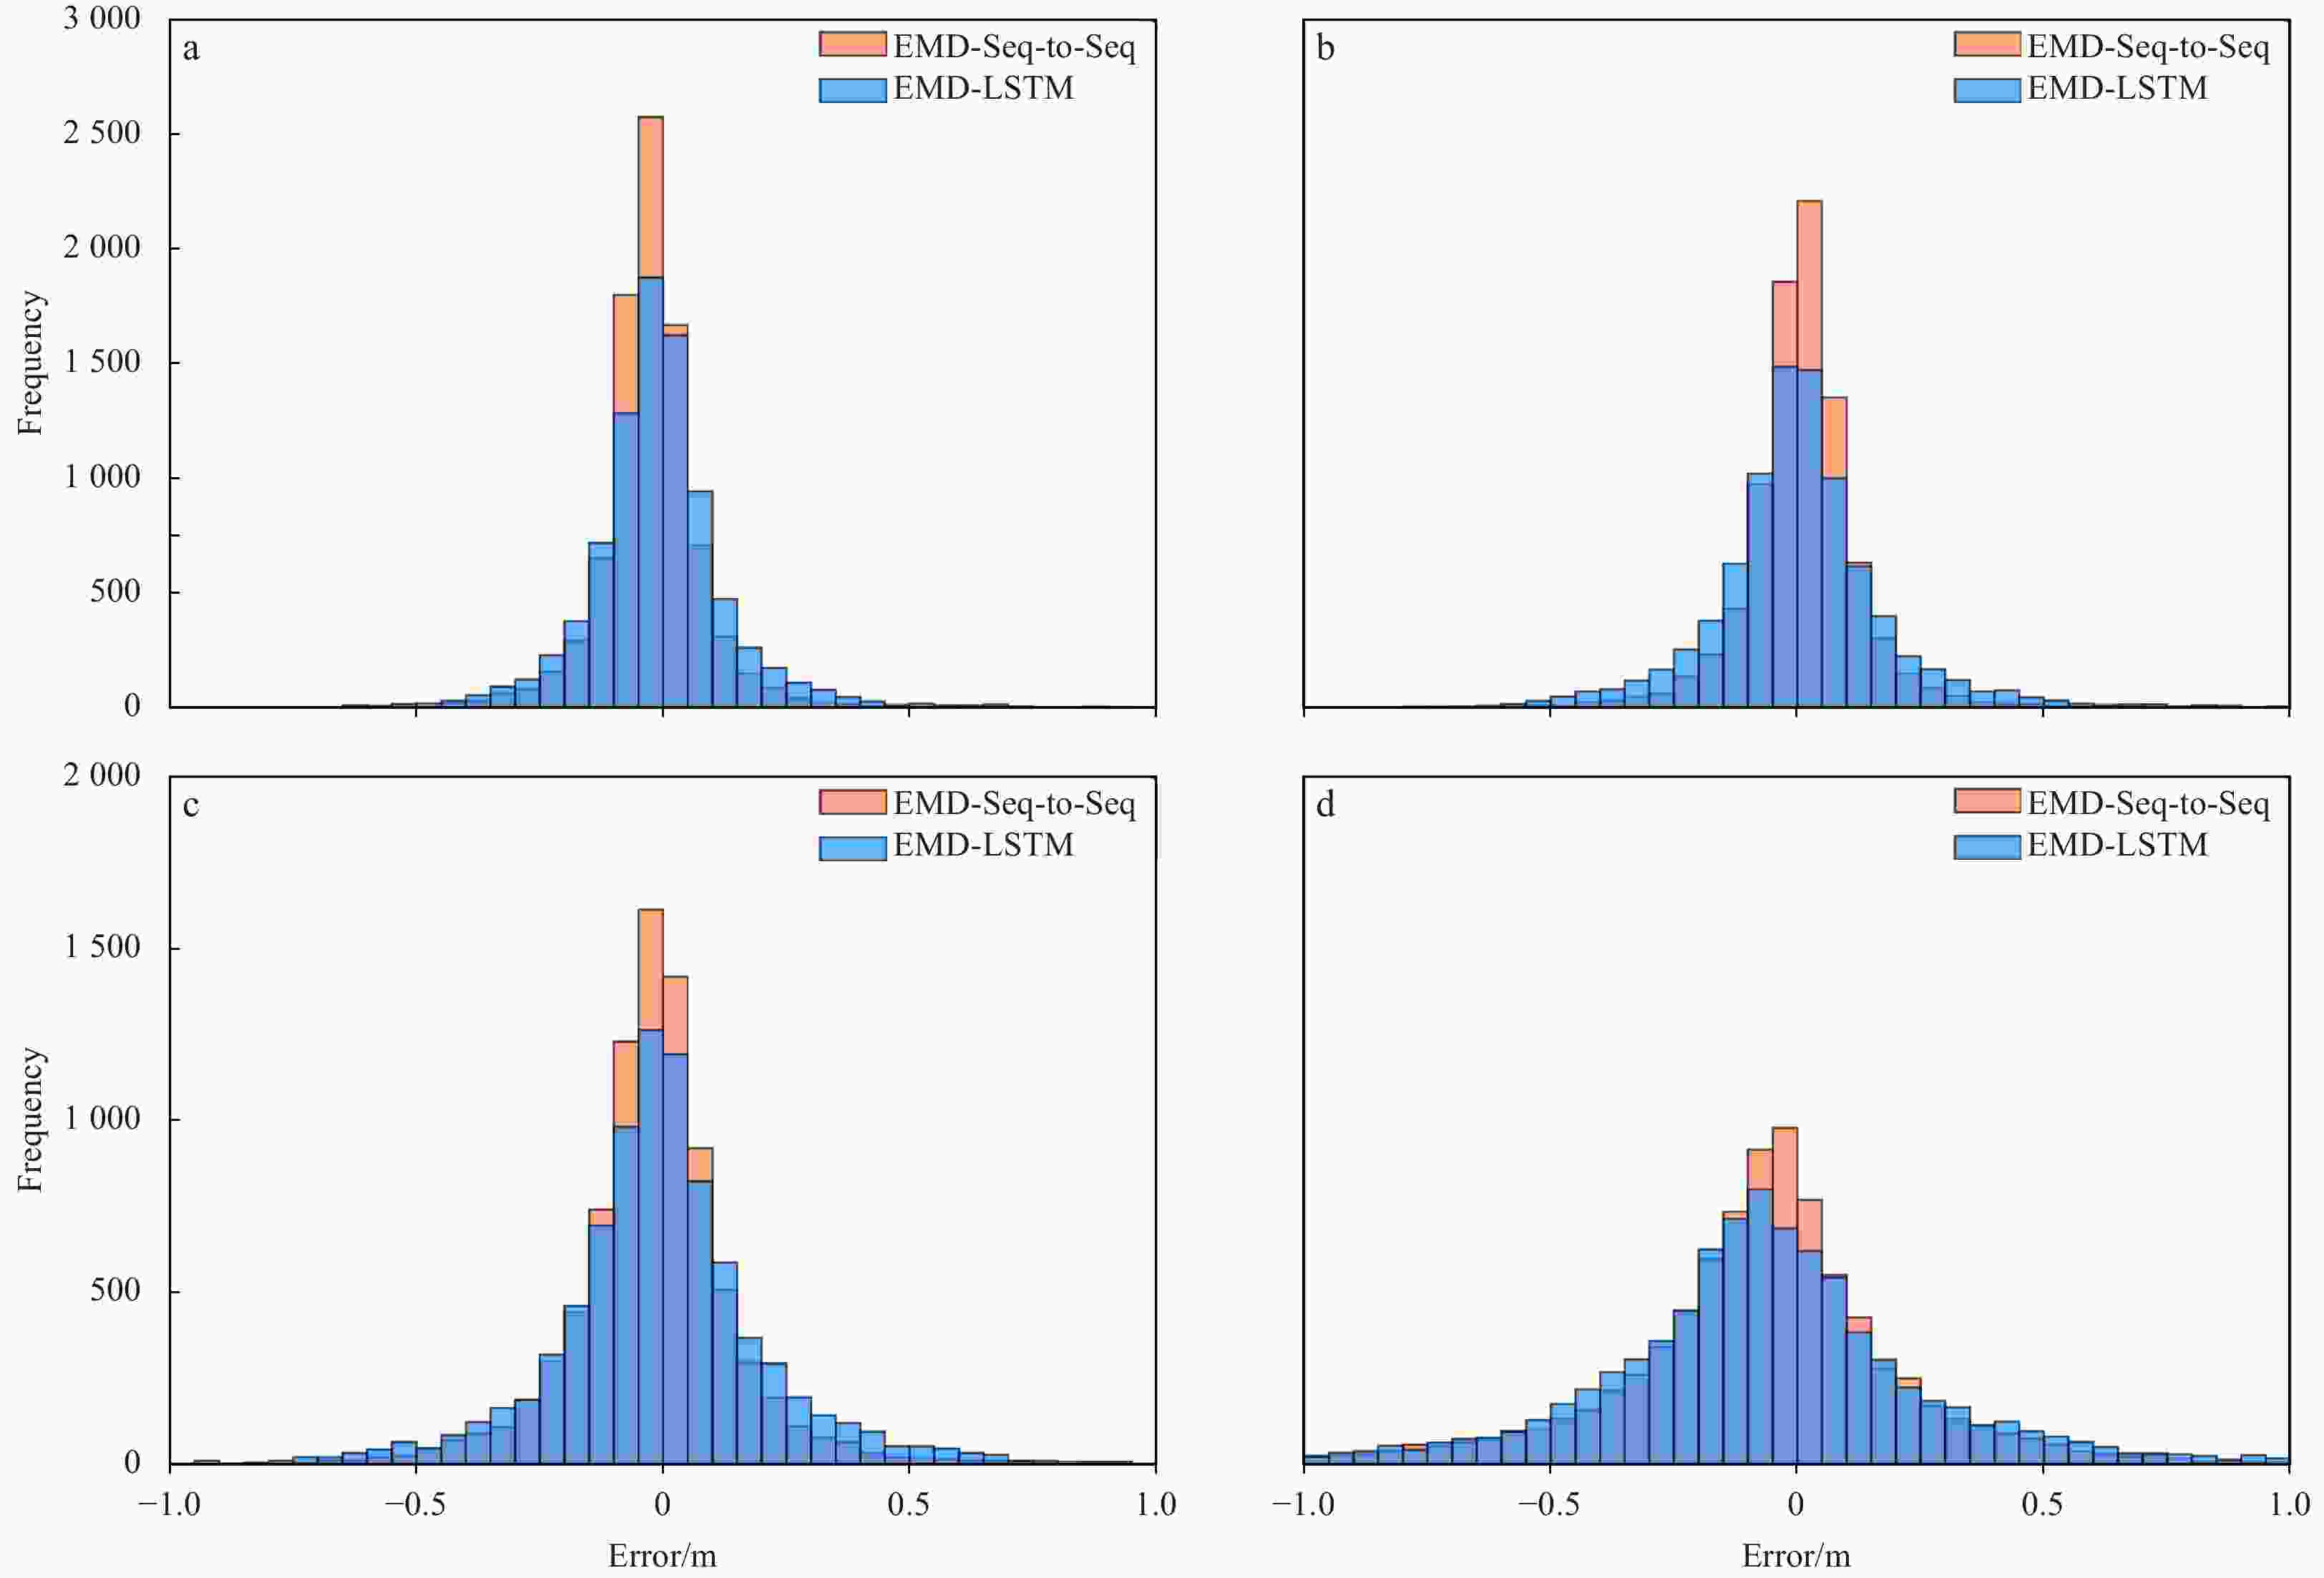
Figure 11. Comparison of empirical mode decomposition-long short-term memory (EMD-LSTM) and EMD-sequence-to-sequence significant wave height forecast errors at the 3-h (a), 6-h (b), 12-h (c) and 24-h (d) forecast windows for Buoy 41047.
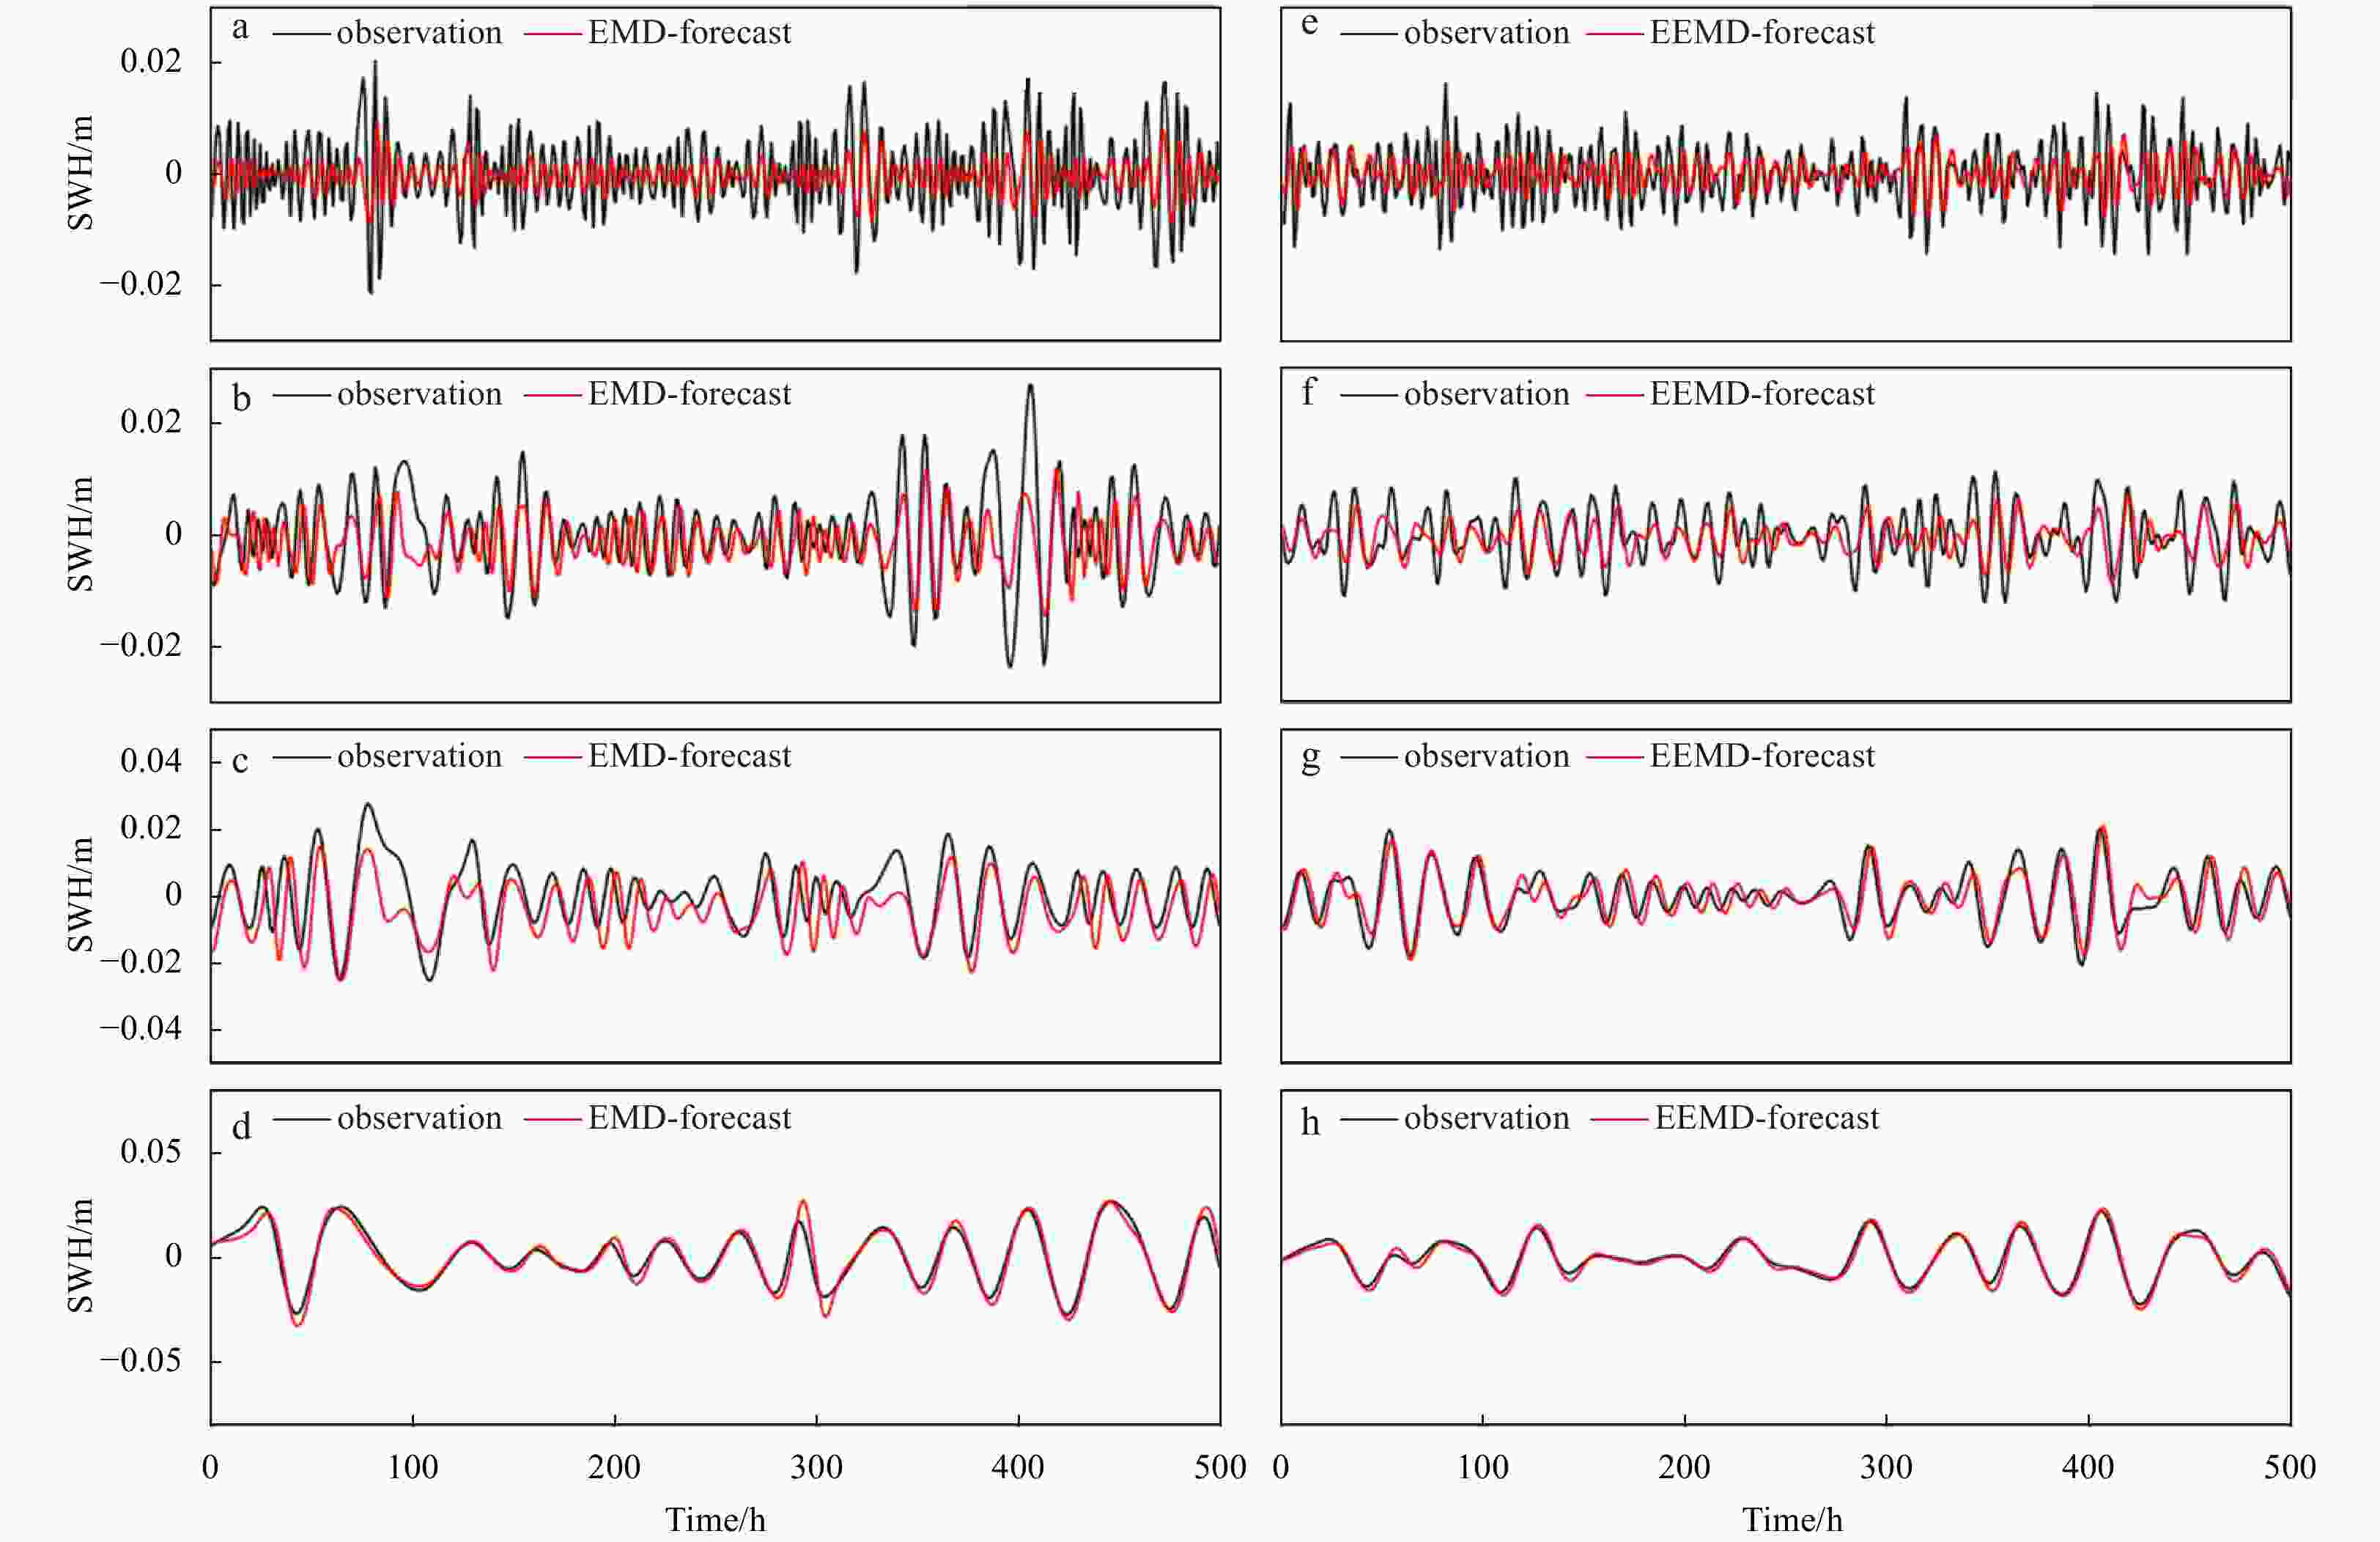
Figure 12. Comparison of significant wave heights (SWHs) of the 2nd, 3rd, 4th and 5th intrinsic mode functions through empirical mode decomposition model (a–d) and ensemble empirical mode decomposition model (e–h).
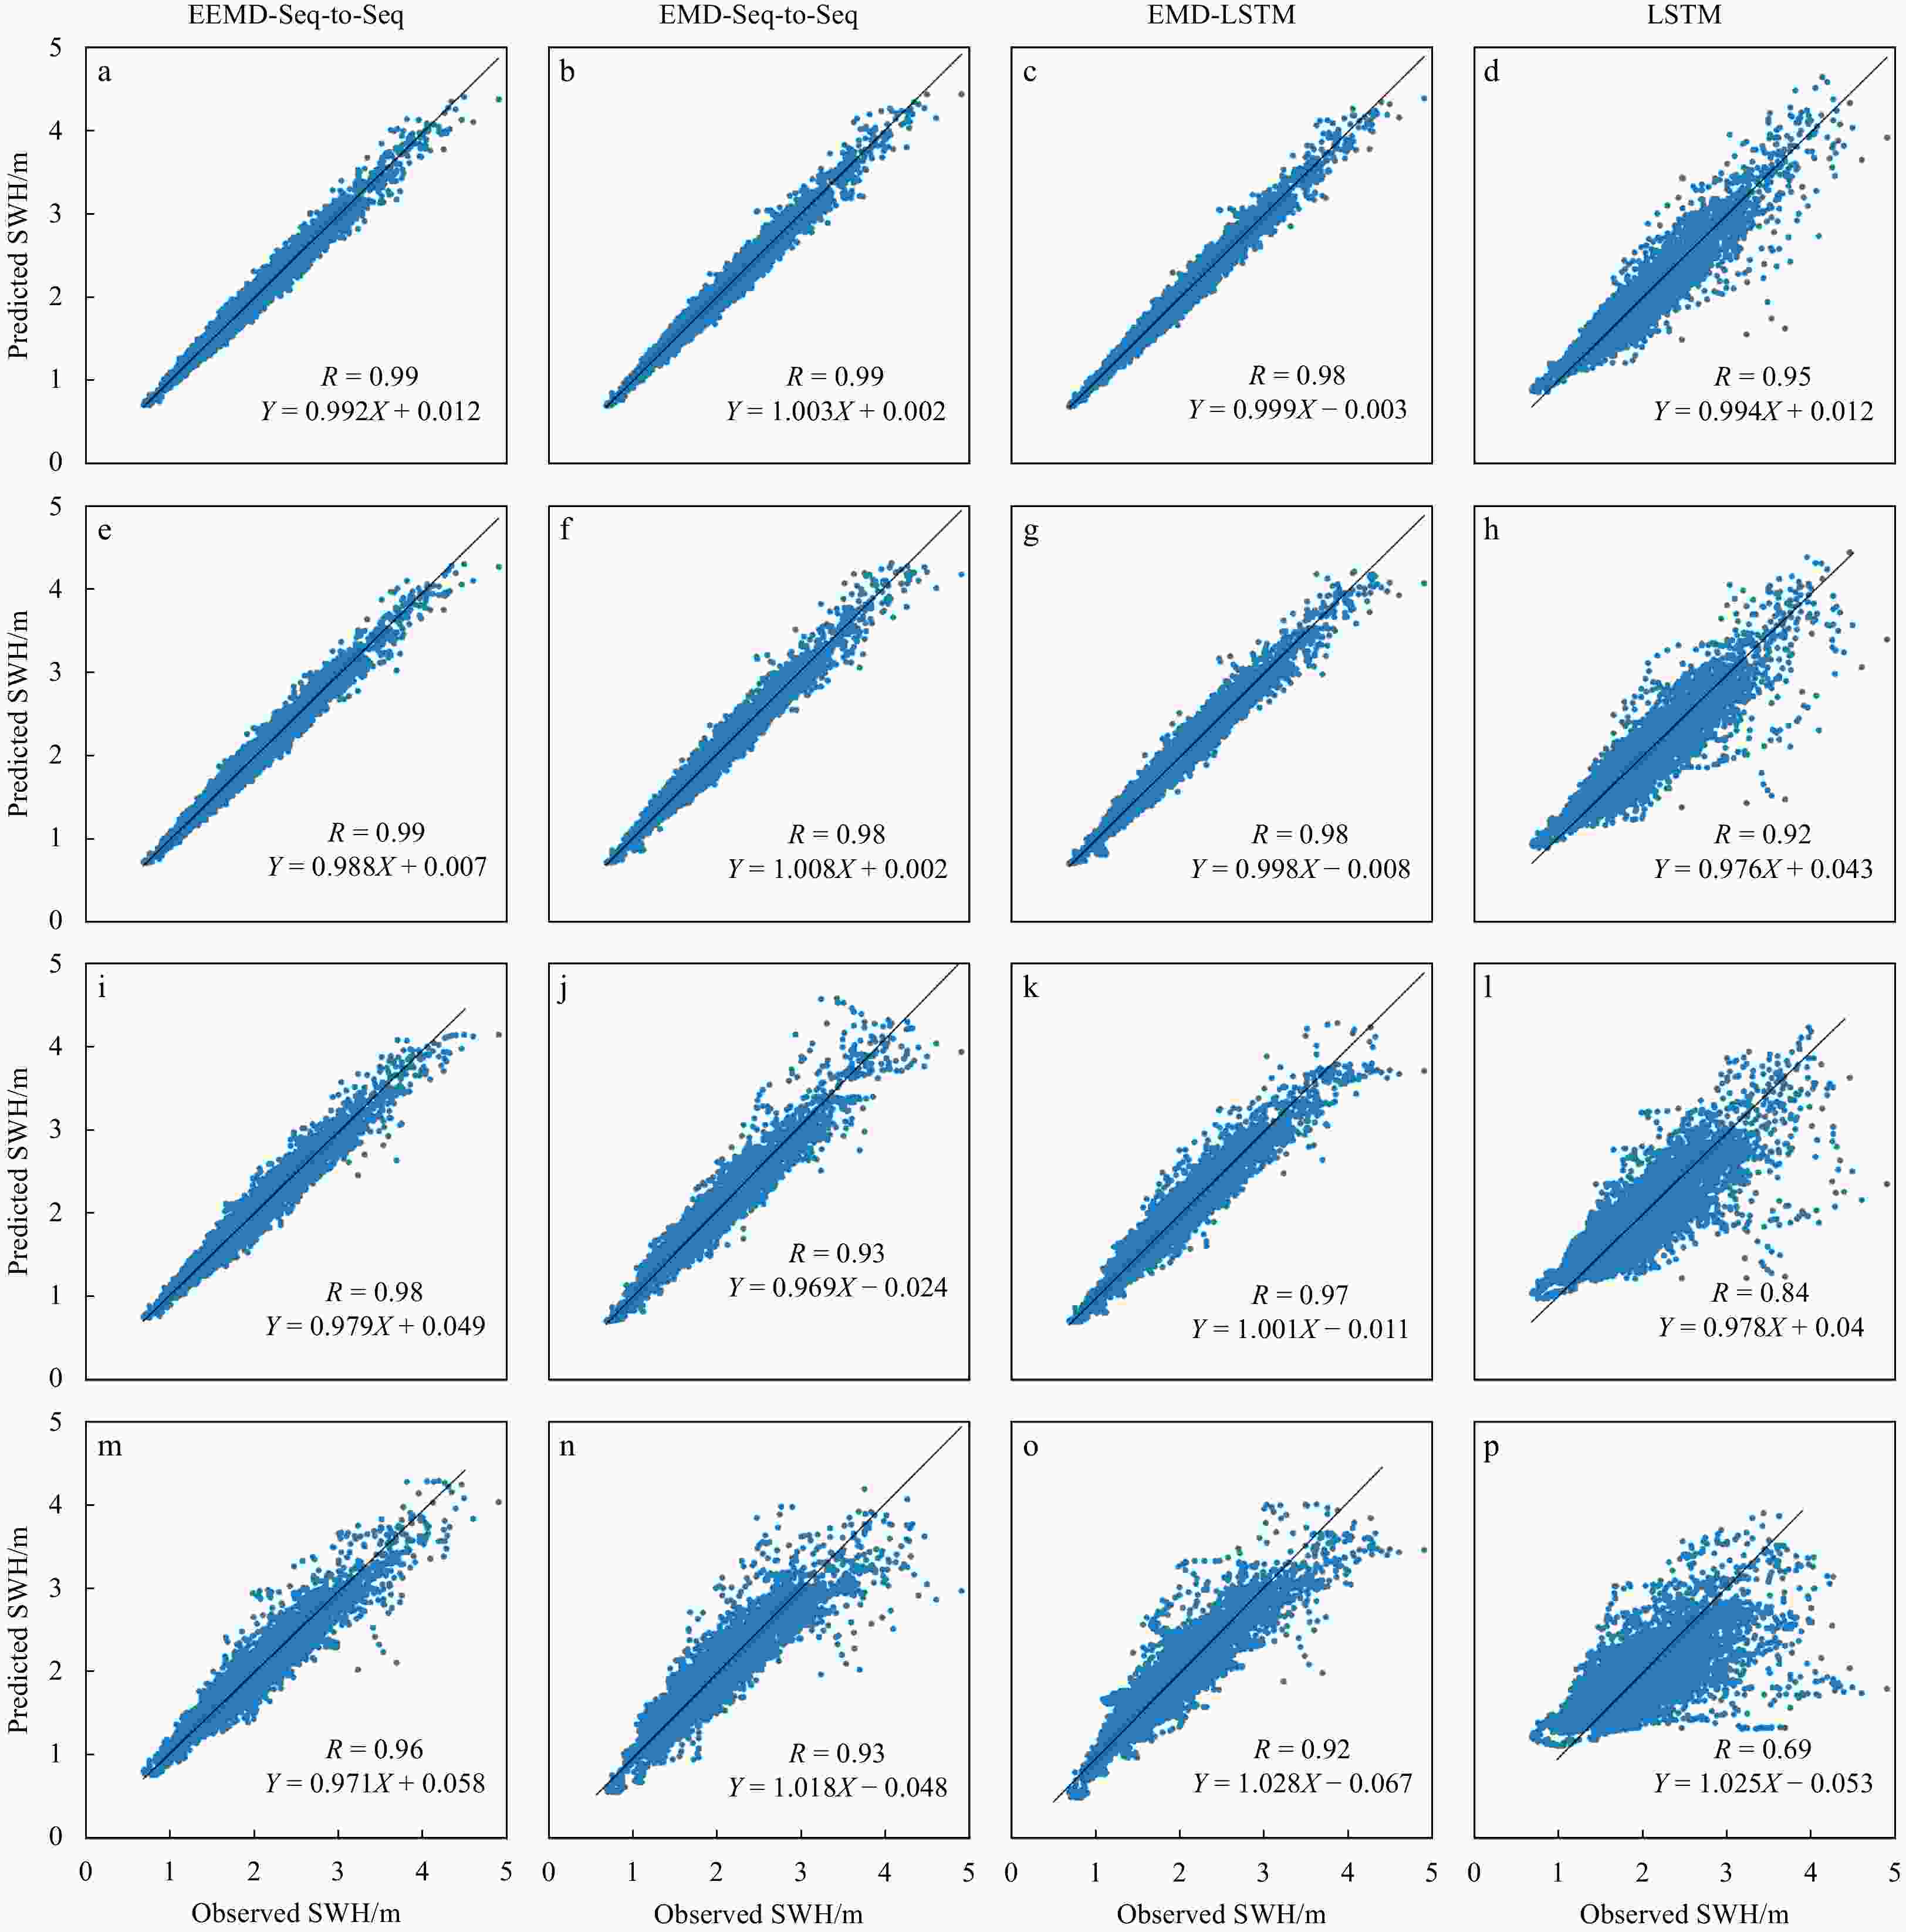
Figure 13. Scatter diagram of the observed and predicted significant wave height (SWHs) obtained by different algorithms at Buoy 41040. a–d for 3-h forecast window, e–h for 6-h forecast window, i–l for 12-h forecast window, m–p for 24-h forecast window.
Table 1. Data statistics of the selected buoys from January 1, 2019 to December 31, 2020 (data acquired from National Data Buoy Center)
Buoy ID Latitude Longitude Water depth/m Number of observations
(before interpolation)Number of observations
(after interpolation)41040 14.542°N 53.341°W 5 159 17 273 17 520 41044 21.582°N 58.630°W 5 419 17 280 17 520 41046 23.822°N 68.384°W 5 549 16 924 17 520 41047 27.514°N 71.494°W 5 321 17 234 17 520  下载: 导出CSV
Table 2. Comparisons of error statistics among four algorithms at the 3-h, 6-h, 12-h, 24-h, 48-h and 72-h forecast windows for Buoy 41040
Time span LSTM EMD-LSTM EMD-Seq-to-Seq EEMD-Seq-to-Seq RMSE/m MAE/m MAPE/% R RMSE/m MAE/m MAPE/% R RMSE/m MAE/m MAPE/% R RMSE/m MAE/m MAPE/% R 3 h 0.17 0.12 6.55 0.95 0.08 0.06 3.25 0.98 0.08 0.06 3.25 0.99 0.08 0.06 3.18 0.99 6 h 0.22 0.15 8.12 0.92 0.10 0.07 3.9224 0.98 0.10 0.07 3.79 0.98 0.09 0.06 3.33 0.99 12 h 0.29 0.21 11.08 0.84 0.14 0.10 5.32 0.97 0.14 0.10 5.18 0.93 0.11 0.08 4.32 0.98 24 h 0.39 0.28 14.93 0.69 0.21 0.15 7.93 0.92 0.20 0.14 7.45 0.93 0.16 0.12 6.04 0.96 48 h 0.48 0.34 18.43 0.47 0.31 0.21 11.50 0.83 0.31 0.22 11.66 0.83 0.27 0.18 9.32 0.87 72 h 0.51 0.37 20.02 0.36 0.38 0.26 15.24 0.74 0.38 0.29 15.28 0.70 0.38 0.29 14.89 0.70 Note: RMSE: root mean square error; MAE: mean absolute error; MAPE: mean absolute percentage error; R: Pearson correlation coefficient; LSTM: long short-term memory; EEMD: ensemble empirical mode decomposition; Seq-to-Seq: sequence-to-sequence deep learning model.
下载: 导出CSV
Table 3. Comparisons of error statistics among four algorithms at the 3-h, 6-h, 12-h, 24-h, 48-h and 72-h forecast windows for Buoy 41044
Time
spanLSTM EMD-LSTM EMD-Seq-to-Seq EEMD-Seq-to-Seq RMSE/m MAE/m MAPE/% R RMSE/m MAE/m MAPE/% R RMSE/m MAE/m MAPE/% R RMSE/m MAE/m MAPE/% R 3 h 0.21 0.13 7.25 0.95 0.11 0.07 3.59 0.99 0.11 0.08 4.24 0.99 0.08 0.05 2.93 0.99 6 h 0.27 0.17 9.23 0.92 0.14 0.08 4.42 0.98 0.14 0.09 4.98 0.98 0.09 0.06 3.63 0.99 12 h 0.38 0.24 13.22 0.82 0.21 0.12 6.33 0.97 0.20 0.13 7.08 0.96 0.13 0.09 4.99 0.98 24 h 0.54 0.34 18.90 0.52 0.33 0.20 10.95 0.88 0.33 0.20 14.61 0.89 0.21 0.14 7.44 0.91 48 h 0.65 0.42 23.93 0.31 0.51 0.31 18.32 0.72 0.47 0.30 15.16 0.75 0.32 0.21 10.85 0.88 72 h 0.68 0.44 25.73 0.16 0.53 0.32 18.79 0.72 0.51 0.33 17.14 0.73 0.48 0.32 16.87 0.72 Note: RMSE: root mean square error; MAE: mean absolute error; MAPE: mean absolute percentage error; R: Pearson correlation coefficient; LSTM: long short-term memory; EEMD: ensemble empirical mode decomposition; Seq-to-Seq: sequence-to-sequence deep learning model.
下载: 导出CSV
Table 4. Comparisons of error statistics among four algorithms at the 3-h, 6-h, 12-h, 24-h, 48-h and 72-h forecast windows for Buoy 41046
Time span LSTM EMD-LSTM EMD-Seq-to-Seq EEMD-Seq-to-Seq RMSE/m MAE/m MAPE/% R RMSE/m MAE/m MAPE/% R RMSE/m MAE/m MAPE/% R RMSE/m MAE/m MAPE/% R 3 h 0.23 0.15 8.59 0.95 0.11 0.07 4.03 0.99 0.12 0.08 4.61 0.99 0.08 0.06 3.13 0.99 6 h 0.29 0.19 11.12 0.91 0.13 0.09 5.09 0.98 0.13 0.09 5.13 0.98 0.09 0.06 3.44 0.99 12 h 0.41 0.26 15.92 0.83 0.19 0.13 7.31 0.96 0.18 0.12 6.68 0.97 0.12 0.09 4.81 0.99 24 h 0.55 0.37 22.64 0.66 0.30 0.20 11.38 0.91 0.27 0.18 10.42 0.93 0.21 0.15 8.09 0.96 48 h 0.67 0.46 28.75 0.41 0.42 0.31 16.84 0.83 0.38 0.27 15.32 0.85 0.32 0.22 12.35 0.90 72 h 0.71 0.49 30.60 0.30 0.47 0.34 18.48 0.77 0.46 0.33 18.66 0.77 0.42 0.30 16.54 0.83 Note: RMSE: root mean square error; MAE: mean absolute error; MAPE: mean absolute percentage error; R: Pearson correlation coefficient; LSTM: long short-term memory; EEMD: ensemble empirical mode decomposition; Seq-to-Seq: sequence-to-sequence deep learning model.
下载: 导出CSV
Table 5. Comparisons of error statistics among four algorithms at the 3-h, 6-h, 12-h, 24-h, 48-h and 72-h forecast windows for Buoy 41047
Time span LSTM EMD-LSTM EMD-Seq-to-Seq EEMD-Seq-to-Seq RMSE/m MAE/m MAPE/% R RMSE/m MAE/m MAPE/% R RMSE/m MAE/m MAPE/% R RMSE/m MAE/m MAPE/% R 3 h 0.25 0.16 9.39 0.96 0.13 0.07 3.97 0.99 0.11 0.07 4.12 0.99 0.10 0.06 3.91 0.99 6 h 0.33 0.21 12.43 0.93 0.13 0.09 4.95 0.98 0.12 0.08 4.74 0.99 0.11 0.07 4.56 0.99 12 h 0.45 0.30 18.13 0.85 0.21 0.13 7.35 0.97 0.19 0.12 6.90 0.97 0.15 0.11 6.16 0.98 24 h 0.63 0.43 26.43 0.68 0.39 0.26 13.01 0.91 0.37 0.24 12.53 0.91 0.25 0.17 10.03 0.96 48 h 0.79 0.55 34.01 0.40 0.58 0.38 20.85 0.79 0.55 0.38 22.03 0.78 0.39 0.27 16.81 0.89 72 h 0.83 0.59 36.52 0.25 0.62 0.43 23.76 0.71 0.60 0.42 24.95 0.72 0.49 0.36 19.85 0.82 Note: RMSE: root mean square error; MAE: mean absolute error; MAPE: mean absolute percentage error; R: Pearson correlation coefficient; LSTM: long short-term memory; EEMD: ensemble empirical mode decomposition; Seq-to-Seq: sequence-to-sequence deep learning model.
下载: 导出CSV
-
Ardhuin F, Stopa J E, Chapron B, et al. 2019. Observing sea states. Frontiers in Marine Science, 6: 124. doi: 10.3389/fmars.2019.00124 Bahdanau D, Cho K, Bengio Y. 2014. Neural machine translation by jointly learning to align and translate. arXiv preprint arXiv: 1409.0473 Bokde N, Feijóo A, Al-Ansari N, et al. 2020. The hybridization of ensemble empirical mode decomposition with forecasting models: application of short-term wind speed and power modeling. Energies, 13(7): 1666. doi: 10.3390/en13071666 Caires S, Sterl A. 2005. 100-year return value estimates for ocean wind speed and significant wave height from the ERA-40 data. Journal of Climate, 18(7): 1032–1048. doi: 10.1175/JCLI-3312.1 Deo M C, Naidu C S. 1998. Real time wave forecasting using neural networks. Ocean Engineering, 26(3): 191–203. doi: 10.1016/S0029-8018(97)10025-7 Duan W Y, Han Y, Huang L M, et al. 2016. A hybrid EMD-SVR model for the short-term prediction of significant wave height. Ocean Engineering, 124: 54–73. doi: 10.1016/j.oceaneng.2016.05.049 Etemad-Shahidi A, Mahjoobi J. 2009. Comparison between M5′ model tree and neural networks for prediction of significant wave height in Lake Superior. Ocean Engineering, 36(15−16): 1175–1181. doi: 10.1016/j.oceaneng.2009.08.008 Fan Shuntao, Xiao Nianhao, Dong Sheng. 2020. A novel model to predict significant wave height based on long short-term memory network. Ocean Engineering, 205: 107298. doi: 10.1016/j.oceaneng.2020.107298 Gong Gangjun, An Xiaonan, Mahato N K, et al. 2019. Research on short-term load prediction based on Seq2seq model. Energies, 12(16): 3199. doi: 10.3390/en12163199 Graves A. 2012. Supervised Sequence Labelling with Recurrent Neural Networks. Heidelberg: Springer Berlin, 37–45 Huang N E, Shen Zheng, Long S R, et al. 1998. The empirical mode decomposition and the Hilbert spectrum for nonlinear and non-stationary time series analysis. Proceedings of the Royal Society of London. Series A: Mathematical, Physical and Engineering Sciences, 454(1971): 903–995 Karatzoglou A, Jablonski A, Beigl M. 2018. A Seq2Seq learning approach for modeling semantic trajectories and predicting the next location. In: Proceedings of the 26th ACM SIGSPATIAL International Conference on Advances in Geographic Information Systems. Washington, Seattle: ACM Keneshloo Y, Shi Tian, Ramakrishnan N, et al. 2020. Deep reinforcement learning for sequence-to-sequence models. IEEE Transactions on Neural Networks and Learning Systems, 31(7): 2469–2489 Mahjoobi J, Mosabbeb E A. 2009. Prediction of significant wave height using regressive support vector machines. Ocean Engineering, 36(5): 339–347. doi: 10.1016/j.oceaneng.2009.01.001 Nikoo M R, Kerachian R, Alizadeh M R. 2018. A fuzzy KNN-based model for significant wave height prediction in large lakes. Oceanologia, 60(2): 153–168. doi: 10.1016/j.oceano.2017.09.003 Oh J, Suh K D. 2018. Real-time forecasting of wave heights using EOF–wavelet–neural network hybrid model. Ocean Engineering, 150: 48–59. doi: 10.1016/j.oceaneng.2017.12.044 Pirhooshyaran M, Snyder L V. 2020. Forecasting, hindcasting and feature selection of ocean waves via recurrent and sequence-to-sequence networks. Ocean Engineering, 207: 107424. doi: 10.1016/j.oceaneng.2020.107424 Raj N, Brown J. 2021. An EEMD-BiLSTM algorithm integrated with Boruta random forest optimiser for significant wave height forecasting along coastal areas of Queensland, Australia. Remote Sensing, 13(8): 1456. doi: 10.3390/rs13081456 Sutskever I, Vinyals O, Le Q V. 2014. Sequence to sequence learning with neural networks. In: Proceedings of the 27th International Conference on Neural Information Processing Systems. Cambridge: MIT Press Vanem E. 2016. Joint statistical models for significant wave height and wave period in a changing climate. Marine Structures, 49: 180–205. doi: 10.1016/j.marstruc.2016.06.001 Vaswani A, Shazeer N, Parmar N, et al. 2017. Attention is all you need. In: Proceedings of the 31st International Conference on Neural Information Processing Systems. Red Hook: Curran Associates Inc Wang Lina, Deng Xilin, Ge Peng, et al. 2022. CNN-BiLSTM-attention model in forecasting wave height over South-East China Seas. Computers, Materials & Continua, 73(1): 2151–2168 Wu Zhaohua, Huang N E. 2009. Ensemble empirical mode decomposition: a noise-assisted data analysis method. Advances in Adaptive Data Analysis, 1(1): 1–41. doi: 10.1142/S1793536909000047 Yang Shaobo, Deng Zegui, Li Xingfei, et al. 2021. A novel hybrid model based on STL decomposition and one-dimensional convolutional neural networks with positional encoding for significant wave height forecast. Renewable Energy, 173: 531–543. doi: 10.1016/j.renene.2021.04.010 Yang Yu, Wang Jun. 2021. Forecasting wavelet neural hybrid network with financial ensemble empirical mode decomposition and MCID evaluation. Expert Systems with Applications, 166: 114097. doi: 10.1016/j.eswa.2020.114097 Ye Lin, Dai Binhua, Pei Ming, et al. 2022. Combined approach for short-term wind power forecasting based on wave division and Seq2Seq model using deep learning. IEEE Transactions on Industry Applications, 58(2): 2586–2596. doi: 10.1109/TIA.2022.3146224 Zhang Yu, Li Yanting, Zhang Guangyao. 2020. Short-term wind power forecasting approach based on Seq2Seq model using NWP data. Energy, 213: 118371. doi: 10.1016/j.energy.2020.118371 Zhou Shuyi, Bethel B J, Sun Wenjin, et al. 2021. Improving significant wave height forecasts using a joint empirical mode decomposition–long short-term memory network. Journal of Marine Science and Engineering, 9(7): 744. doi: 10.3390/jmse9070744 Zhou Shuyi, Xie Wenhong, Lu Yuxiang, et al. 2021. ConvLSTM-based wave forecasts in the South and East China Seas. Frontiers in Marine Science, 8: 680079. doi: 10.3389/fmars.2021.680079 -


 点击查看大图

计量
- 文章访问数: 250
- HTML全文浏览量: 113
- PDF下载量: 13
- 被引次数: 0

