

A synthetic autonomous profiling float array in a Lagrangian particle tracking system
-
Abstract: Over the past two decades, numerous countries have actively participated in the International Argo Program, working toward the global “OneArgo” goal. China’s Argo program has deployed over 500 autonomous profiling floats in the Indo-Pacific, with 55 Beidou (BD) floats, equipped with the Beidou satellite communication system, currently operational. During the operation of the BD float network, we found that in addition to the limitation of floats battery, the loss may also be caused by communication loss due to the floats escaping from the Beidou-2’s short message coverage. In this study, float trajectories are simulated using velocity fields from an eddy-resolved resolution Estimating the Circulation and Climate of the Ocean, Phase Ⅱ (ECCO2) model and a Lagrangian particle tracking model programmed to represent the vertical motions of profiling floats. The simulations can help to explore both the representativeness and the predictability of profiling float displacements. By deploying a large number of synthetic floats in the Lagrangian particle tracking system, we construct probability density functions (PDFs) of the simulated-float trajectory among key oceans, for example, a joint region of East Indian−South China Sea−Northwest Pacific Ocean (5°–40°N, 70°–140°E), which is generally similar to the location of the present BD float network. These statistics can help to estimate the chance of floats drifting into shallow seas (such as the East China Sea) and out of the coverage of the Beidou satellite communication. With this knowledge changes to the future China’s Argo observing system could be made.
-
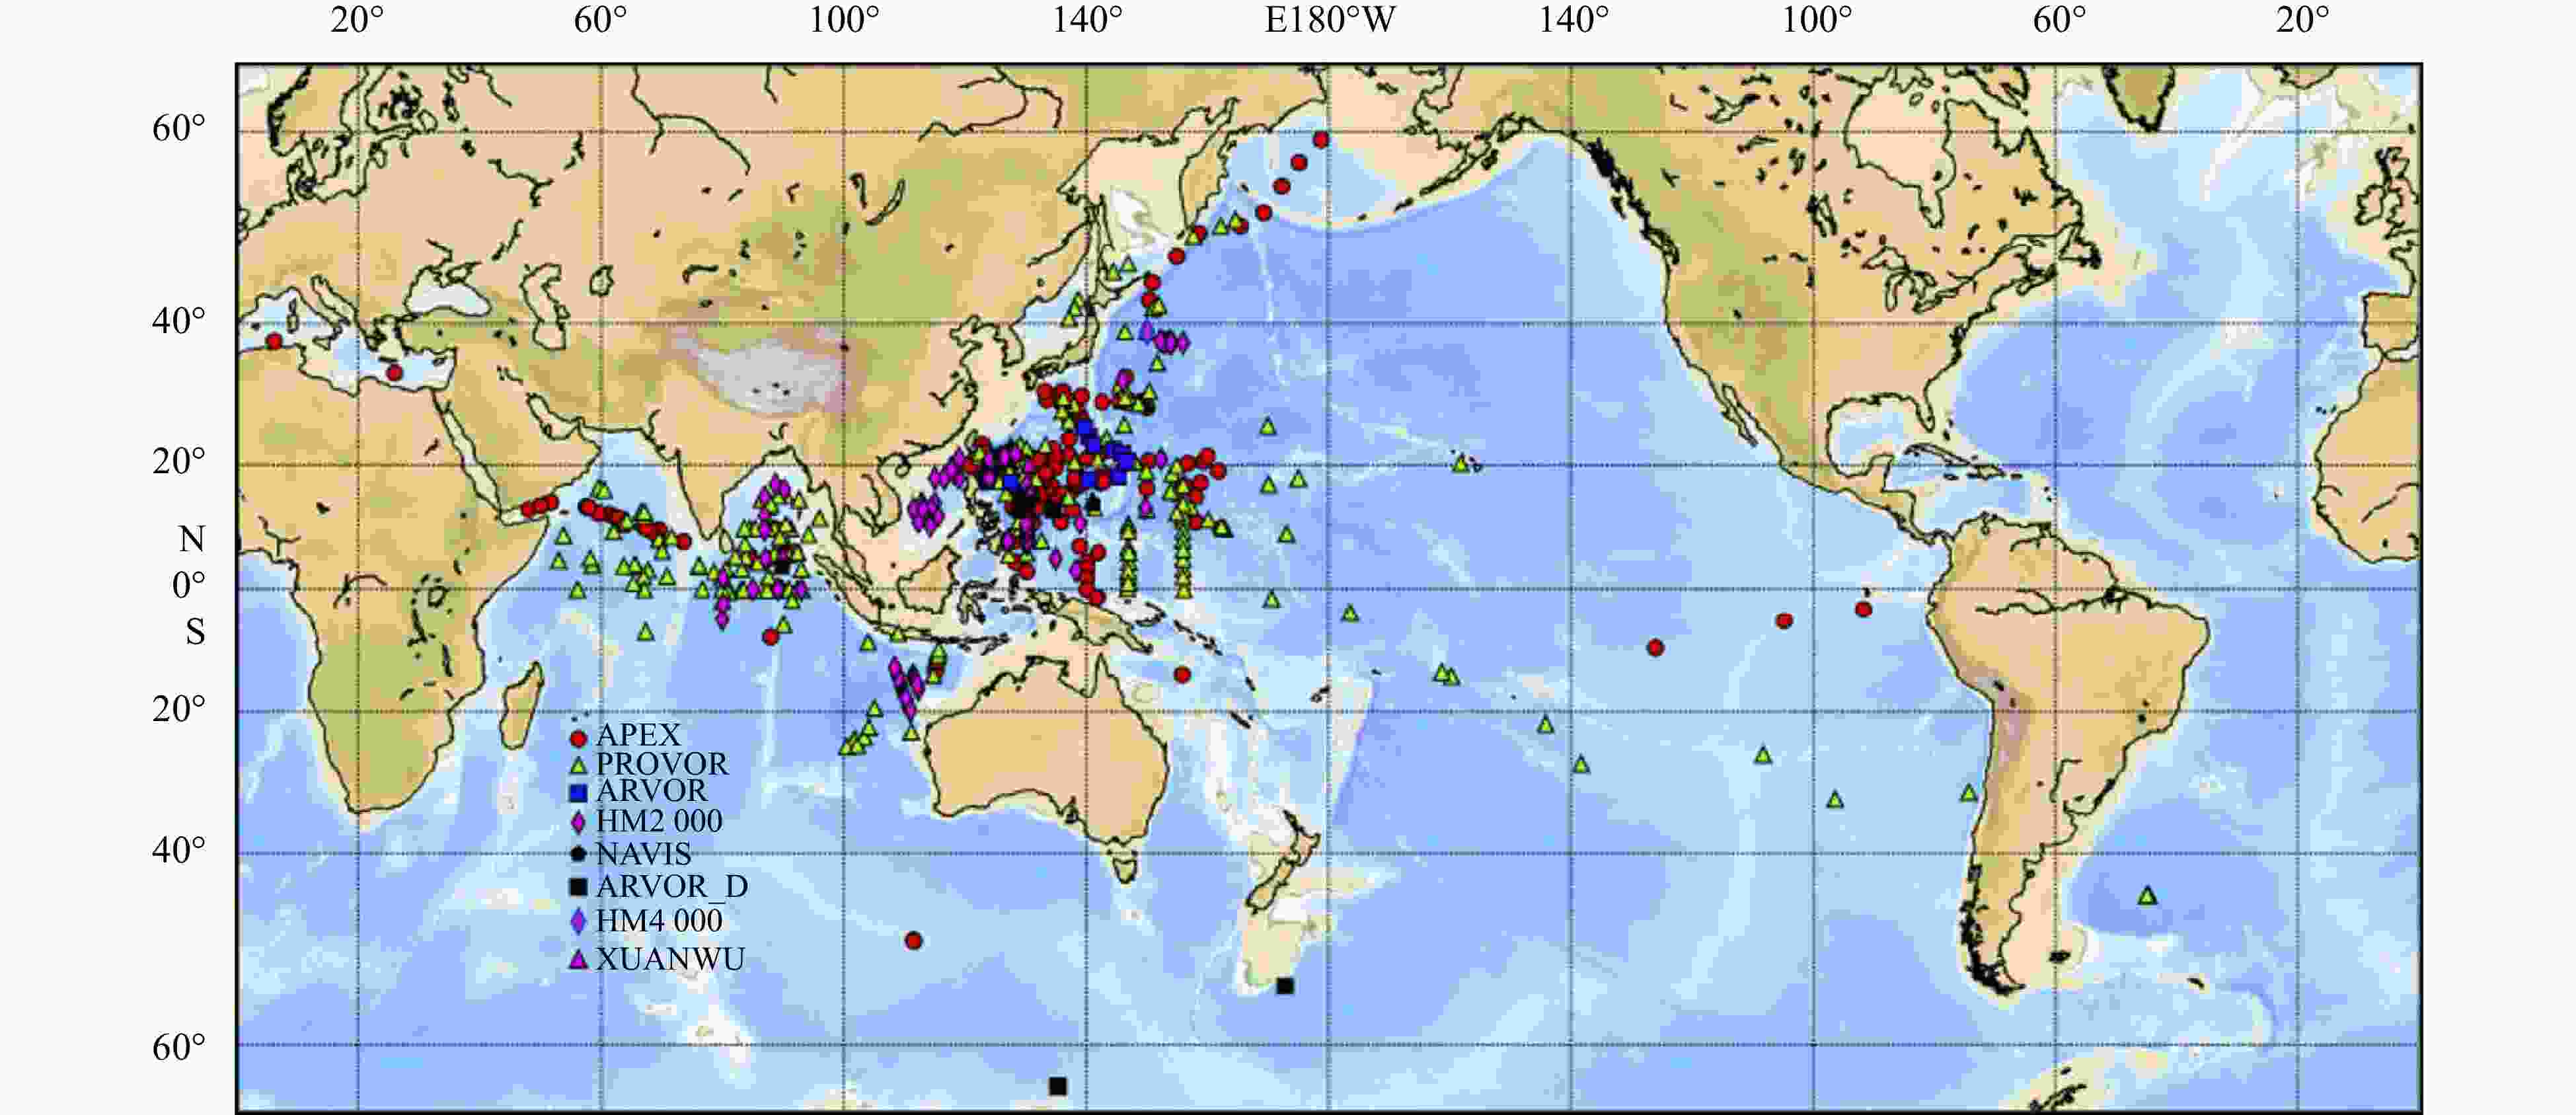
Figure 1. Launch positions of all China profiling floats since 2002. By February 7th, 2023, a total of 550 China profiling floats have been deployed. The different markers indicate the various types of floats (access from China Argo Real-time Data Center,
http://www.Argo.org.cn ).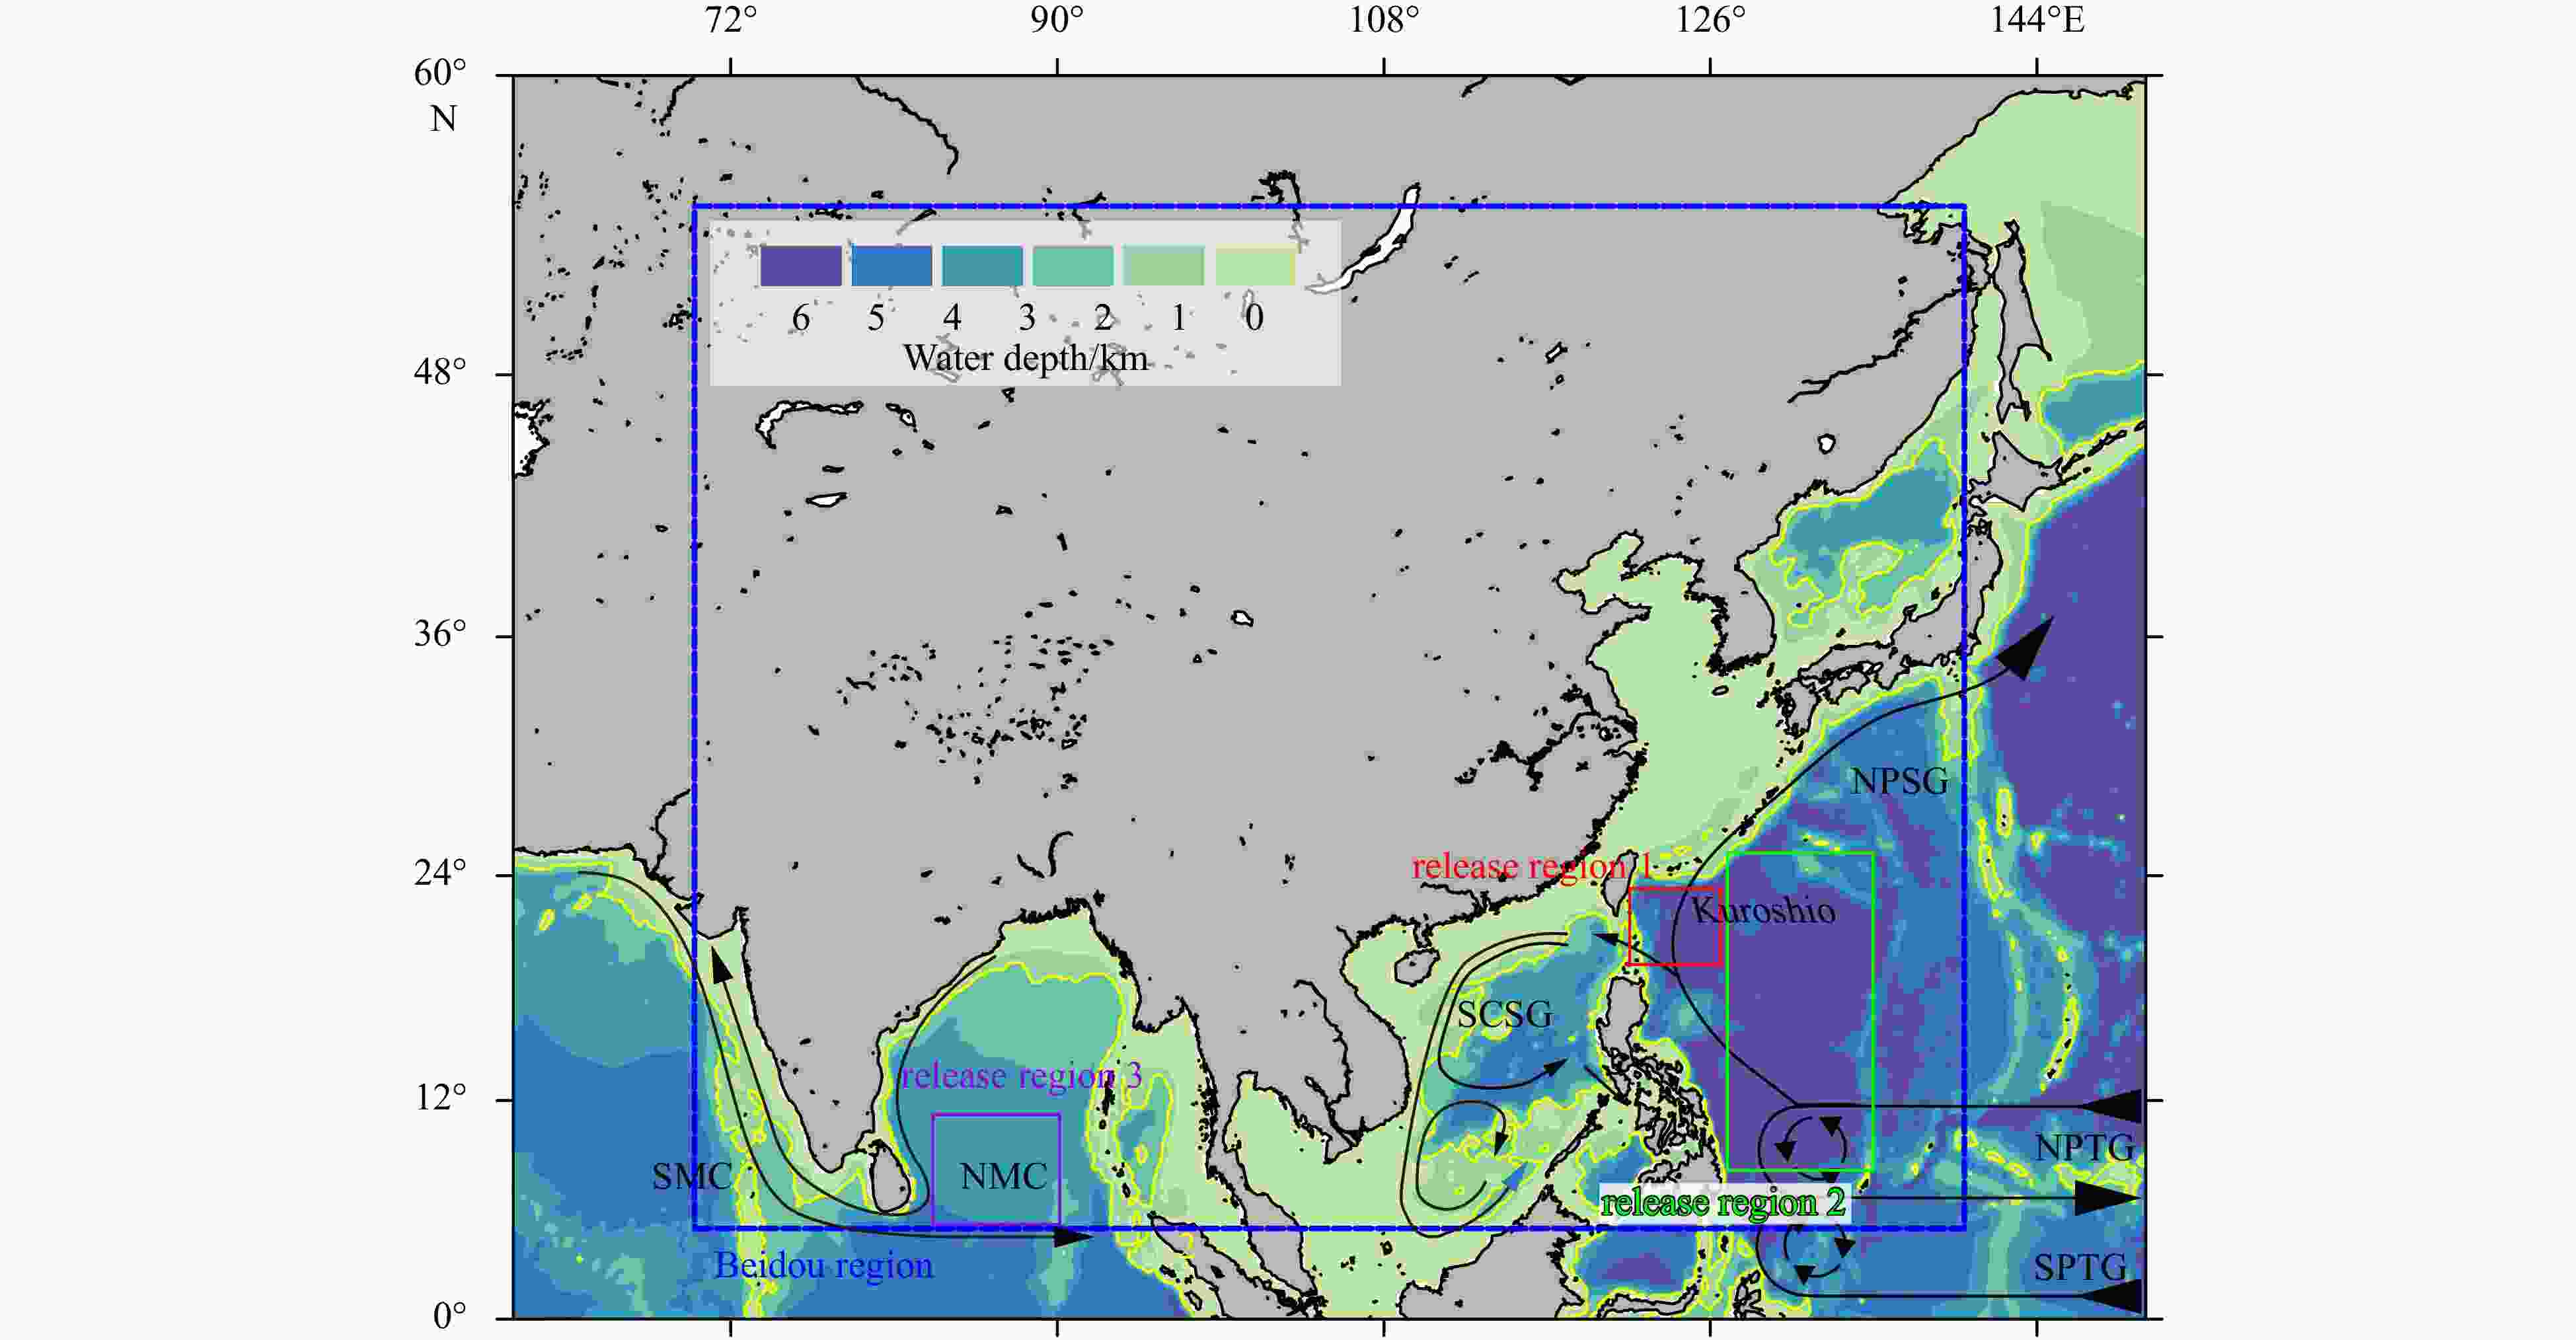
Figure 2. Bottom topography of East Indian-South China Sea-Northwest Pacific Ocean from the ECCO2 model. The
2000 -m isobaths are marked by yellow solid lines. Blue dashed line box represents nominal coverage of Beidou-2 satellite’s short message. Three subdomains are marked (colored solid lines) as the releasing regions of the simulated profiling floats in the following sections. Four main gyres of the Indo-Pacific low-latitude basin are marked by black lines with arrows. NPTG: North Pacific Tropical Gyre; NPSG: North Pacific Sea Gyre; SPTG: South Pacific Tropical Gyre; SCSG: South China Sea Gyre. SMC: Southeast Monsoon Current; NMC: Northeast Monsoon Current.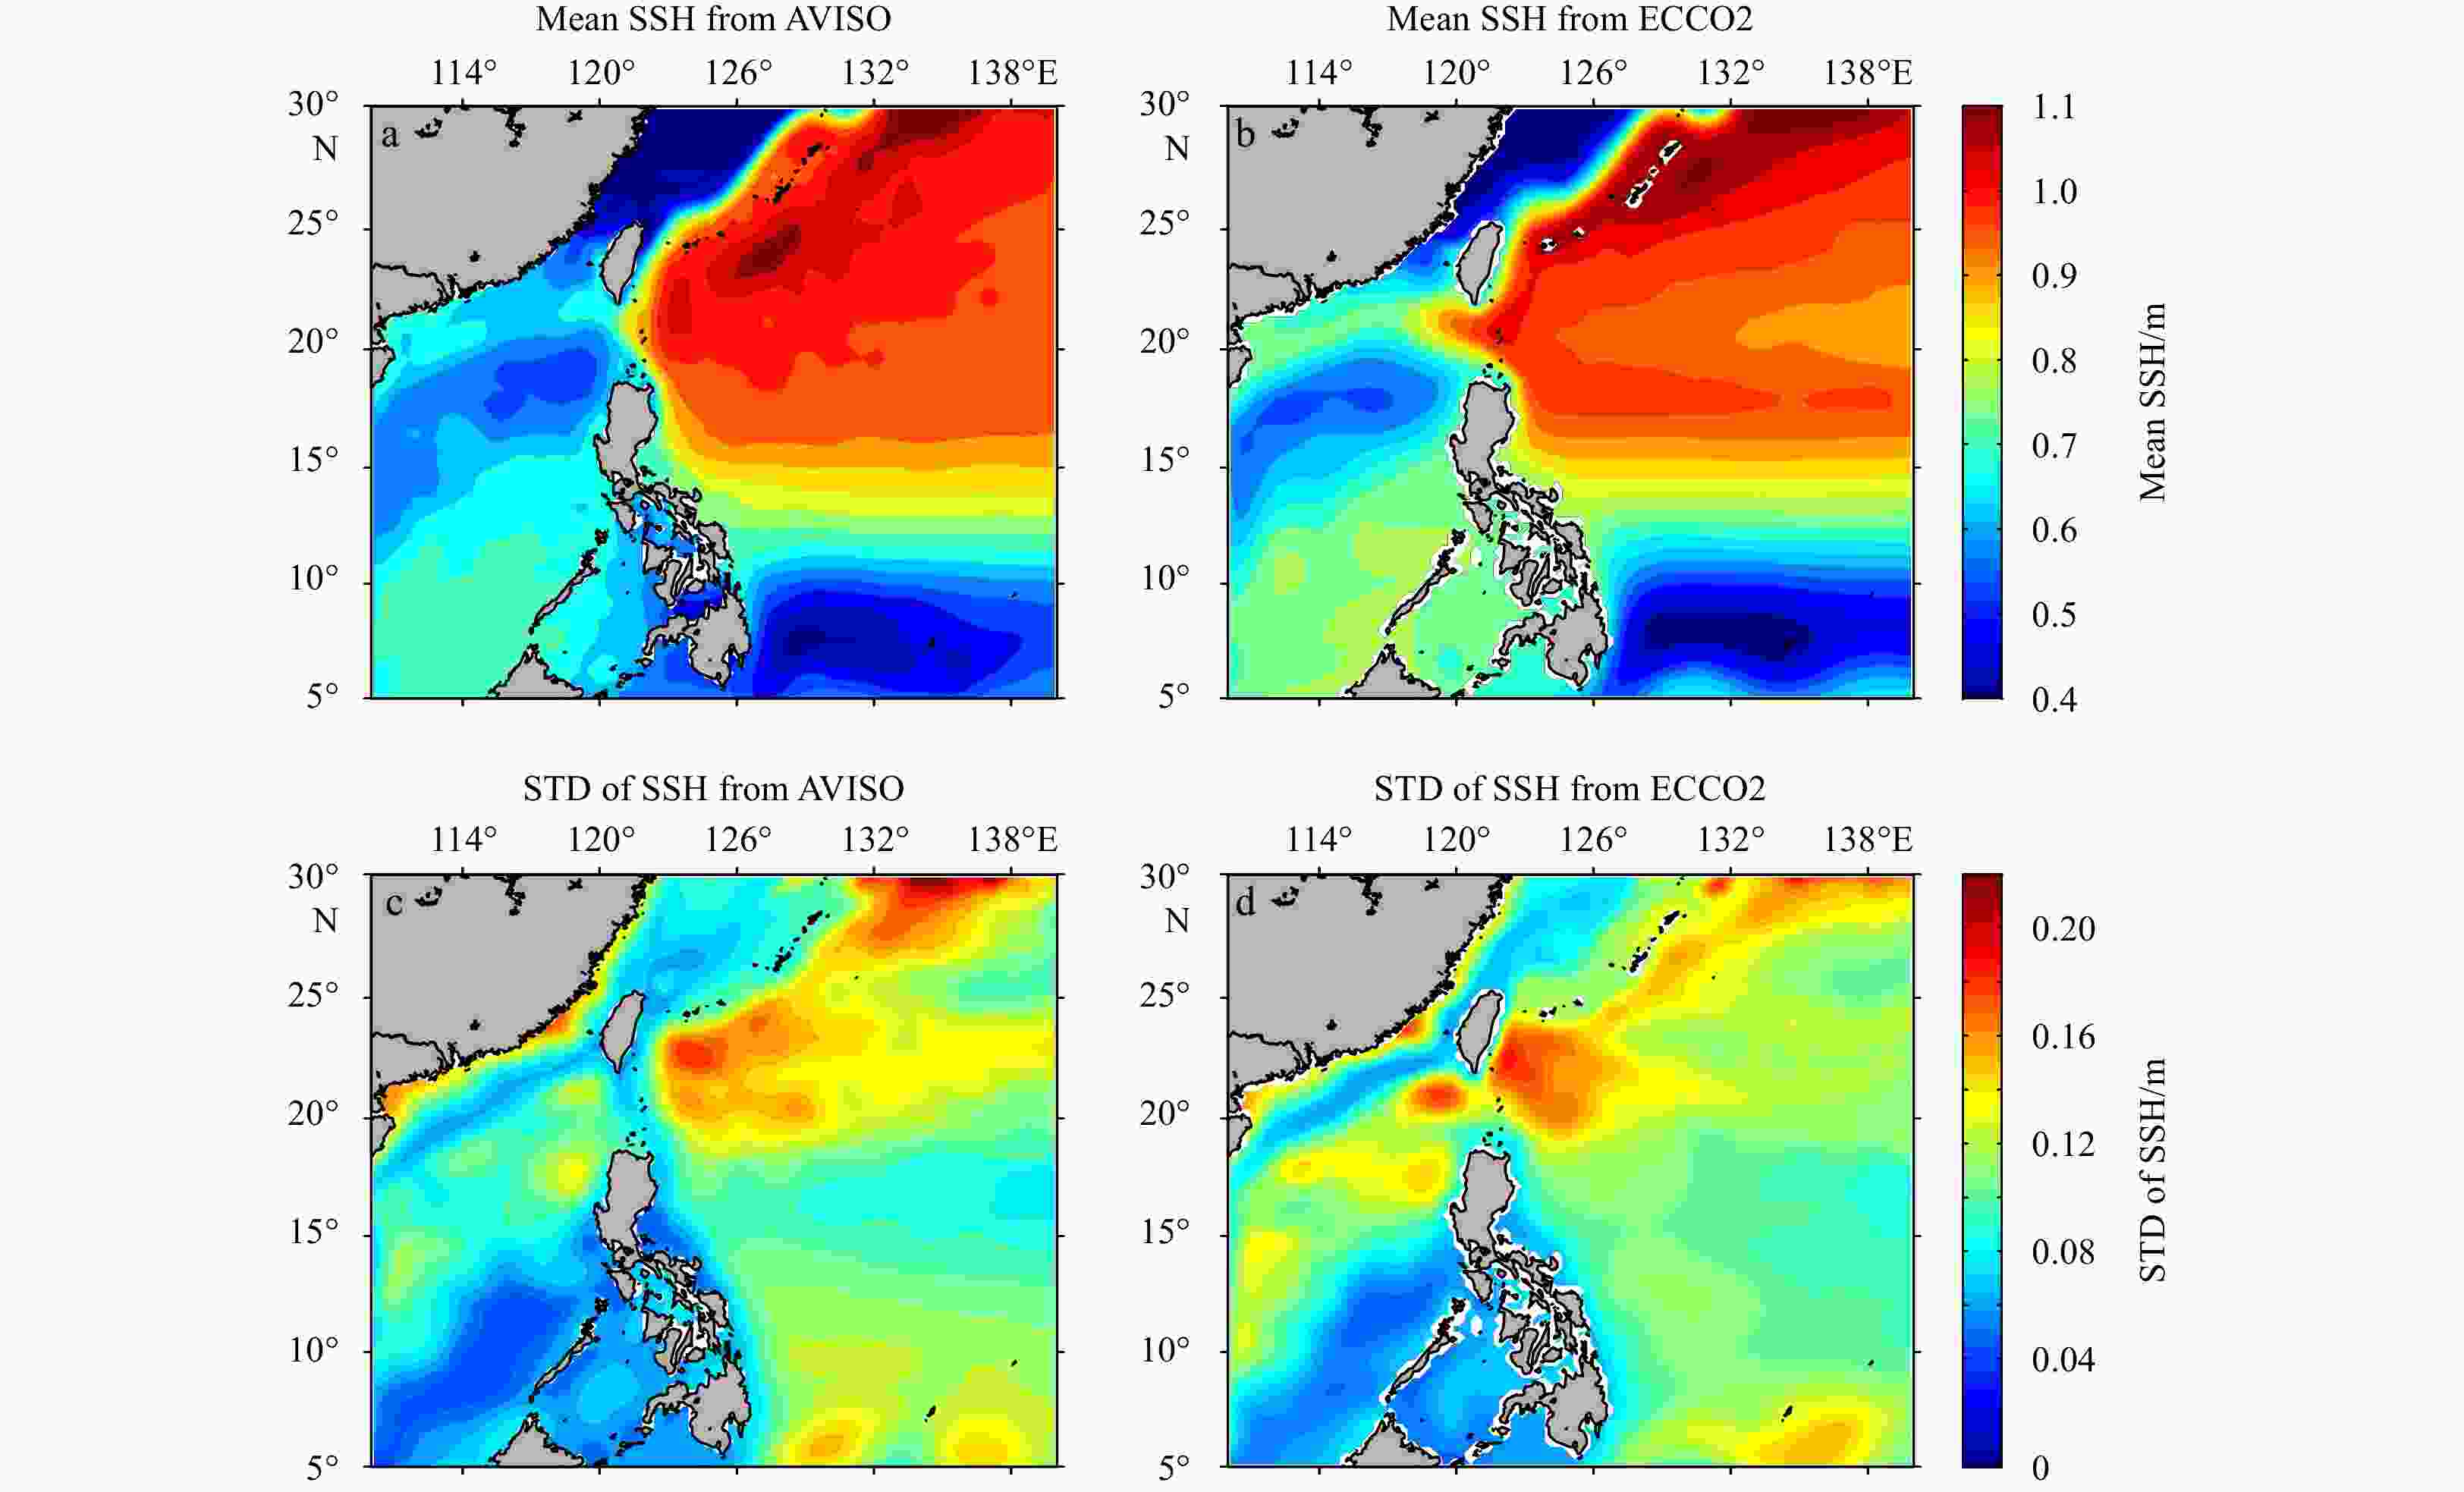
Figure 3. Mean SSH (m) during 2015−2022 from the AVISO-mapped product (a) and ECCO2 dataset (b), and the standard deviation (STD) of SSH from the AVISO-mapped product (c) and the ECCO2 model (d).
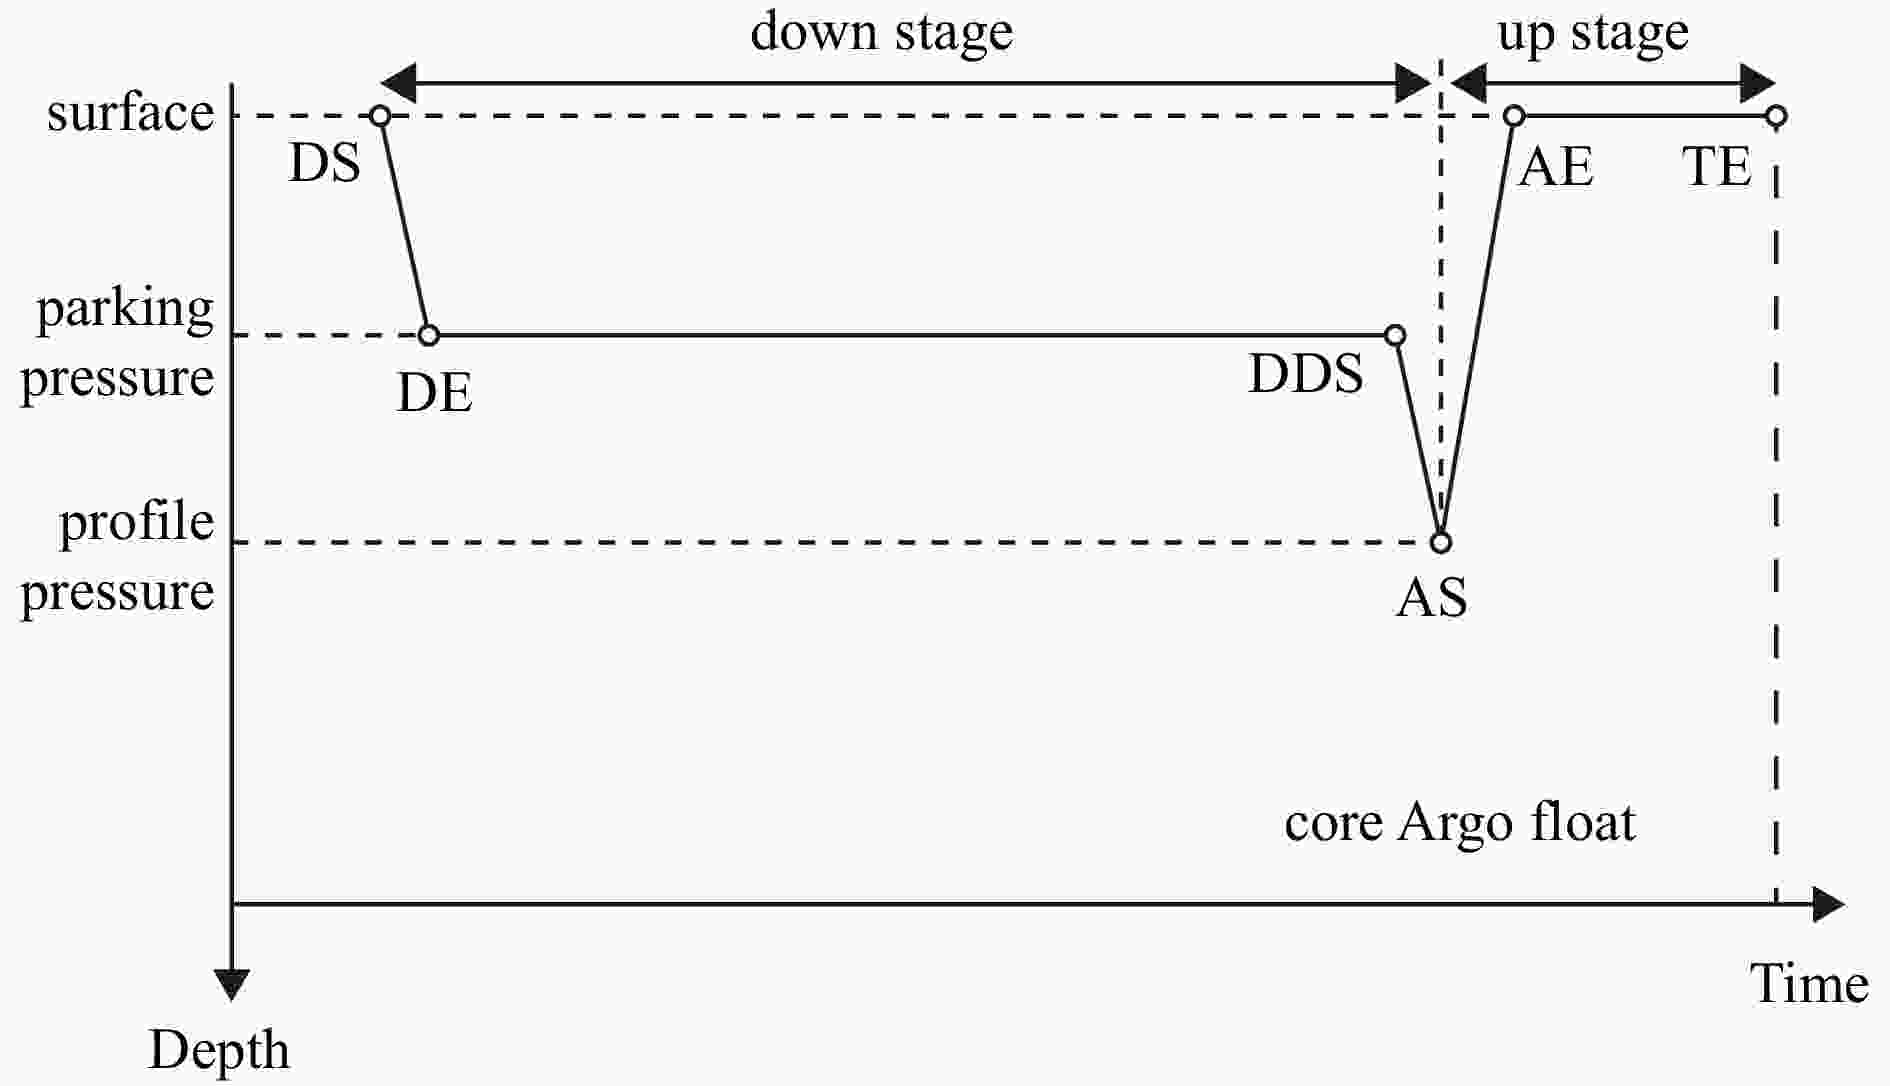
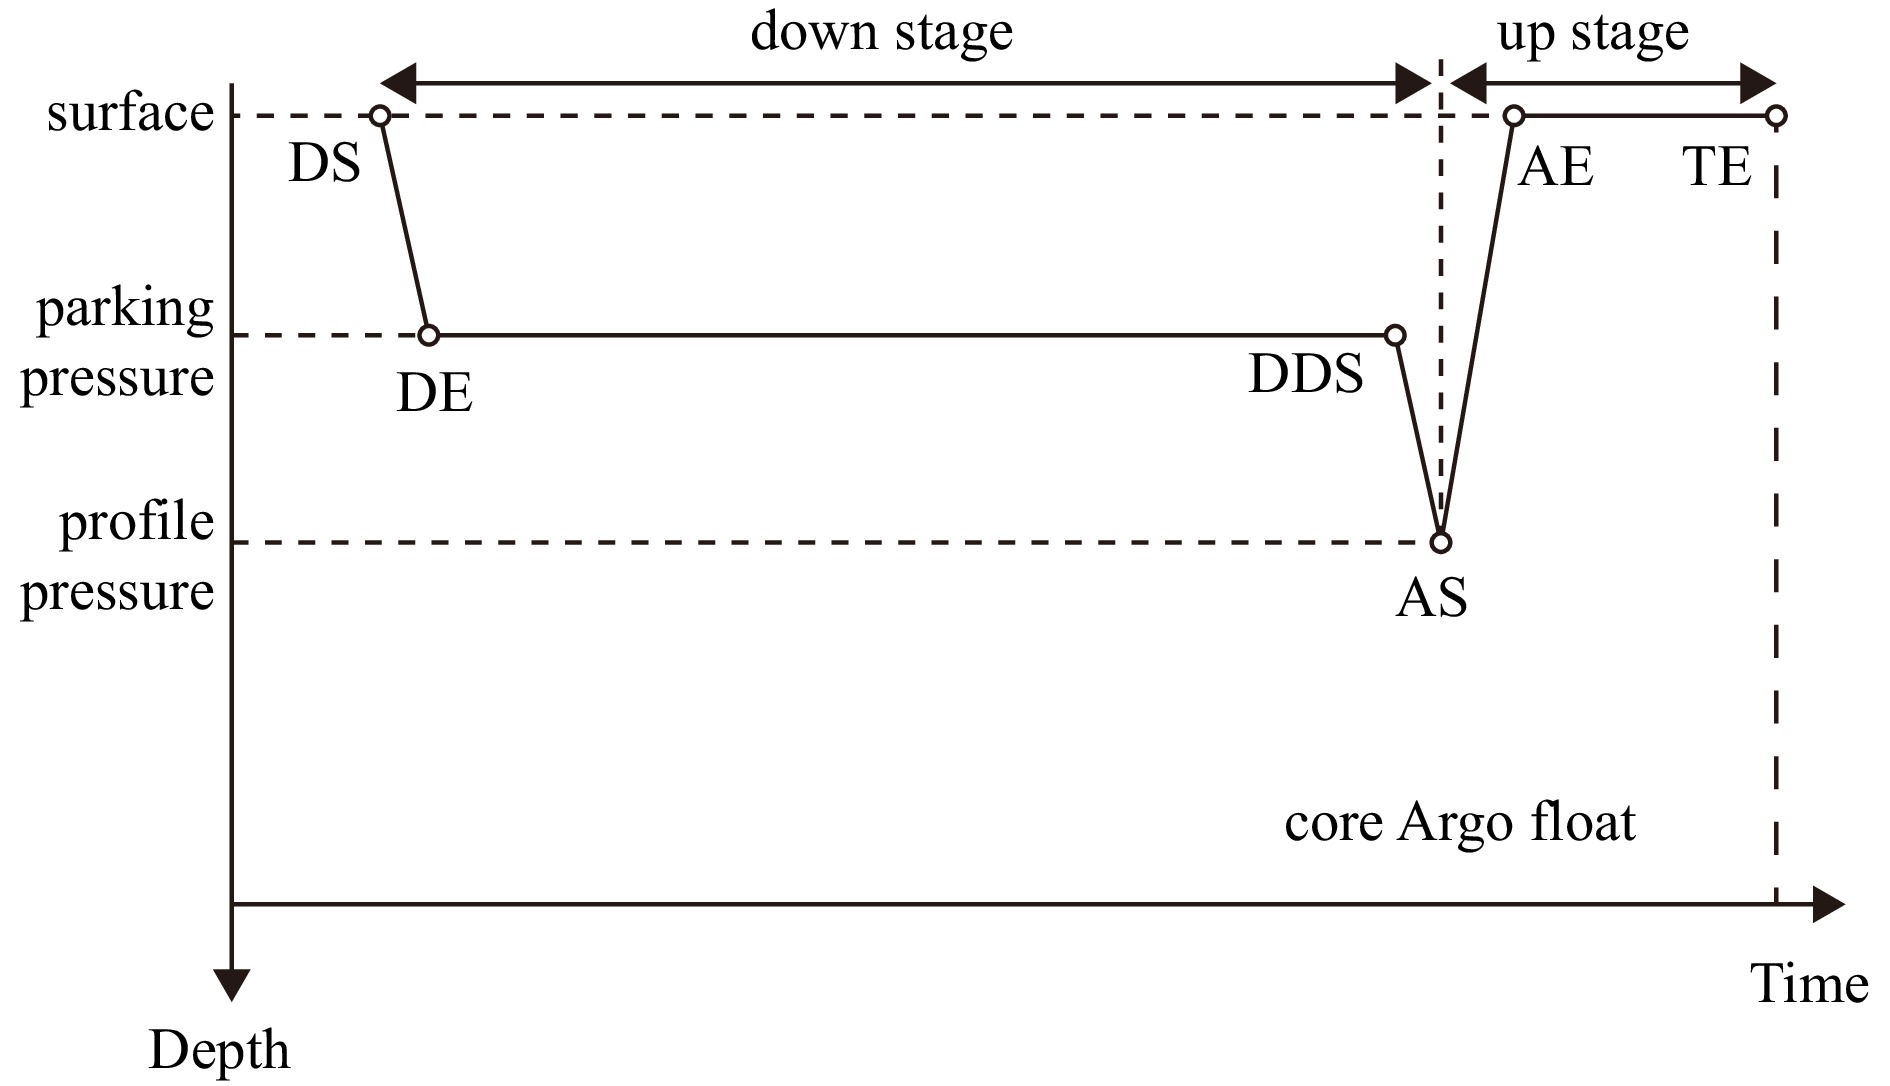
Figure 4. Schematic of one float cycle for a core Argo float, which includes descent, parking, deep profiling, and surface telemetry. The schematic map indicates the times when descent starts (DS), descent ends (DE), deep descent starts (DDS), ascent starts (AS), ascent ends (AE), and transmission ends (TE). The definitions are adopted from Ollitrault and Rannou (2013).
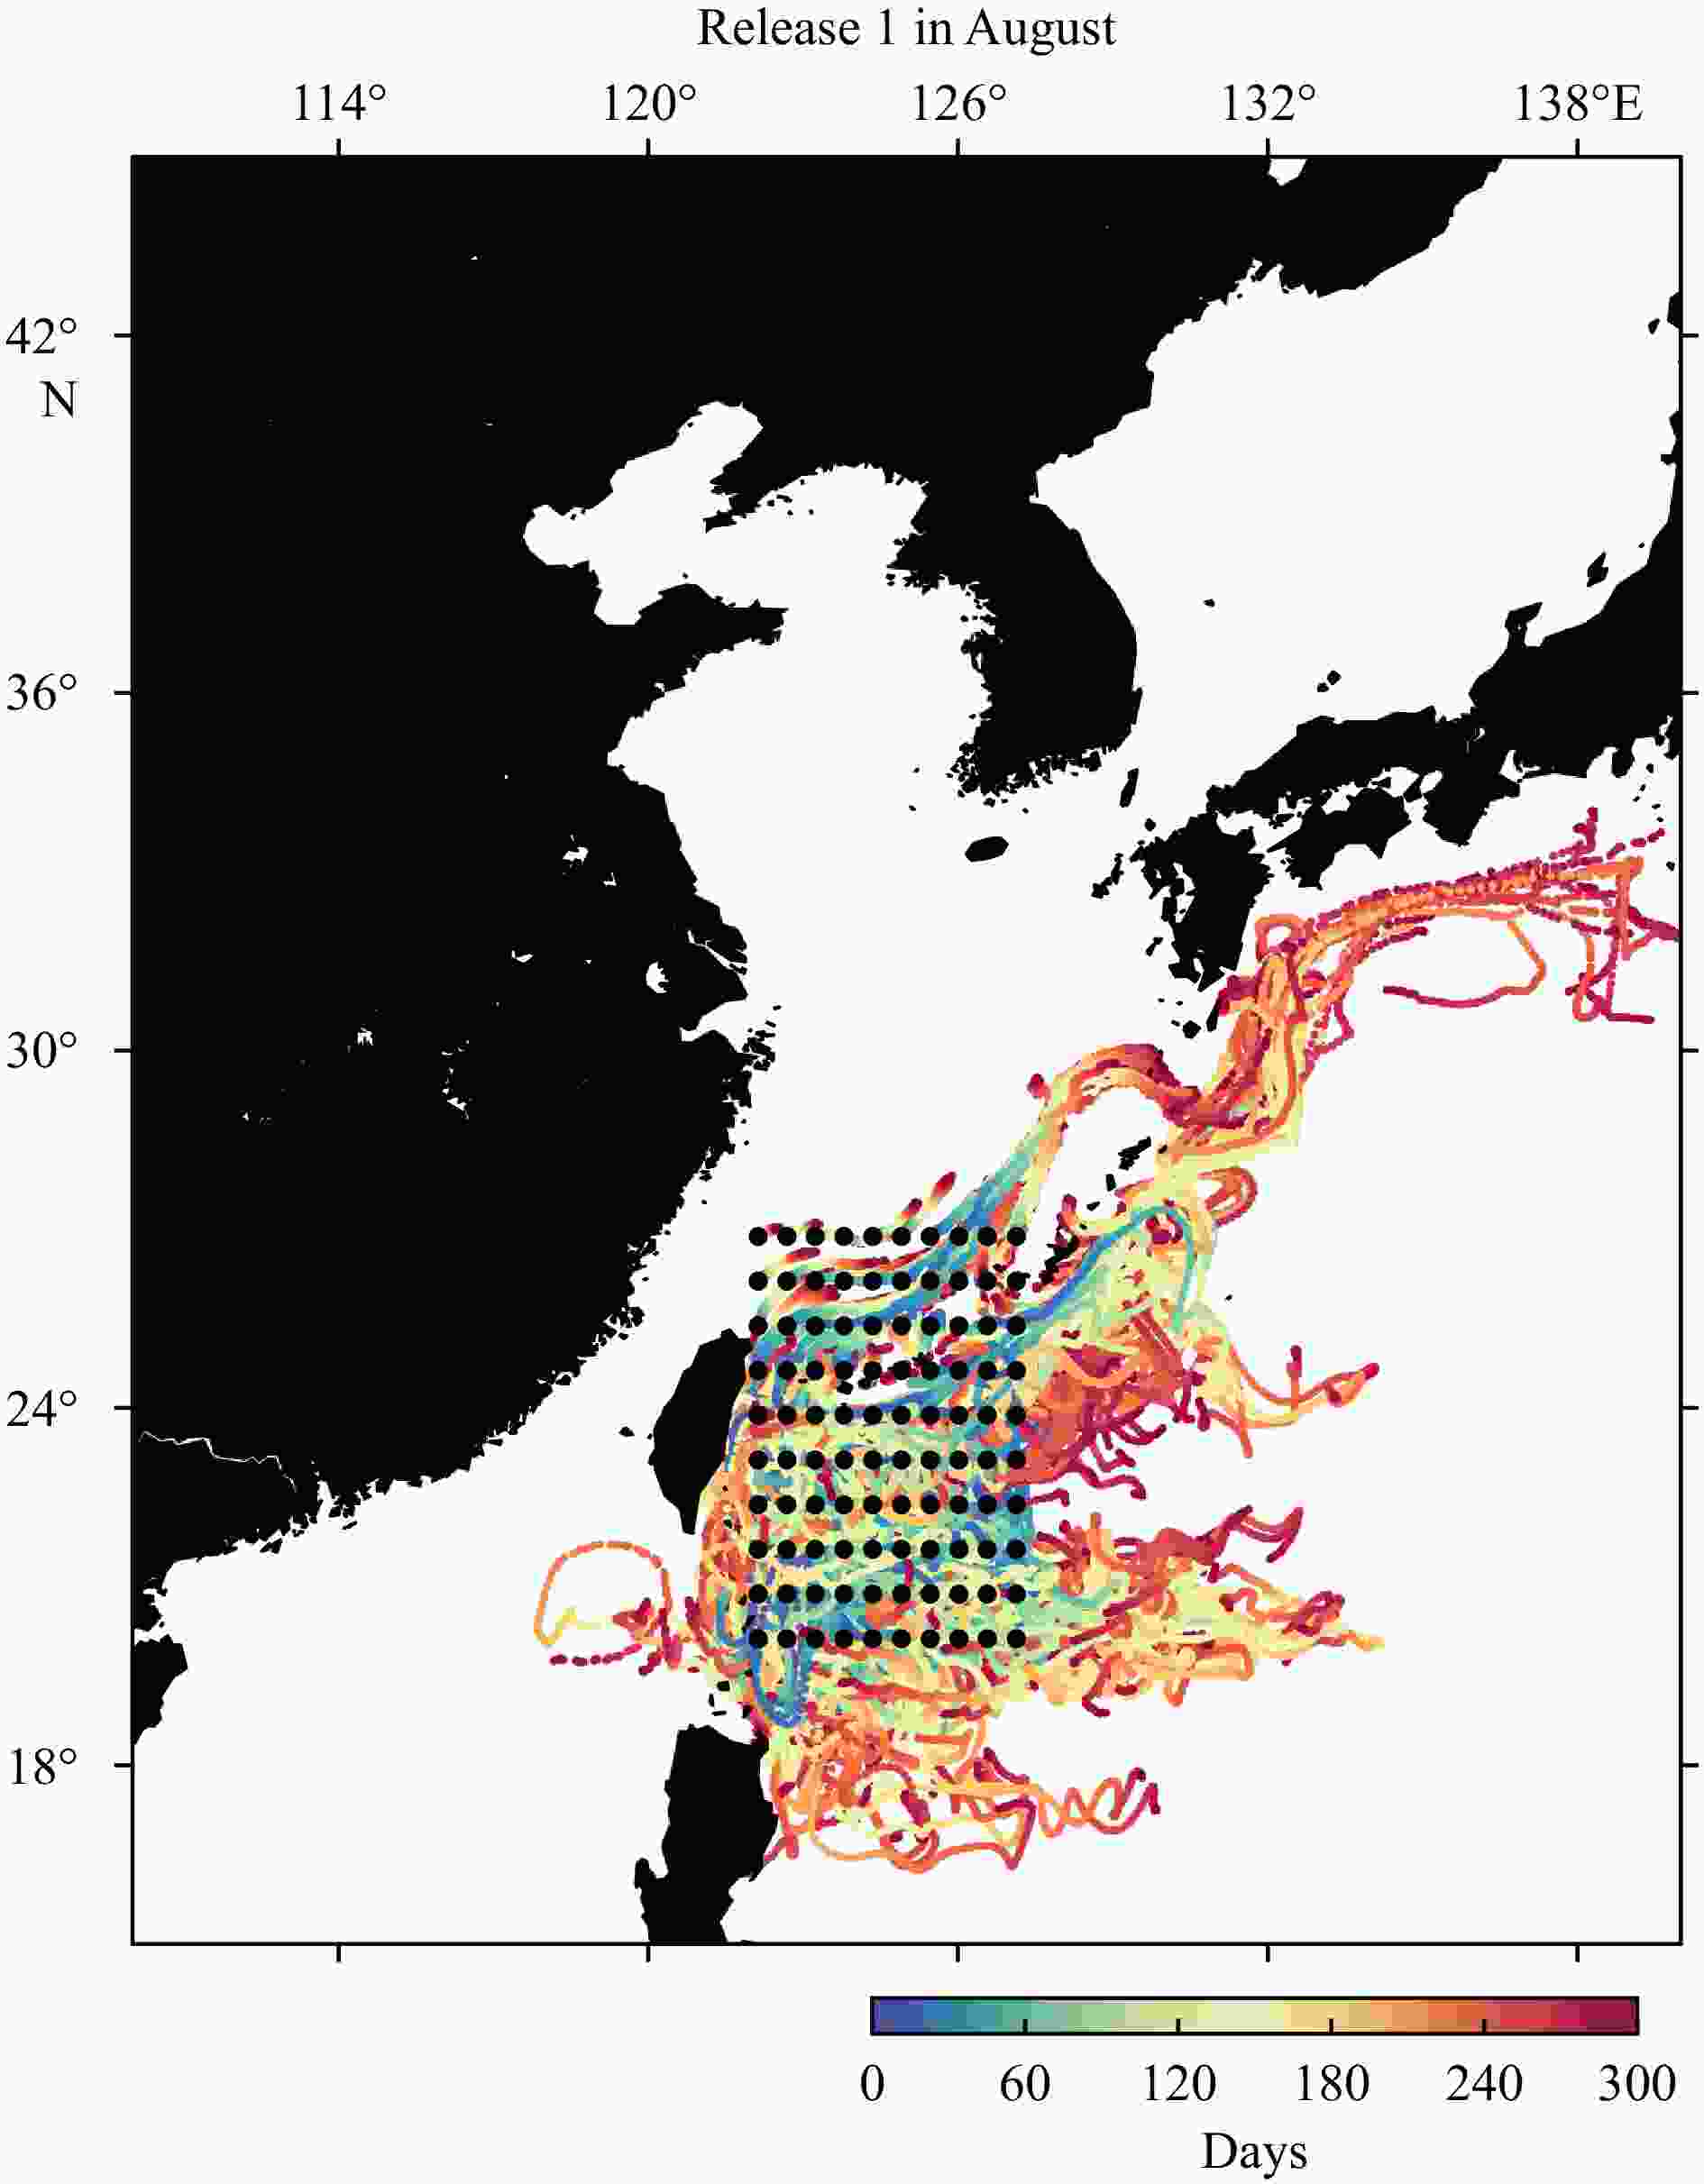
Figure 5. Lagrangian trajectories for simulated floats during 300-d model runs. All the floats were initially released in the east of the Luzon Strait (20°–28°N, 122°–127°E). The black dots denote the releasing positions. The details of the simulation can be referenced in the description of Exp_1 in Table 2.
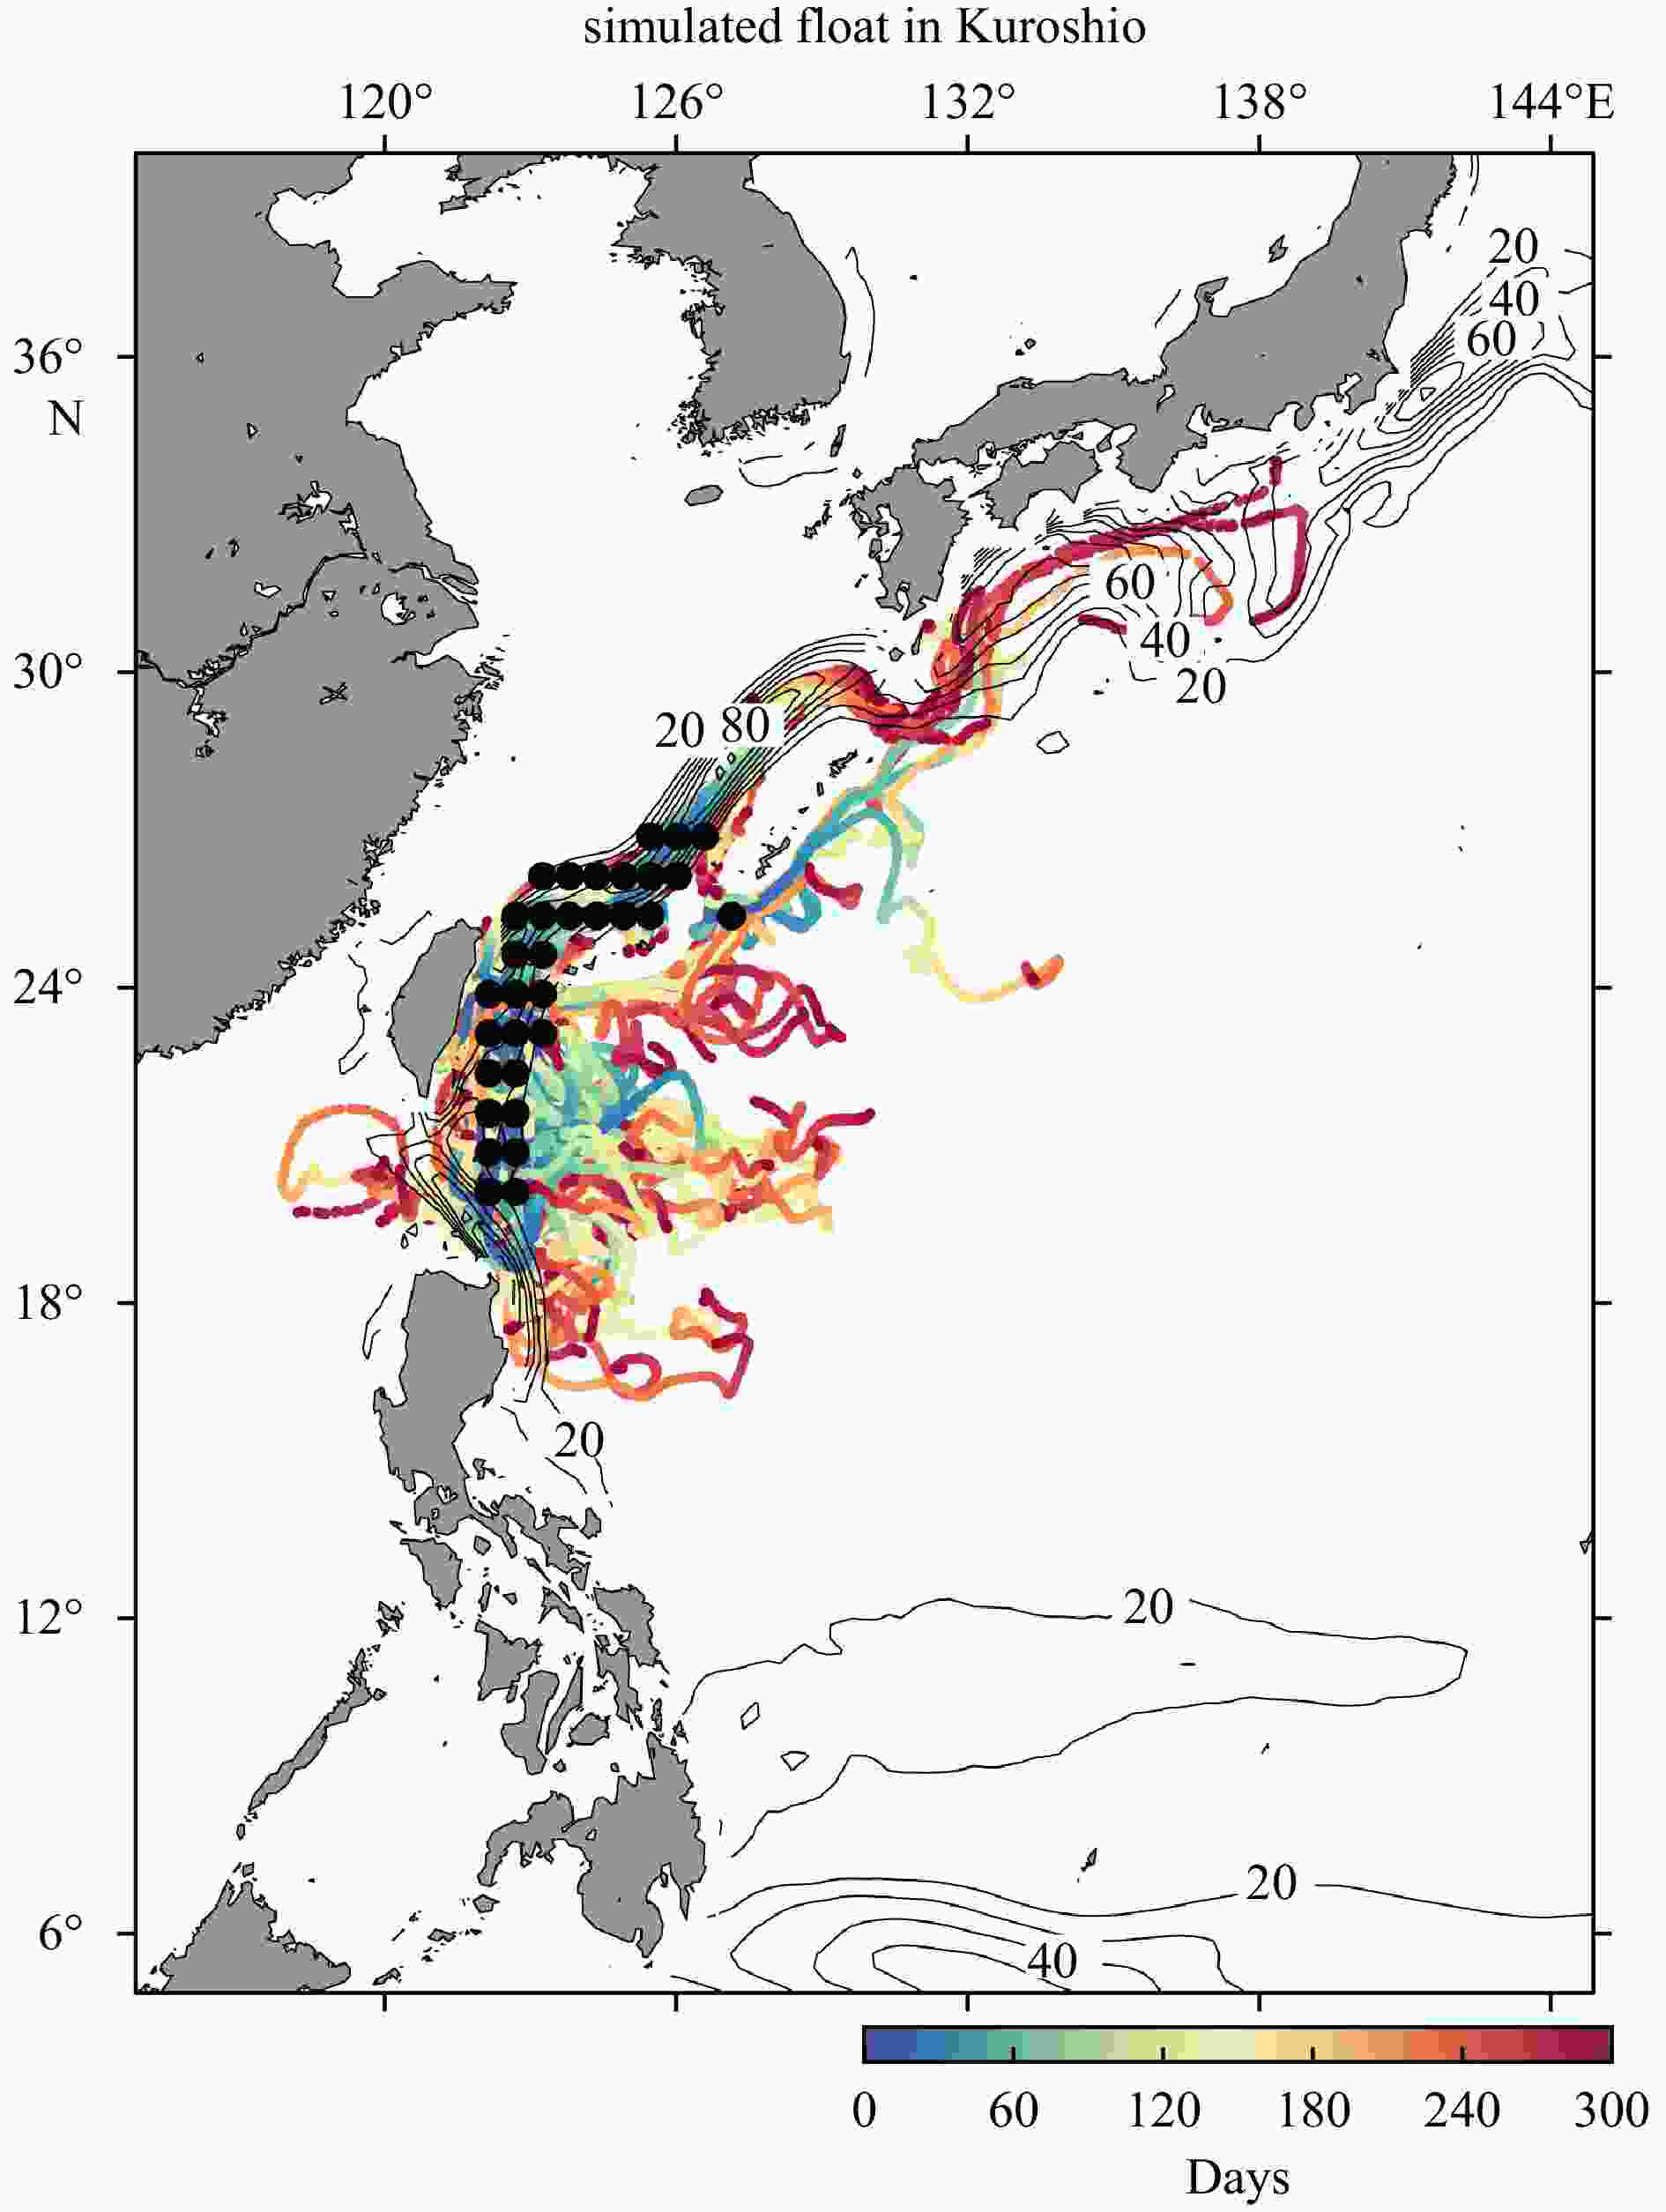
Figure 6. Lagrangian trajectories for simulated floats during 300-d model runs. All the floats were initially released in Kuroshio axis (with the velocity beyond 20 cm/s). The black dots denote the releasing positions. The overlaid contour lines represent the geostrophic current velocity beyond 20 cm/s from the AVISO-mapped product with 20 cm/s interval.
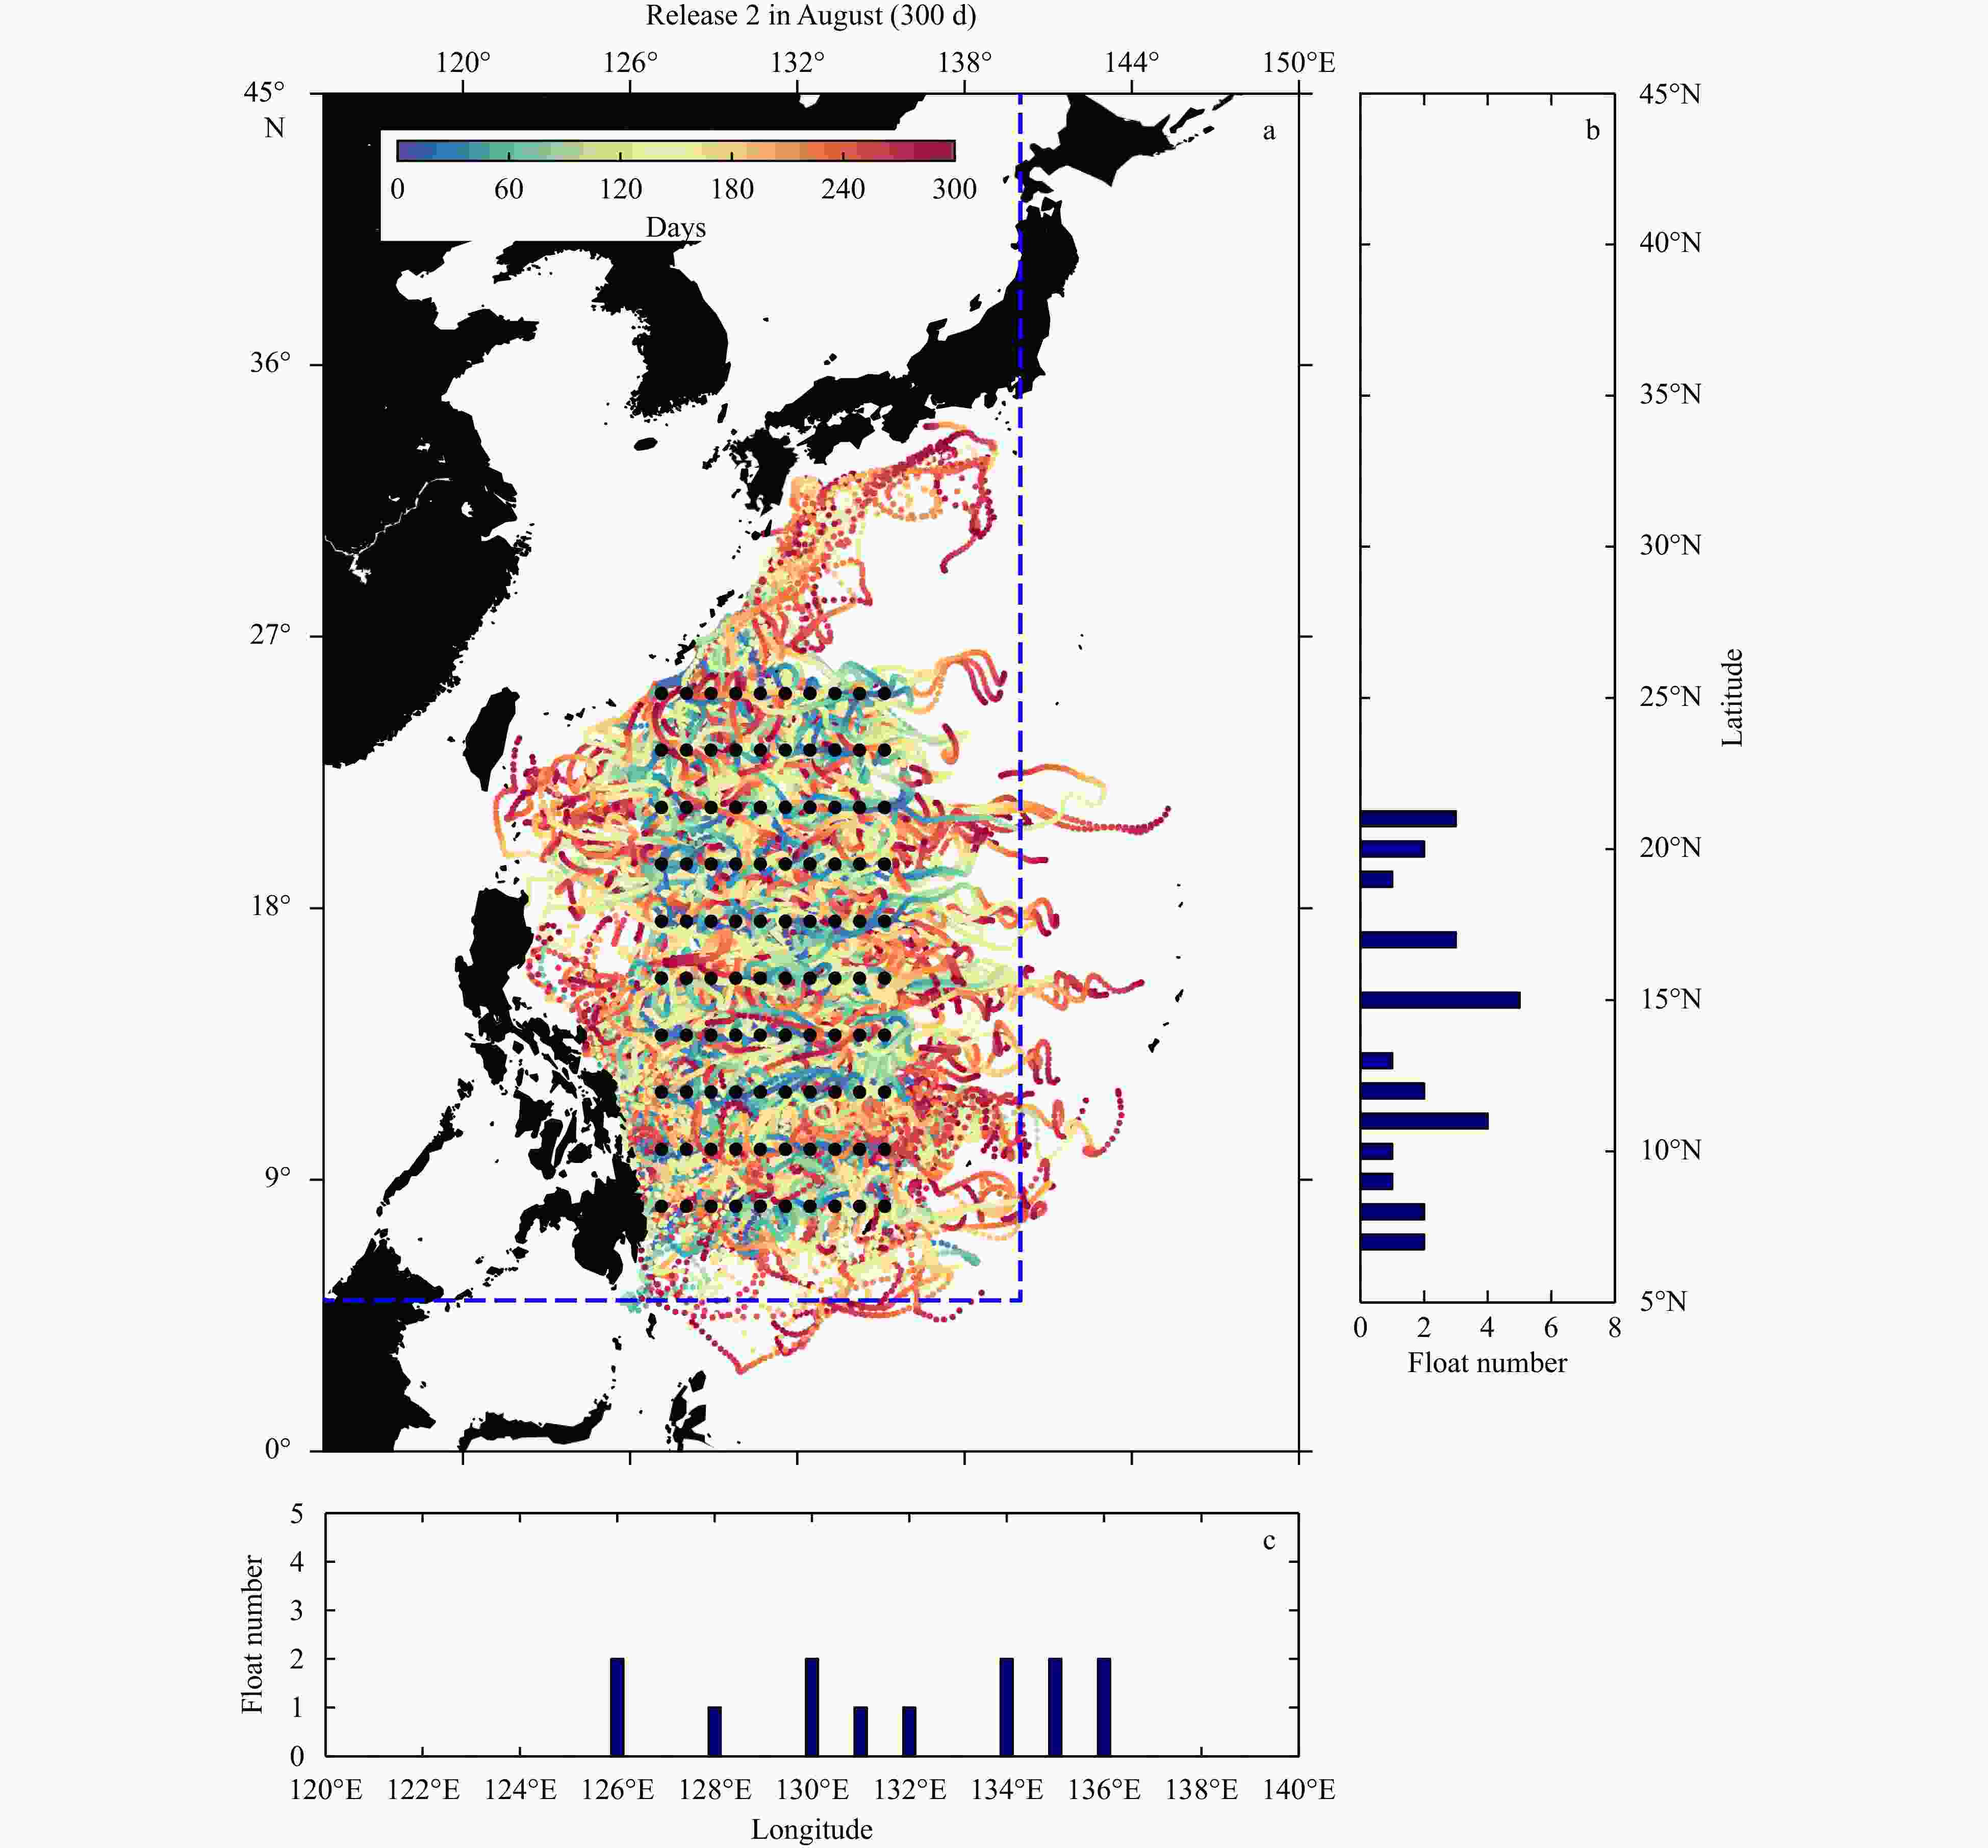
Figure 7. Lagrangian trajectories for simulated floats during 300-d model runs (a), the statistics (as a function of latitude) for the floats exiting the Beidou coverage through the eastern boundary (b) and the statistics (as a function of longitude) for the floats exiting the Beidou coverage through the southern boundary (c). All the floats were initially released in Philippine Sea (8°–25°N, 127°–135°E). The black dots in a denote the releasing positions. Details can be referenced in the Exp_2 of Table 2. The number of floats drifting out of the Beidou Ⅱ short message coverage is calculated based on their final locations. Blue dashed line box in a represents theoretical coverage of Beidou Ⅱ short message.
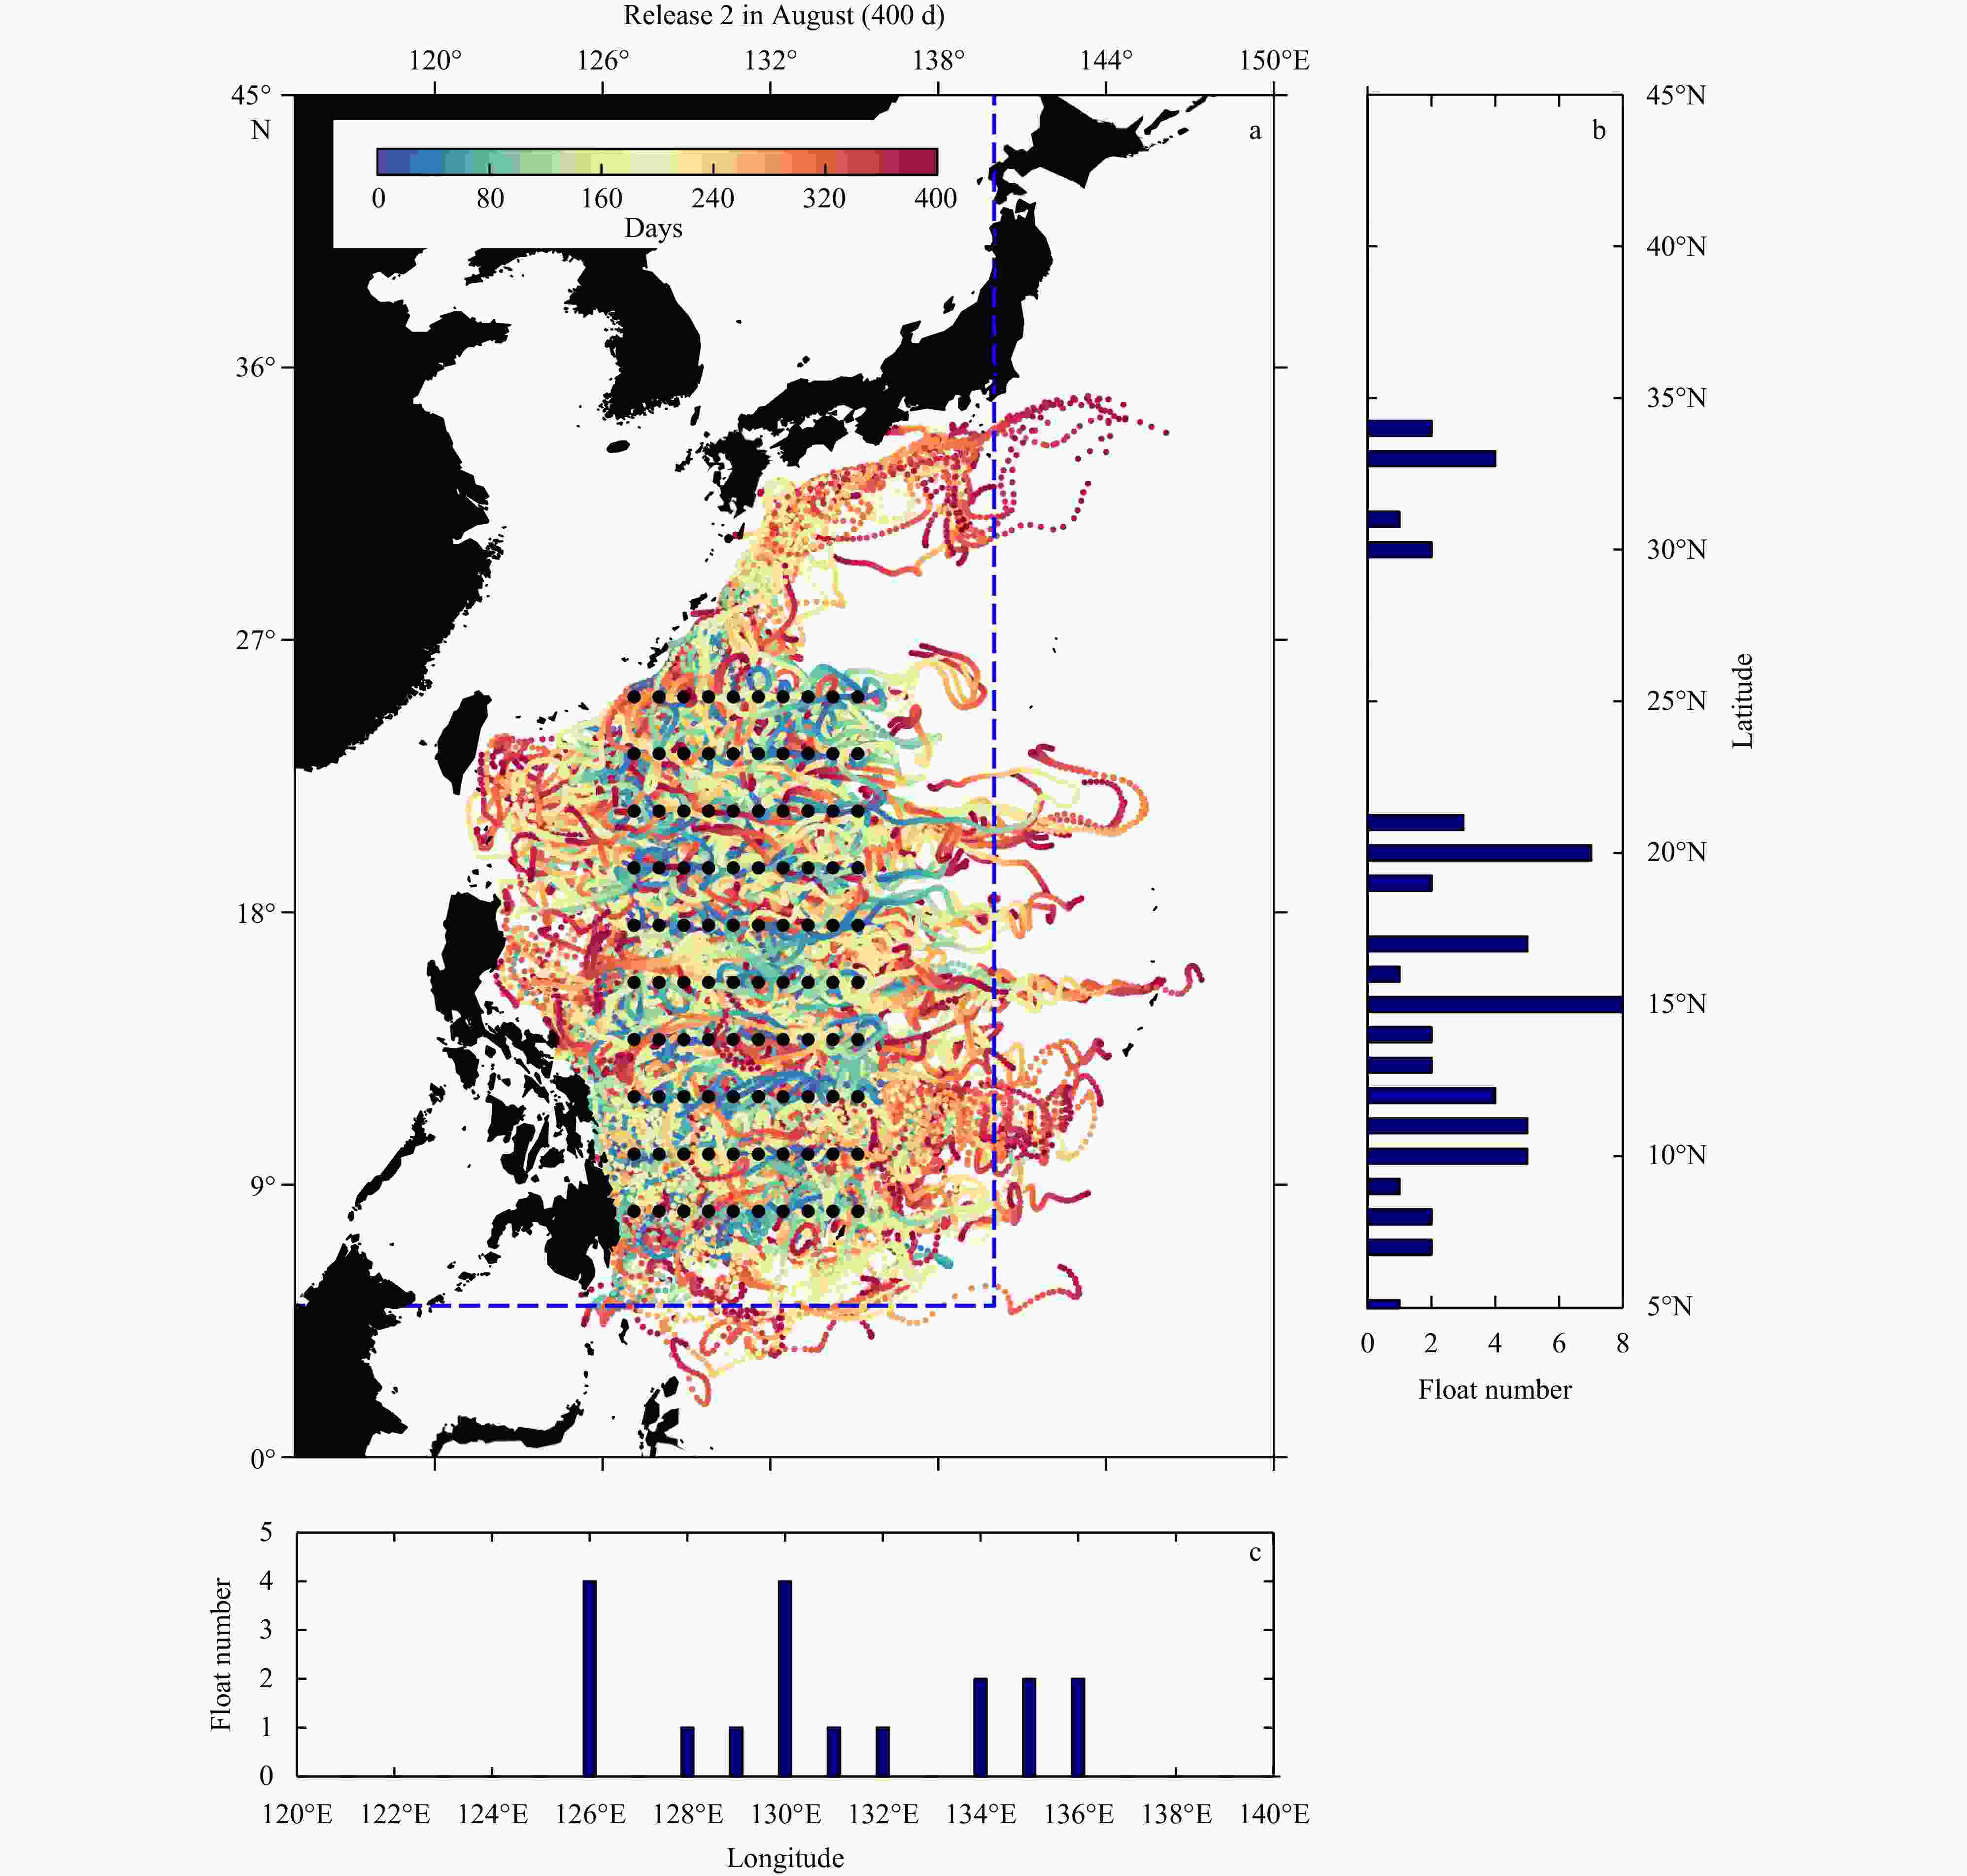
Figure 8. Lagrangian trajectories for simulated floats during 400-d model runs (a), the statistics (as a function of latitude) for the floats exiting the Beidou coverage through the eastern boundary (b) and the statistics (as a function of longitude) for the floats exiting the Beidou coverage through the southern boundary (c). All the floats were initially released in Philippine Sea (8°–25°N, 127°–135°E). The black dots in a denote the releasing positions. Details can be referenced in the Exp_2 of Table 2. The number of floats drifting out of the Beidou Ⅱ short message coverage is calculated based on their final locations. Blue dashed line box in a represents theoretical coverage of Beidou Ⅱ short message.
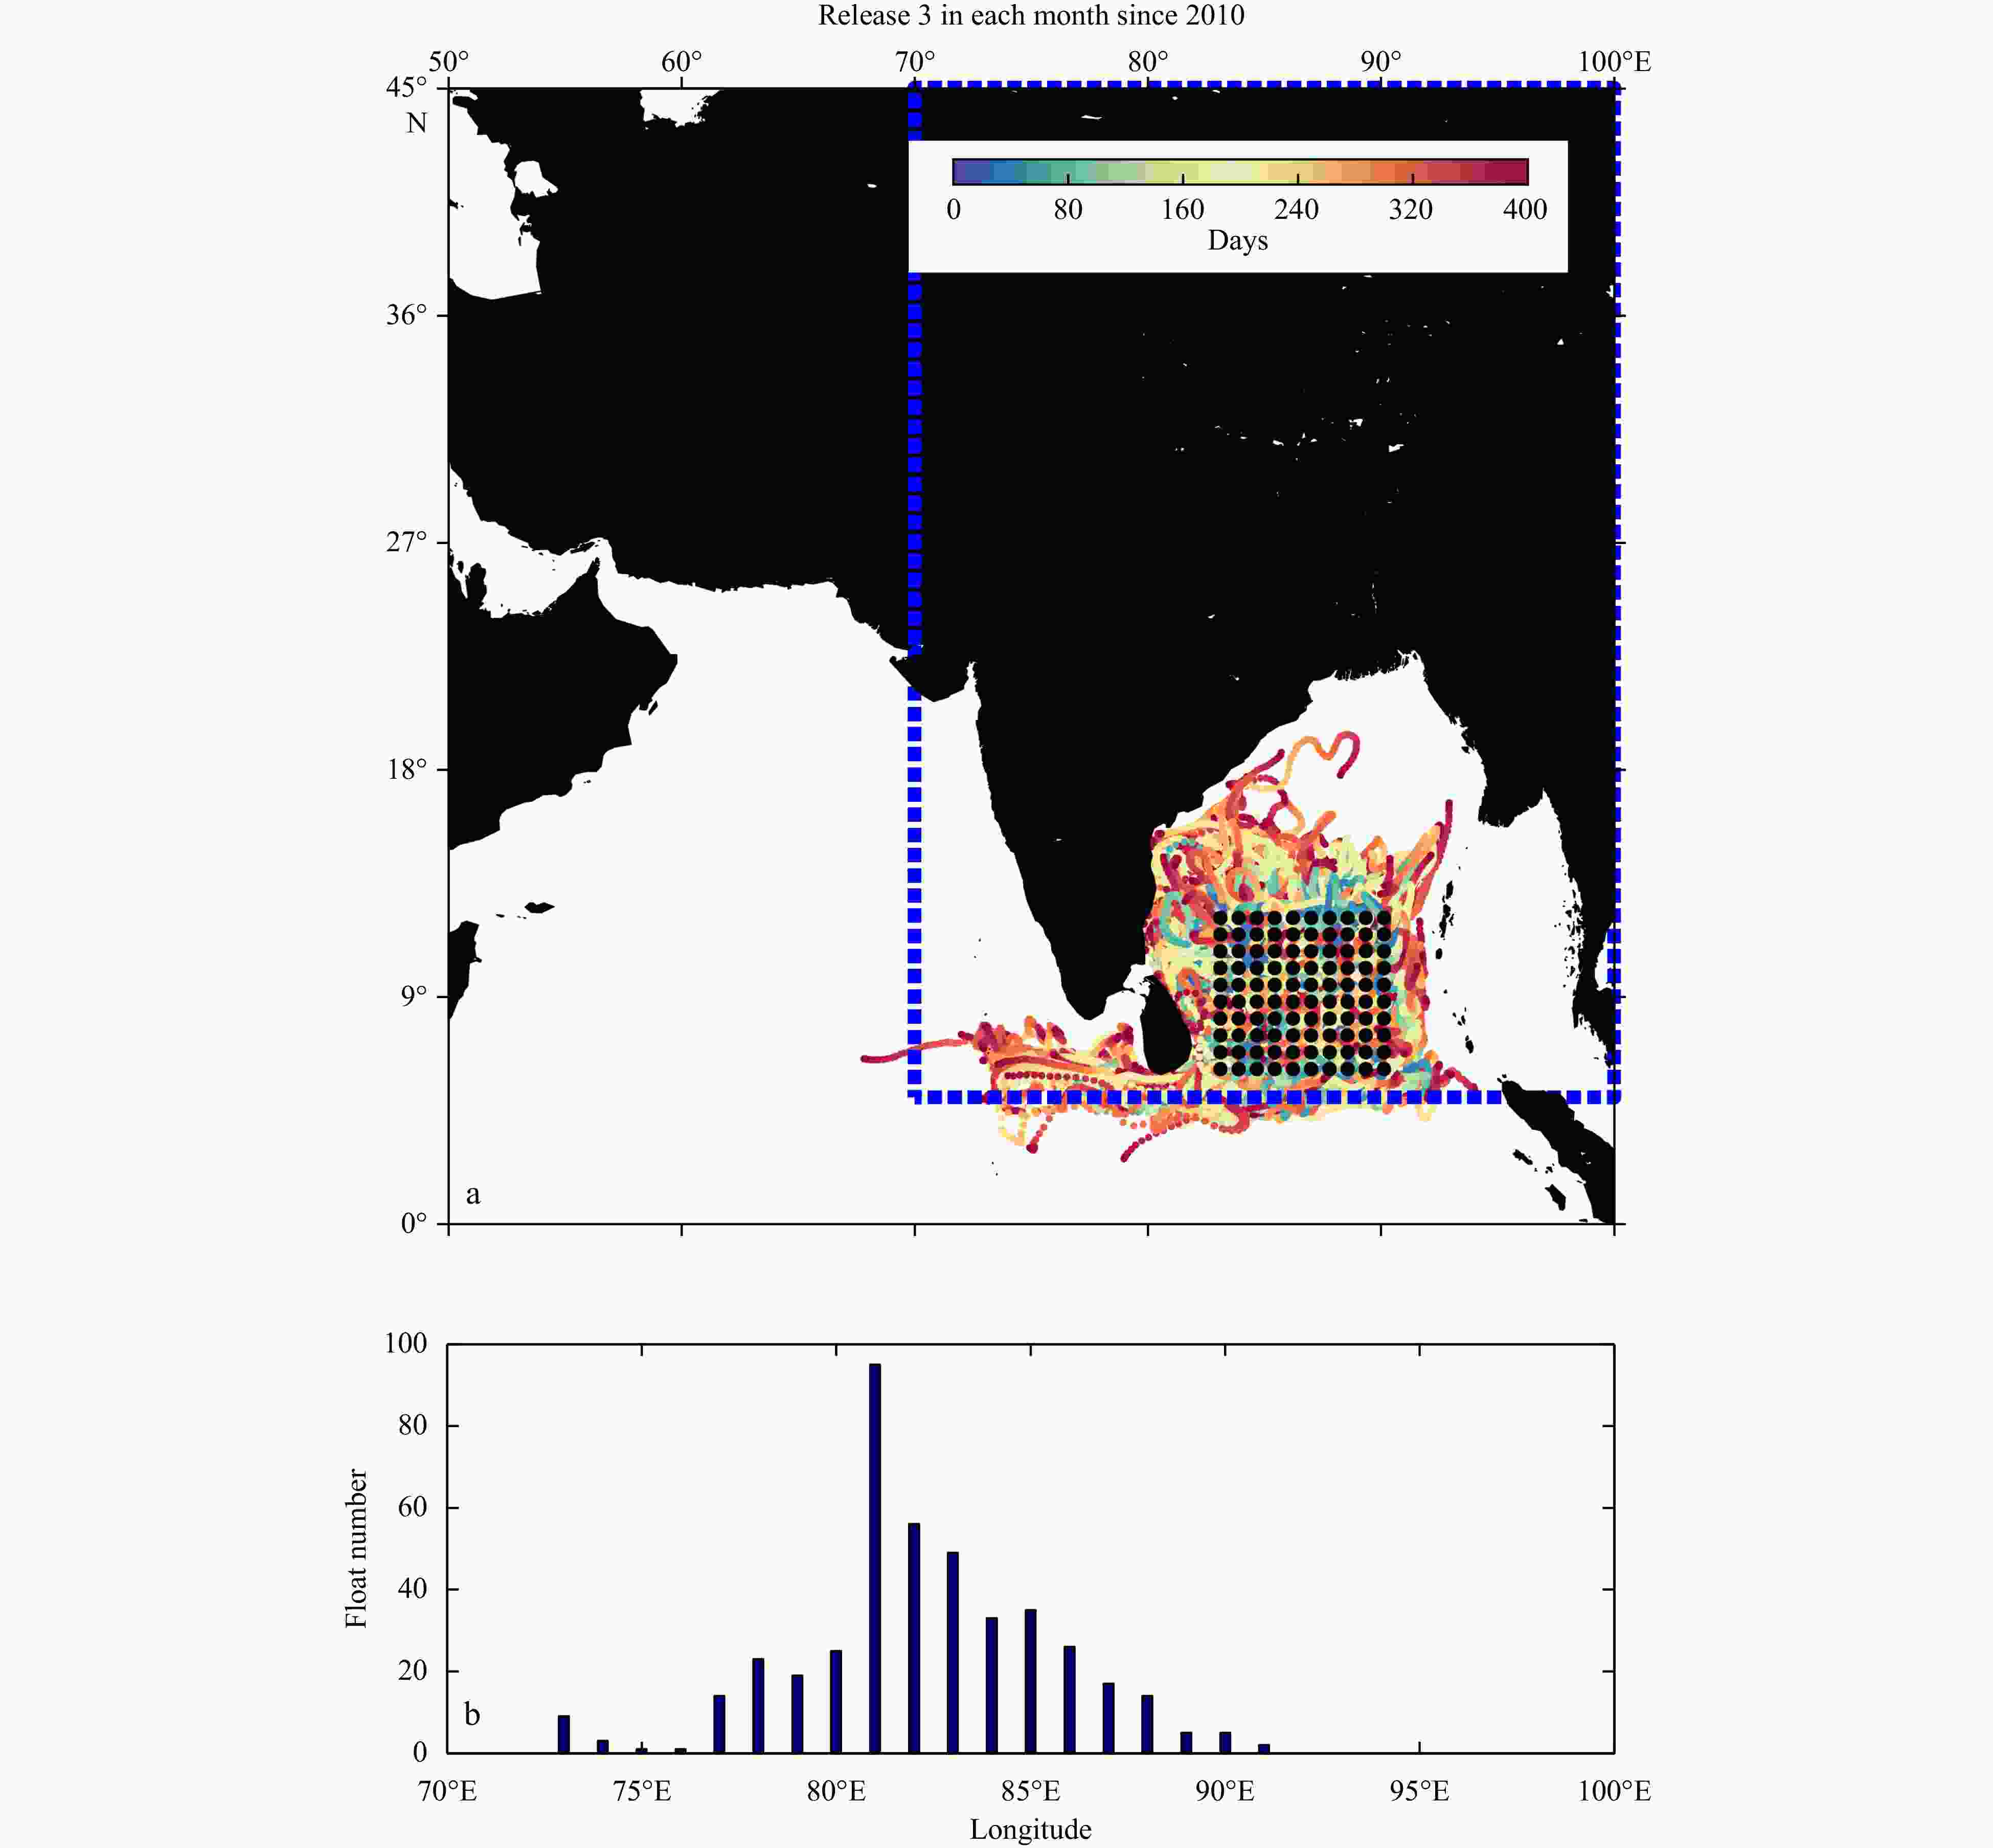
Figure 9. Lagrangian trajectories for simulated floats during 300-d model runs (a) and the statistics (as a function of longitude) for the floats exiting the Beidou coverage through the southern boundary (b). All the floats were initially released in Bay of Bengal. The black dots in a denote the releasing positions. Details can be referenced in the Exp_3 of Table 2. Blue dashed line box in a represents theoretical coverage of Beidou Ⅱ short message.
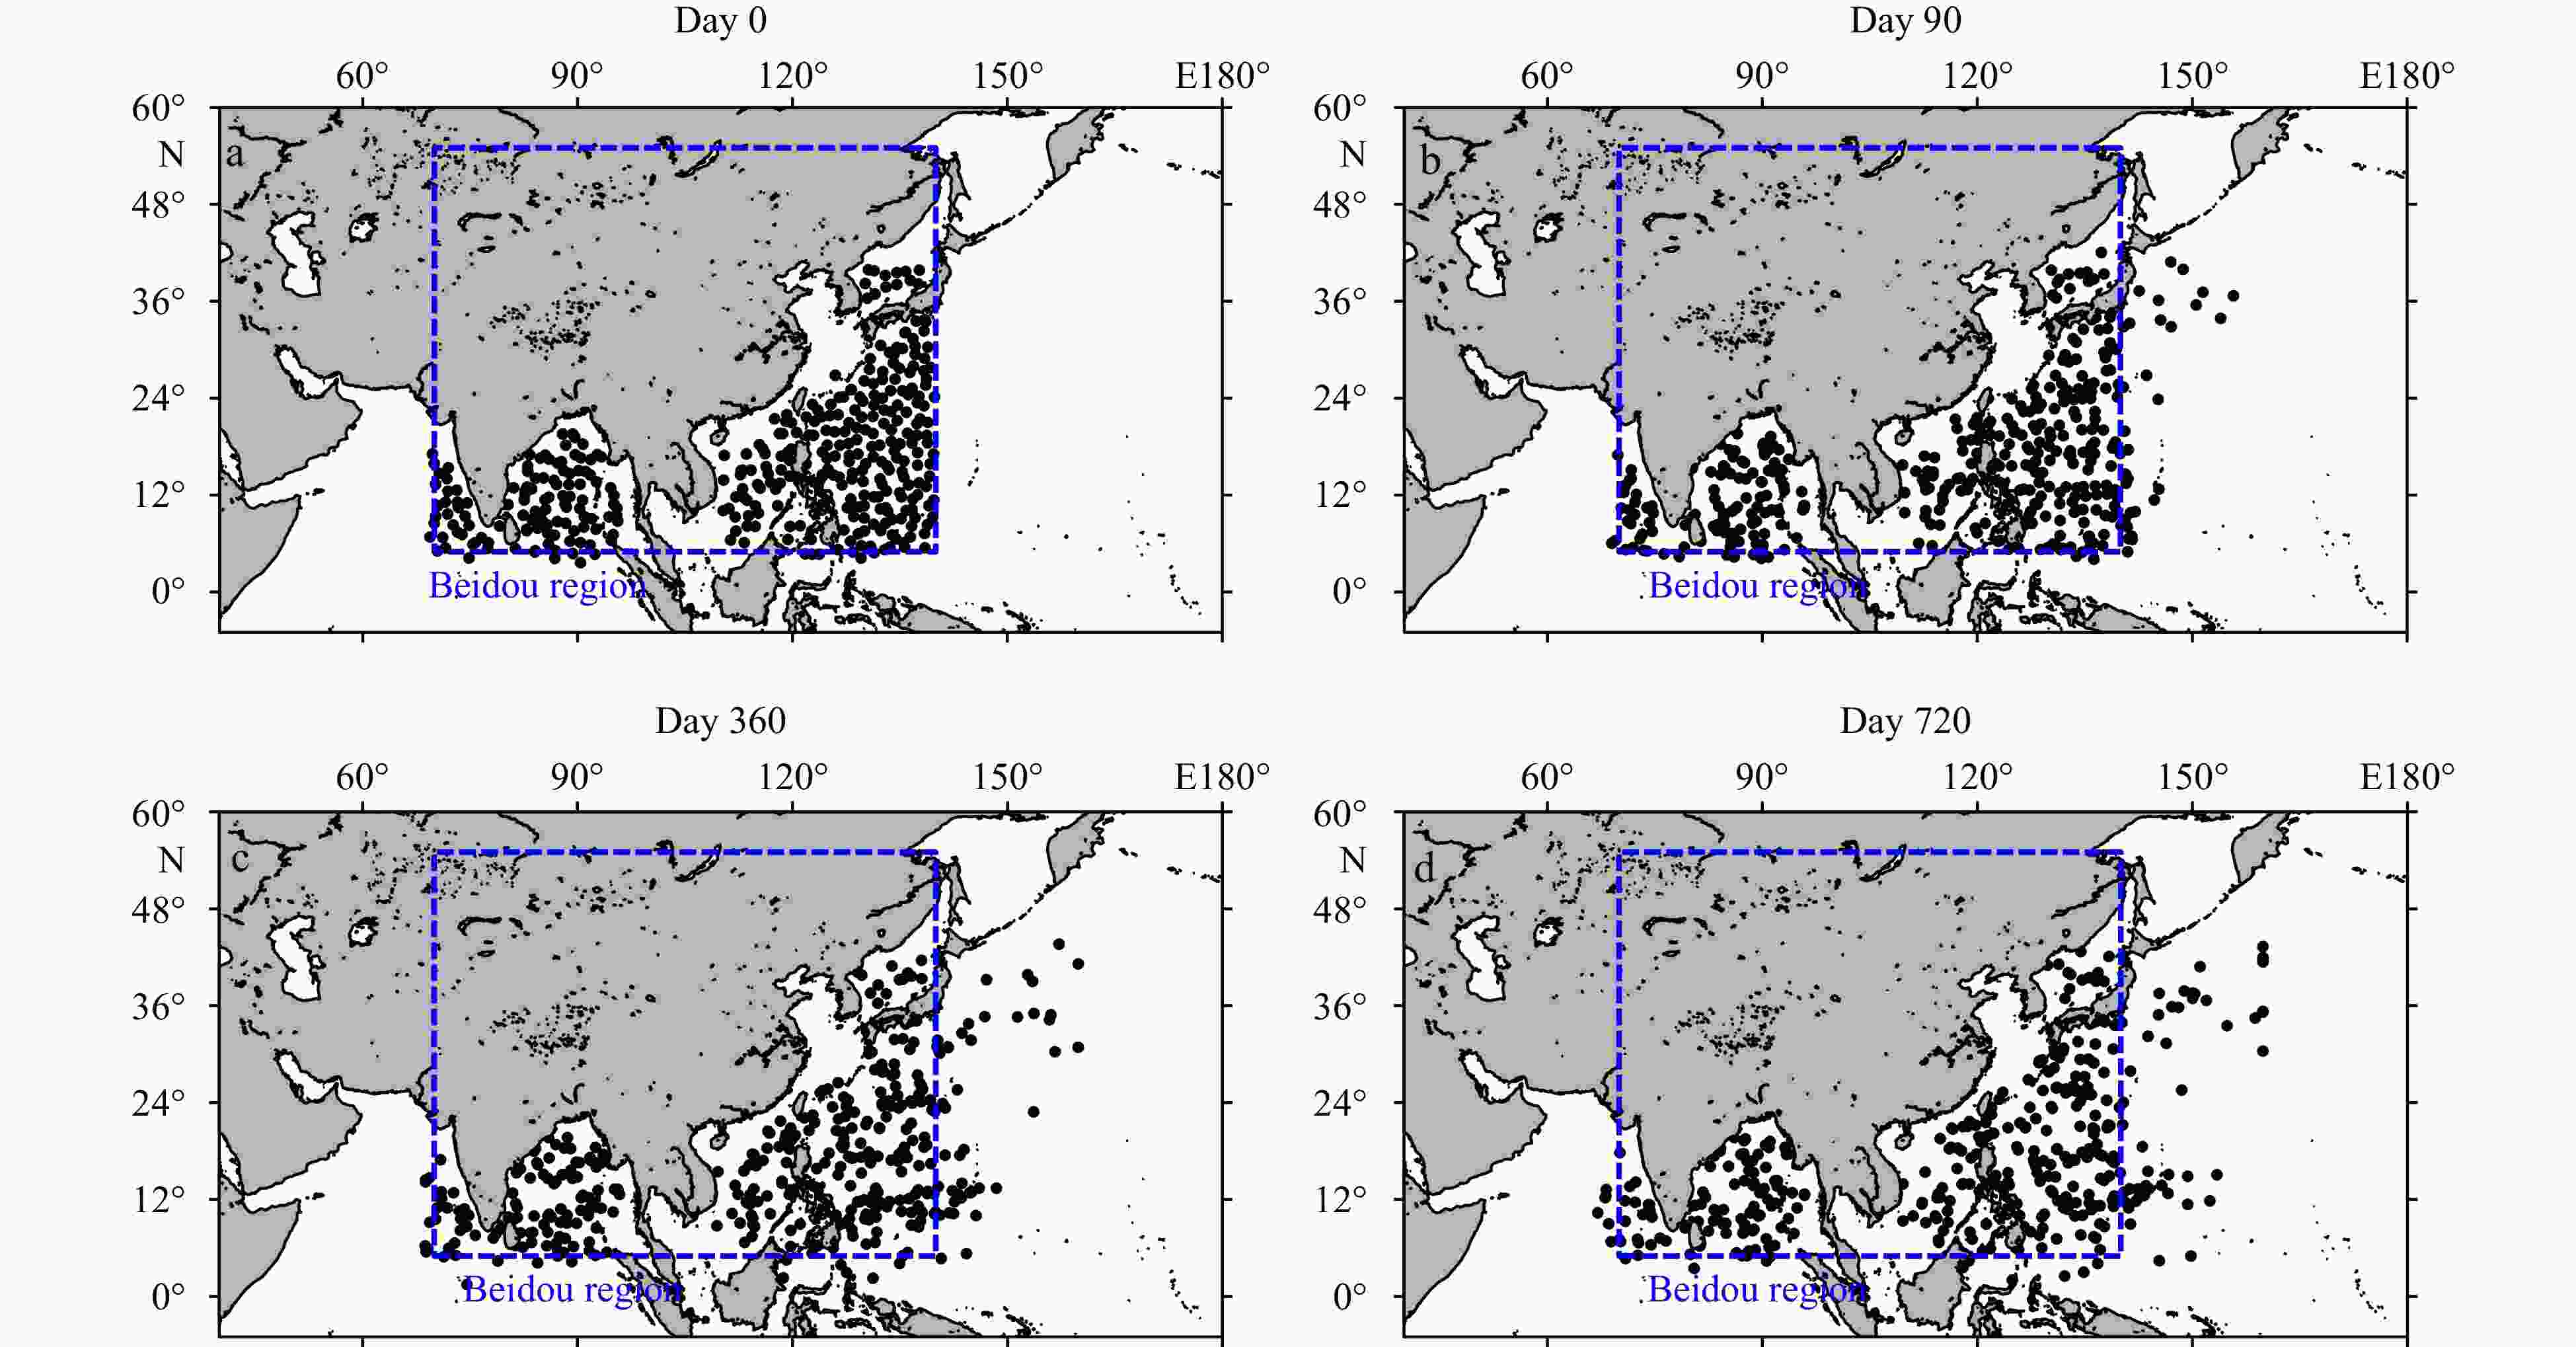
Figure 10. Distribution of the float locations of the 1.5° × 1.5° synthetic float array over the joint oceans within the model frame at different time. Panels a to d represent the results at Day 0, Day 90, Day 360, and Day 720, respectively. Blue dashed line box represents theoretical coverage of Beidou Ⅱ short message.

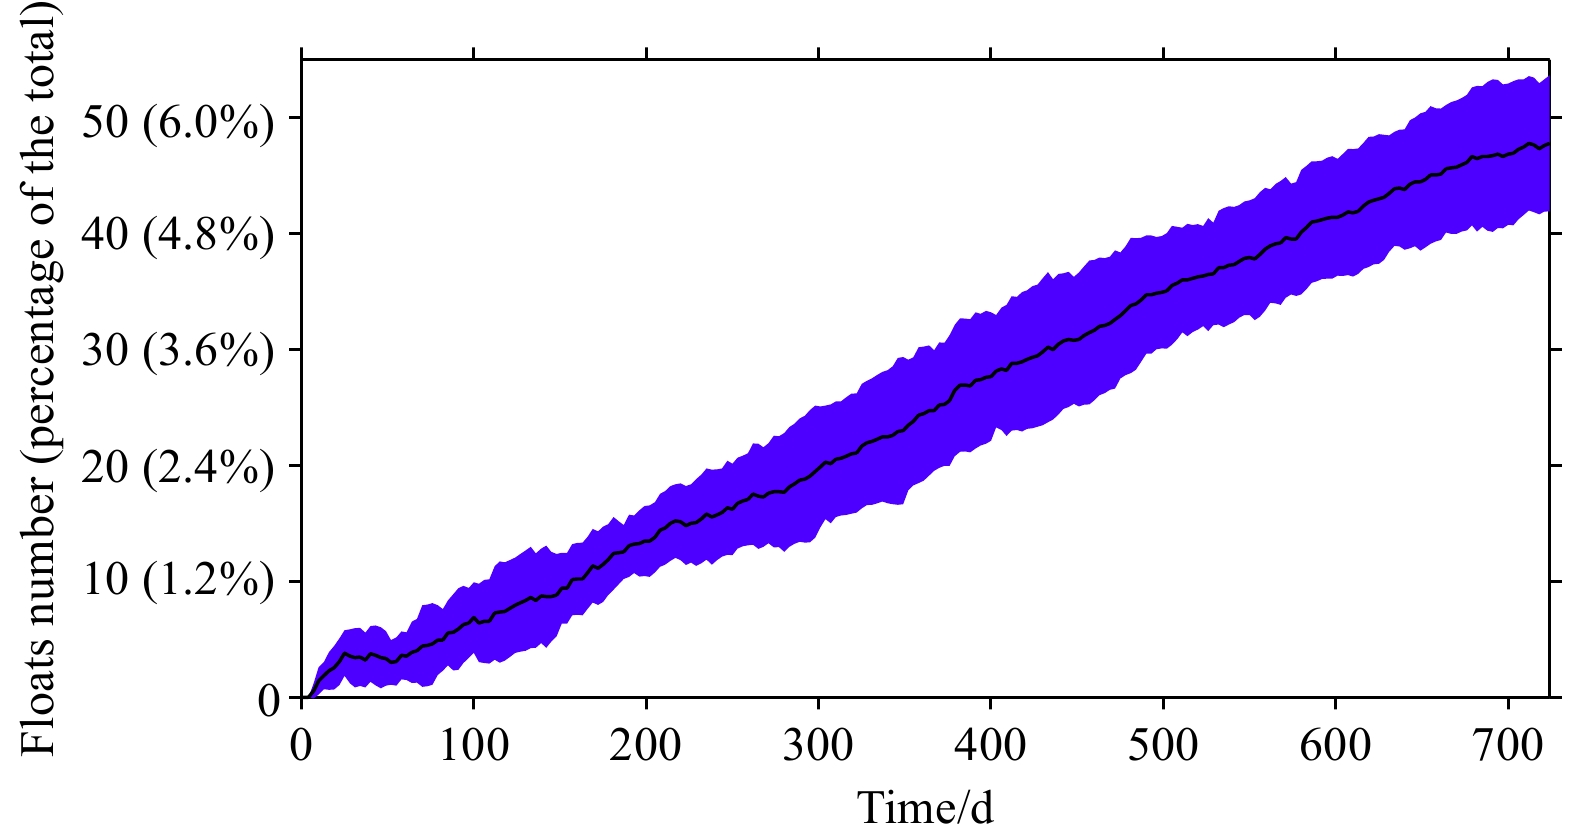
Figure 11. Number of floats from the 1.5° × 1.5° synthetic float array drift out of the Beidou coverage as a function of modeled time period. The blue colored shading indicates the one standard deviation.
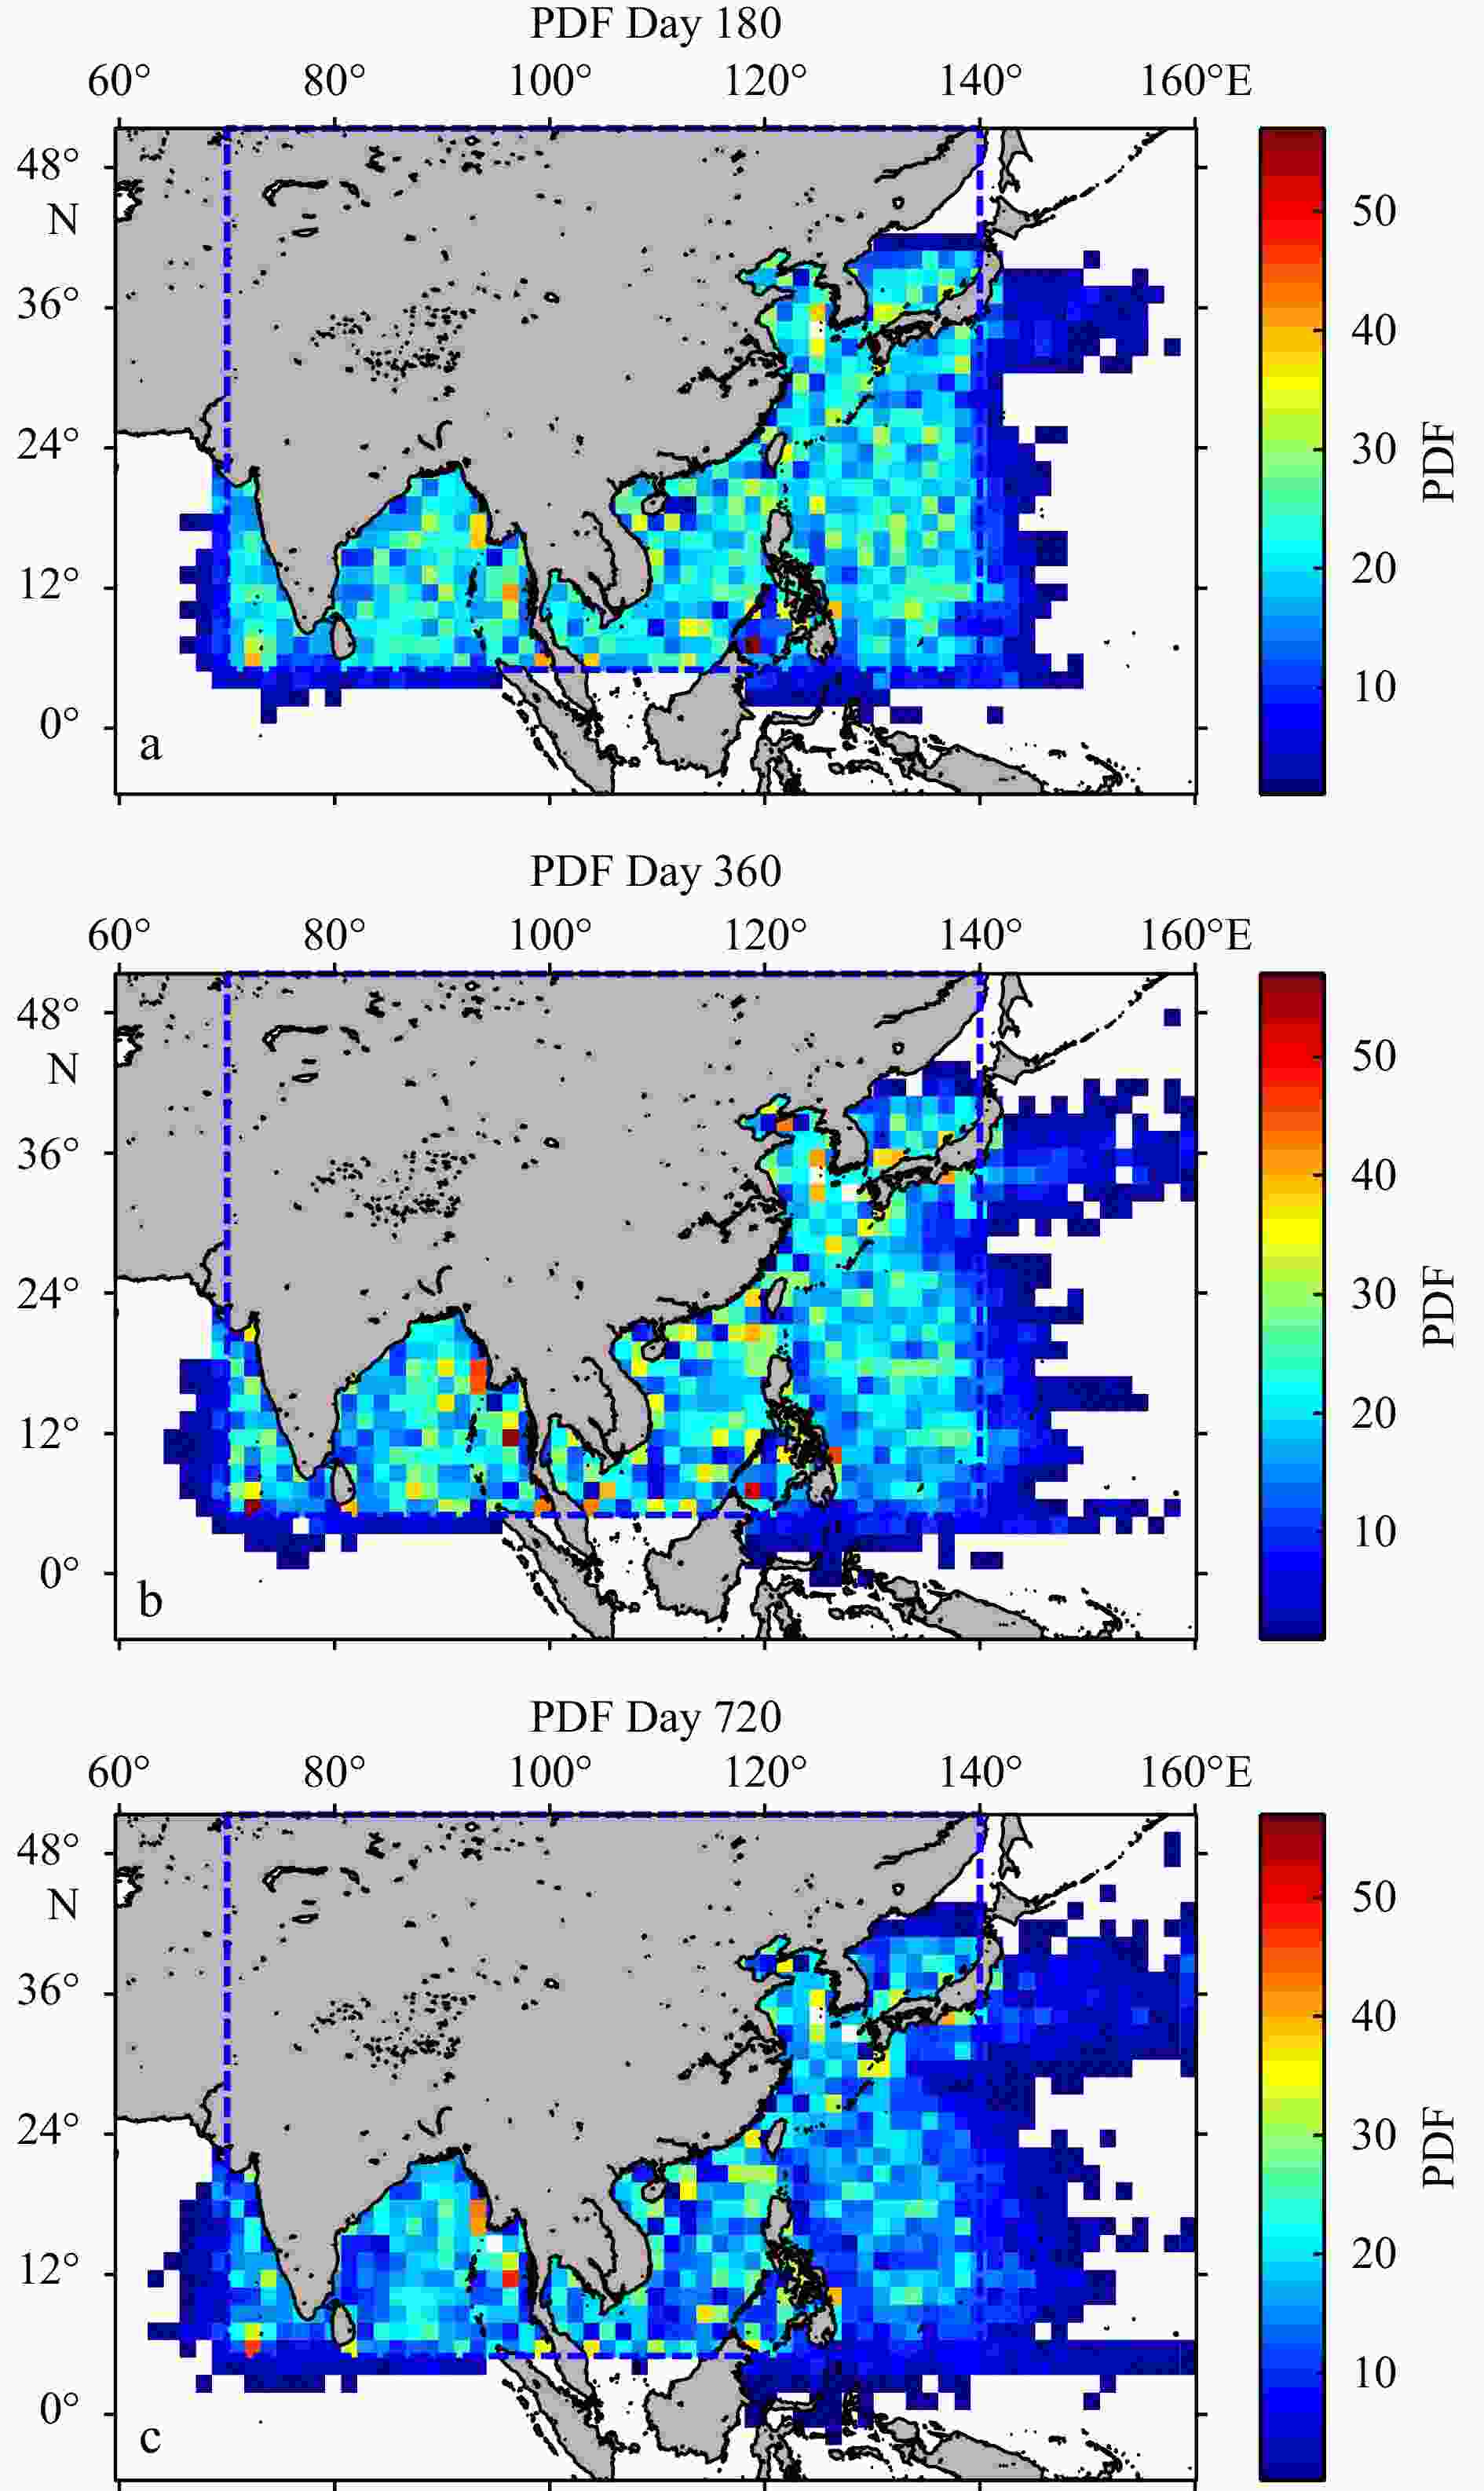
Figure 12. PDF of the 1.5° × 1.5° synthetic float array over the joint oceans within the model frame at different time. a. Day 180; b. Day 360; c. Day 720. Blue dashed line box represents theoretical coverage of Beidou Ⅱ short message.
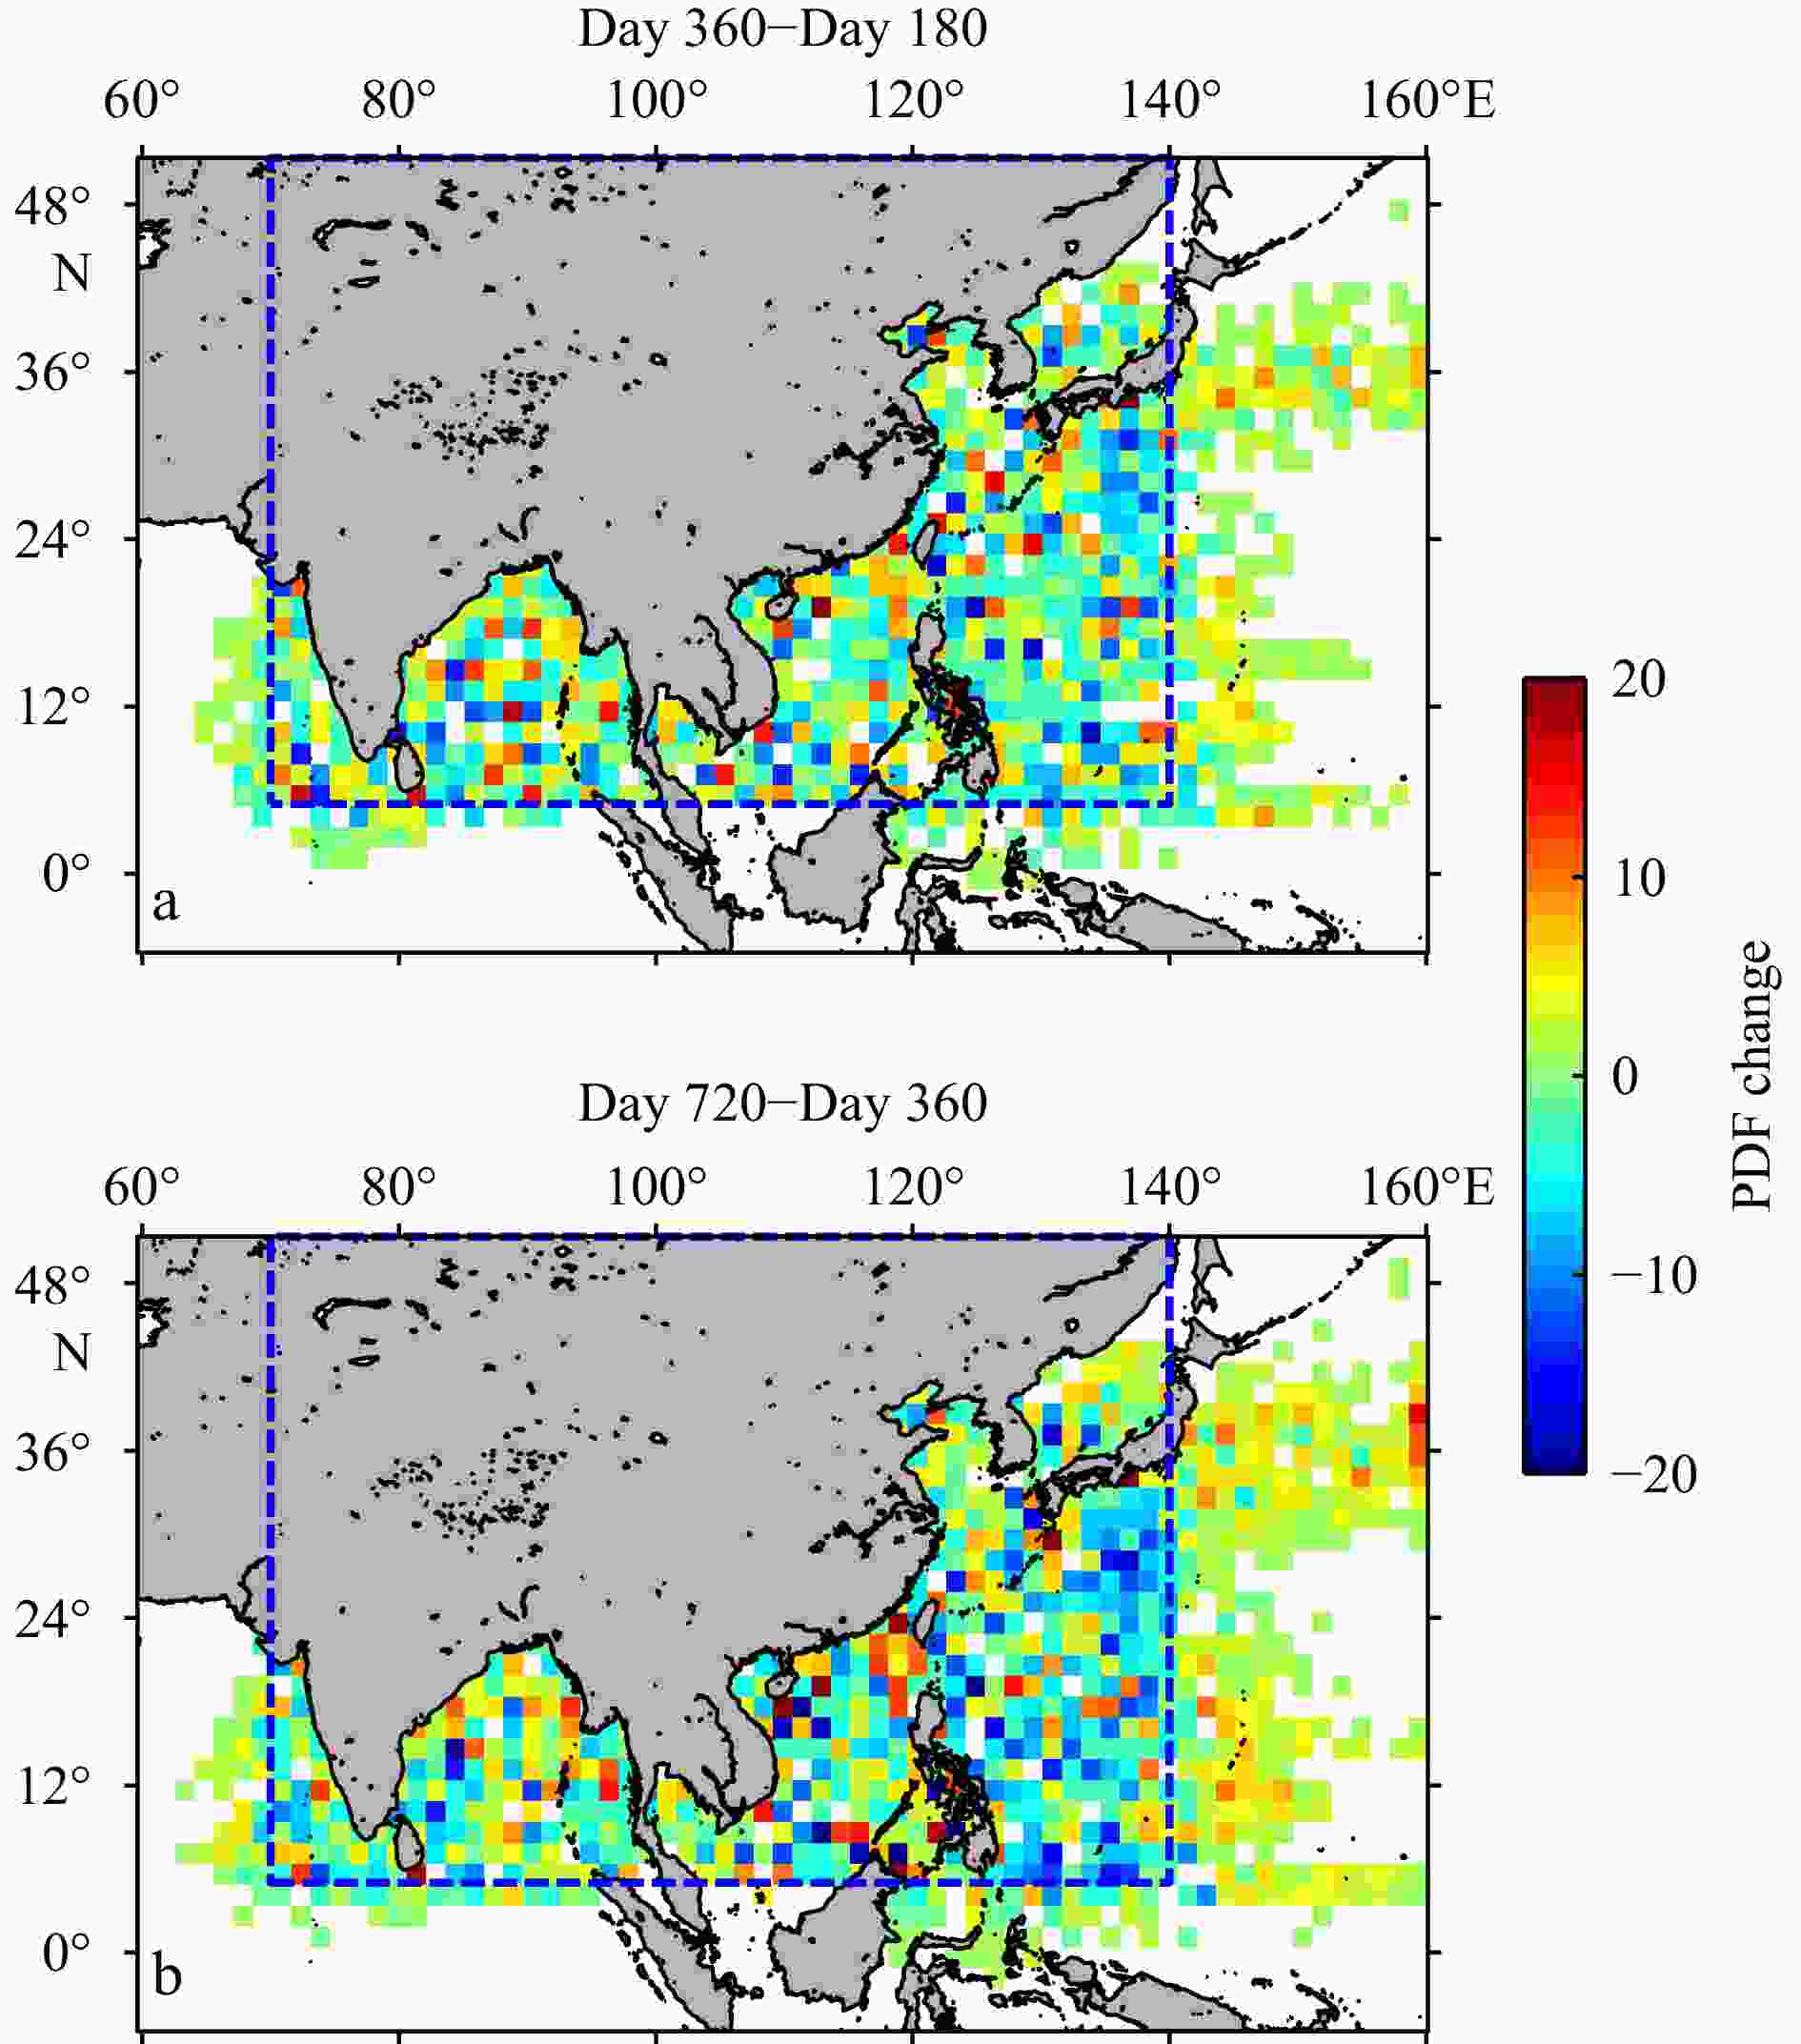
Figure 13. PDF change of the 1.5° × 1.5° synthetic float array over the joint oceans within the model frame at different time (a. PDF at Day 360 minus that at Day 180; b. PDF at Day 720 minus that at Day 360). Blue dashed line box represents theoretical coverage of Beidou Ⅱ short message.
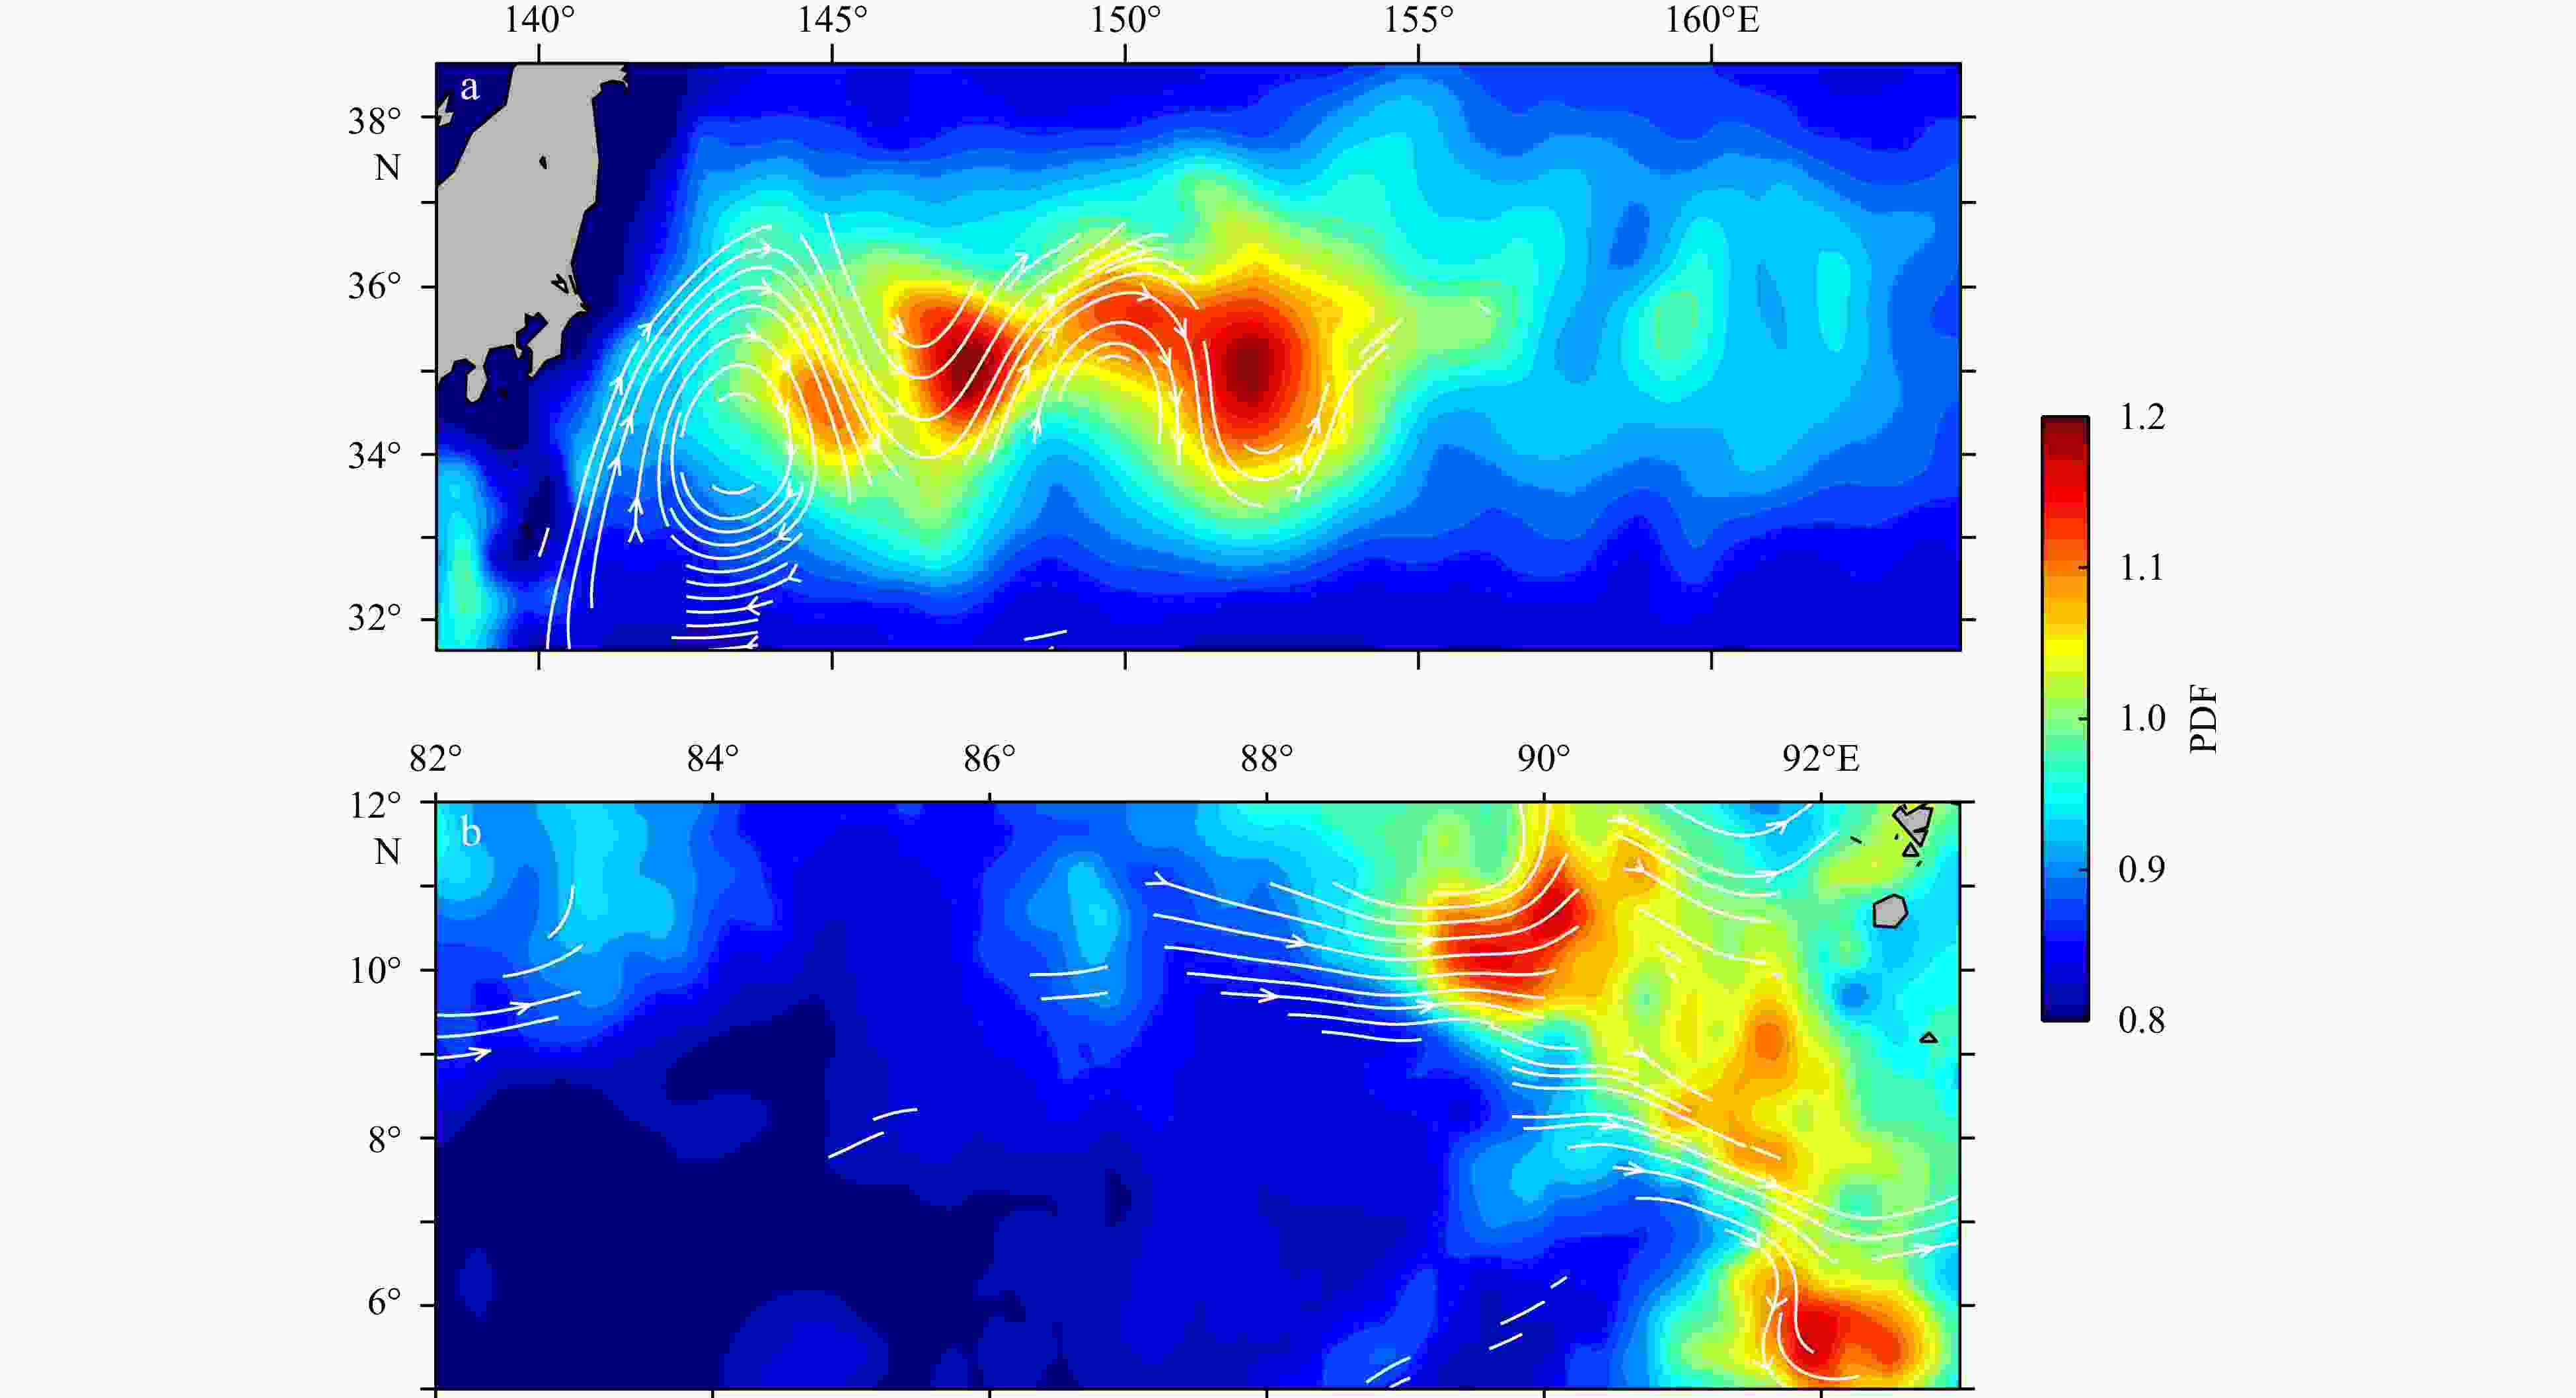
Figure 14. PDFs of the intensified single deployments of simulated floats (see Exp_5 in Table 2) in the Kuroshio Extension (32°–38°N, 138°–164°E) (a) and the Bay of Bengal monsoon region (5°–12°N, 82°–93°E) (b). The white lines with vectors denote the stream functions of the currents.
Table 1. BD float clocks configured in the BD float simulation
BD float stage Simulated BD float clock/h Descent stage 5.4 Parking stage 102.2 Deep descent stage 5.4 Ascend stage 6.5 Surface stage 0.5  下载: 导出CSV
Table 2. Description of the profiling float simulation experiments
Experiment Releasing position Releasing time Simulation
duration/dReleasing
gridQuantity of
single releaseRepeat releasing
timeExp_1 East of the Luzon Strait
(20°–28°N, 122°–127°E)August 1 of each year 300 0.5° × 0.4° 100 8 Exp_2 Philippine Sea
(8°–25°N, 127°–135°E)August 1 of each year 300 & 400 0.8° × 1.7° 100 8 Exp_3 Bay of Bengal
(6°–12°N, 83°–90°E)the first day of every month 400 0.7° × 0.6° 100 94 Exp_4 East Indian–South China Sea–
Northwest Pacific Ocean
(0°–40°N, 70°–140°E)the first day of January,
April, July, and October
of each year720 1.5° × 1.5° 823 23 Exp_5 Kuroshio Extension & monsoon
current of Bay of BengalAugust 1 of 2005 100 0.1° × 0.1° 7700 &15600 1
下载: 导出CSV
-
Batchelor G K. 1952. The effect of homogeneous turbulence on material lines and surfaces. Proceedings of the Royal Society of London. Series A. Mathematical and Physical Sciences, 213(1114): 349–366, doi: 10.1098/rspa.1952.0130 Chai Fei, Johnson K S, Claustre H, et al. 2020. Monitoring ocean biogeochemistry with autonomous platforms. Nature Reviews Earth & Environment, 1(6): 315–326 Chen Jiaqiang, Gong Xun, Guo Xinyu, et al. 2022. Improved perceptron of subsurface chlorophyll maxima by a deep neural network: a case study with BGC-Argo float data in the northwestern Pacific Ocean. Remote Sensing, 14(3): 632, doi: 10.3390/rs14030632 Claustre H, Johnson K S, Takeshita Y. 2020. Observing the global ocean with biogeochemical-Argo. Annual Review of Marine Science, 12(1): 23–48, doi: 10.1146/annurev-marine-010419-010956 Du Yan, Zhang Lianyi, Zhang Yuhong, 2019. Review of the tropical gyre in the Indian Ocean with its impact on heat and salt transport and regional climate modes. Advances in Earth Science (in Chinese), 34(3): 243–254 Hunter J R, Craig P D, Phillips H E, 1993. On the use of random walk models with spatially variable diffusivity. Journal of Computational Physics, 106(2): 366–376, doi: 10.1016/S0021-9991(83)71114-9 Kinderman A J, Monahan J F. 1977. Computer generation of random variables using the ratio of uniform deviates. ACM Transactions on Mathematical Software, 3(3): 257–260, doi: 10.1145/355744.355750 Johnson K S, Claustre H. 2016. Bringing biogeochemistryinto the Argo age. Eos Transactions American Geophysical Union, 97: 407–435, doi: 10.1029/2016EO051467 Li Bofeng, Zhang Zhiteng, Zang Nan, et al. 2019. High-precision GNSS ocean positioning with BeiDou short-message communication. Journal of Geodesy, 93(2): 125–139, doi: 10.1007/s00190-018-1145-z Lien R C, Sanford T B, Carlson J A, et al. 2016. Autonomous microstructure EM-APEX floats. Methods in Oceanography, 17: 282–295, doi: 10.1016/j.mio.2016.09.003 Liu Qinyu, Kaneko A, Jilan S. 2008. Recent progress in studies of the South China Sea circulation. Journal of Oceanography, 64(5): 753–762, doi: 10.1007/s10872-008-0063-8 Liu Zenghong, Li Zhaoqin, Lu Shaolei, et al. 2021. Scattered dataset of global ocean temperature and salinity profiles from the international Argo program. Journal of Global Change Data & Discovery, 5(3): 312–321, doi: 10.3974/geodb.2021.06.05.V1 Liu Zenghong, Xing Xiaogang, Chen Zhaohui, et al. 2023. Twenty years of ocean observations with China Argo. Acta Oceanologica Sinica, 42(2): 1–16, doi: 10.1007/s13131-022-2076-3 Menemenlis D, Campin J M, Heimbach P, et al. 2008. ECCO2: high resolution global ocean and sea ice data synthesis. Mercator Ocean Quarterly Newsletter, 31: 13–21 Menemenlis D, Fukumori I, Lee T. 2005. Using Green’s functions to calibrate an ocean general circulation model. Monthly Weather Review, 133: 1224–1240, doi: 10.1175/MWR2912.1 Menemenlis D, Hill C, Adcrocft A, et al. 2005. NASA supercomputer improves prospects for ocean climate research. Eos Transactions American Geophysical Union, 86(9): 89–96, doi: 10.1029/2005EO090002 Montenbruck O, Hauschild A, Steigenberger P, et al. 2013. Initial assessment of the COMPASS/BeiDou-2 regional navigation satellite system. GPS Solutions, 17(2): 211–222, doi: 10.1007/s10291-012-0272-x Nie Zhixi, Wang Baoyang, Wang Zhenjie, et al. 2020. An offshore real-time precise point positioning technique based on a single set of BeiDou short-message communication devices. Journal of Geodesy, 94(9): 78, doi: 10.1007/s00190-020-01411-6 Ollitrault M, Rannou J P. 2013. ANDRO: An Argo-based deep displacement dataset. Journal of Atmospheric and Oceanic Technology, 30(4): 759–788, doi: 10.1175/JTECH-D-12-00073.1 Roemmich D, Boebel O, Freeland H, et al. 1998. On the design and implementation of Argo―a global array of profiling floats. GODAE International Project office, 32 Roemmich D, Gilson J. 2009. The 2004–2008 mean and annual cycle of temperature, salinity, and steric height in the global ocean from the Argo Program. Progress in Oceanography, 82(2): 81–100, doi: 10.1016/j.pocean.2009.03.004 Roemmich D, Gilson J, Davis R, et al. 2007. Decadal spinup of the South Pacific subtropical gyre. Journal of Physical Oceanography, 37(2): 162–173, doi: 10.1175/JPO3004.1 Roemmich D, Johnson G C, Riser S, et al. 2009. The Argo program: observing the global ocean with profiling floats. Oceanography, 22(2): 34–43, doi: 10.5670/oceanog.2009.36 Shaw P T, Chao S Y, Fu L L. 1999. Sea surface height variations in the South China Sea from satellite altimetry. Oceanologica Acta, 22(1): 1–17, doi: 10.1016/S0399-1784(99)80028-0 Swallow J C. 1984. Some aspects of the physical oceanography of the Indian Ocean. Deep-Sea Research Part A. Oceanographic Research Papers, 31(6–8): 639–650 Tamsitt V, Drake H F, Morrison A K, et al. 2017. Spiraling pathways of global deep waters to the surface of the Southern Ocean. Nature Communications, 8: 172, doi: 10.1038/s41467-017-00197-0 van Sebille E, Griffies S M, Abernathey R, et al. 2018. Lagrangian ocean analysis: fundamentals and practices. Ocean Modelling, 121: 49–75, doi: 10.1016/j.ocemod.2017.11.008 Wang Tianyu, Du Yan, Wang Minyang. 2021. Overlooked current estimation biases arising from the Lagrangian Argo trajectory derivation method. Journal of Physical Oceanography, 52(1): 3–19, doi: 10.1175/JPO-D-20-0287.1 Wang Tianyu, Gille S T, Mazloff M R, et al. 2018. Numerical simulations to project Argo float positions in the middepth and deep southwest Pacific. Journal of Atmospheric and Oceanic Technology, 35(7): 1425–1440, doi: 10.1175/JTECH-D-17-0214.1 Wang Tianyu, Gille S T, Mazloff M R, et al. 2020. Eddy-induced acceleration of Argo floats. Journal of Geophysical Research: Oceans, 125: e2019JC016042, doi: 10.1029/2019JC016042 Wijffels S E, Hall M M, Joyce T, et al. 1998. Multiple deep gyres of the western North Pacific: a WOCE section along 149°E. Journal of Geophysical Research: Oceans, 103(C6): 12985–13009, doi: 10.1029/98JC01016 Wu Wei, Du Yan, Qian Yuku, et al. 2020. Structure and seasonal variation of the Indian Ocean tropical gyre based on surface drifters. Journal of Geophysical Research: Oceans, 125(5): e2019JC015483, doi: 10.1029/2019JC015483 Wyrtki K. 1973. An equatorial jet in the Indian Ocean. Science, 181(4096): 262–264, doi: 10.1126/science.181.4096.262 Xia Yifan, Du Yan. 2022. Mid-depth zonal velocity in the southern tropical Indian Ocean: striation-like structures and their dynamics. Journal of Physical Oceanography, 52(11): 2825–2840, doi: 10.1175/JPO-D-21-0222.1 -


 点击查看大图

计量
- 文章访问数: 49
- HTML全文浏览量: 16
- PDF下载量: 0
- 被引次数: 0

