2022 Vol. 41, No. 4

Cover
Cover
2022, 41(4)
Abstract:
Contents
Contents
2022, 41(4): .
Abstract:
Article$Physical Oceanography, Marine Meteorology and Marine Physics
Submesoscale motions and their seasonality in the northern Bay of Bengal
Lanman Li, Xuhua Cheng, Zhiyou Jing, Haijin Cao, Tao Feng
2022, 41(4): 1-13. doi: 10.1007/s13131-021/1847-6
Abstract:
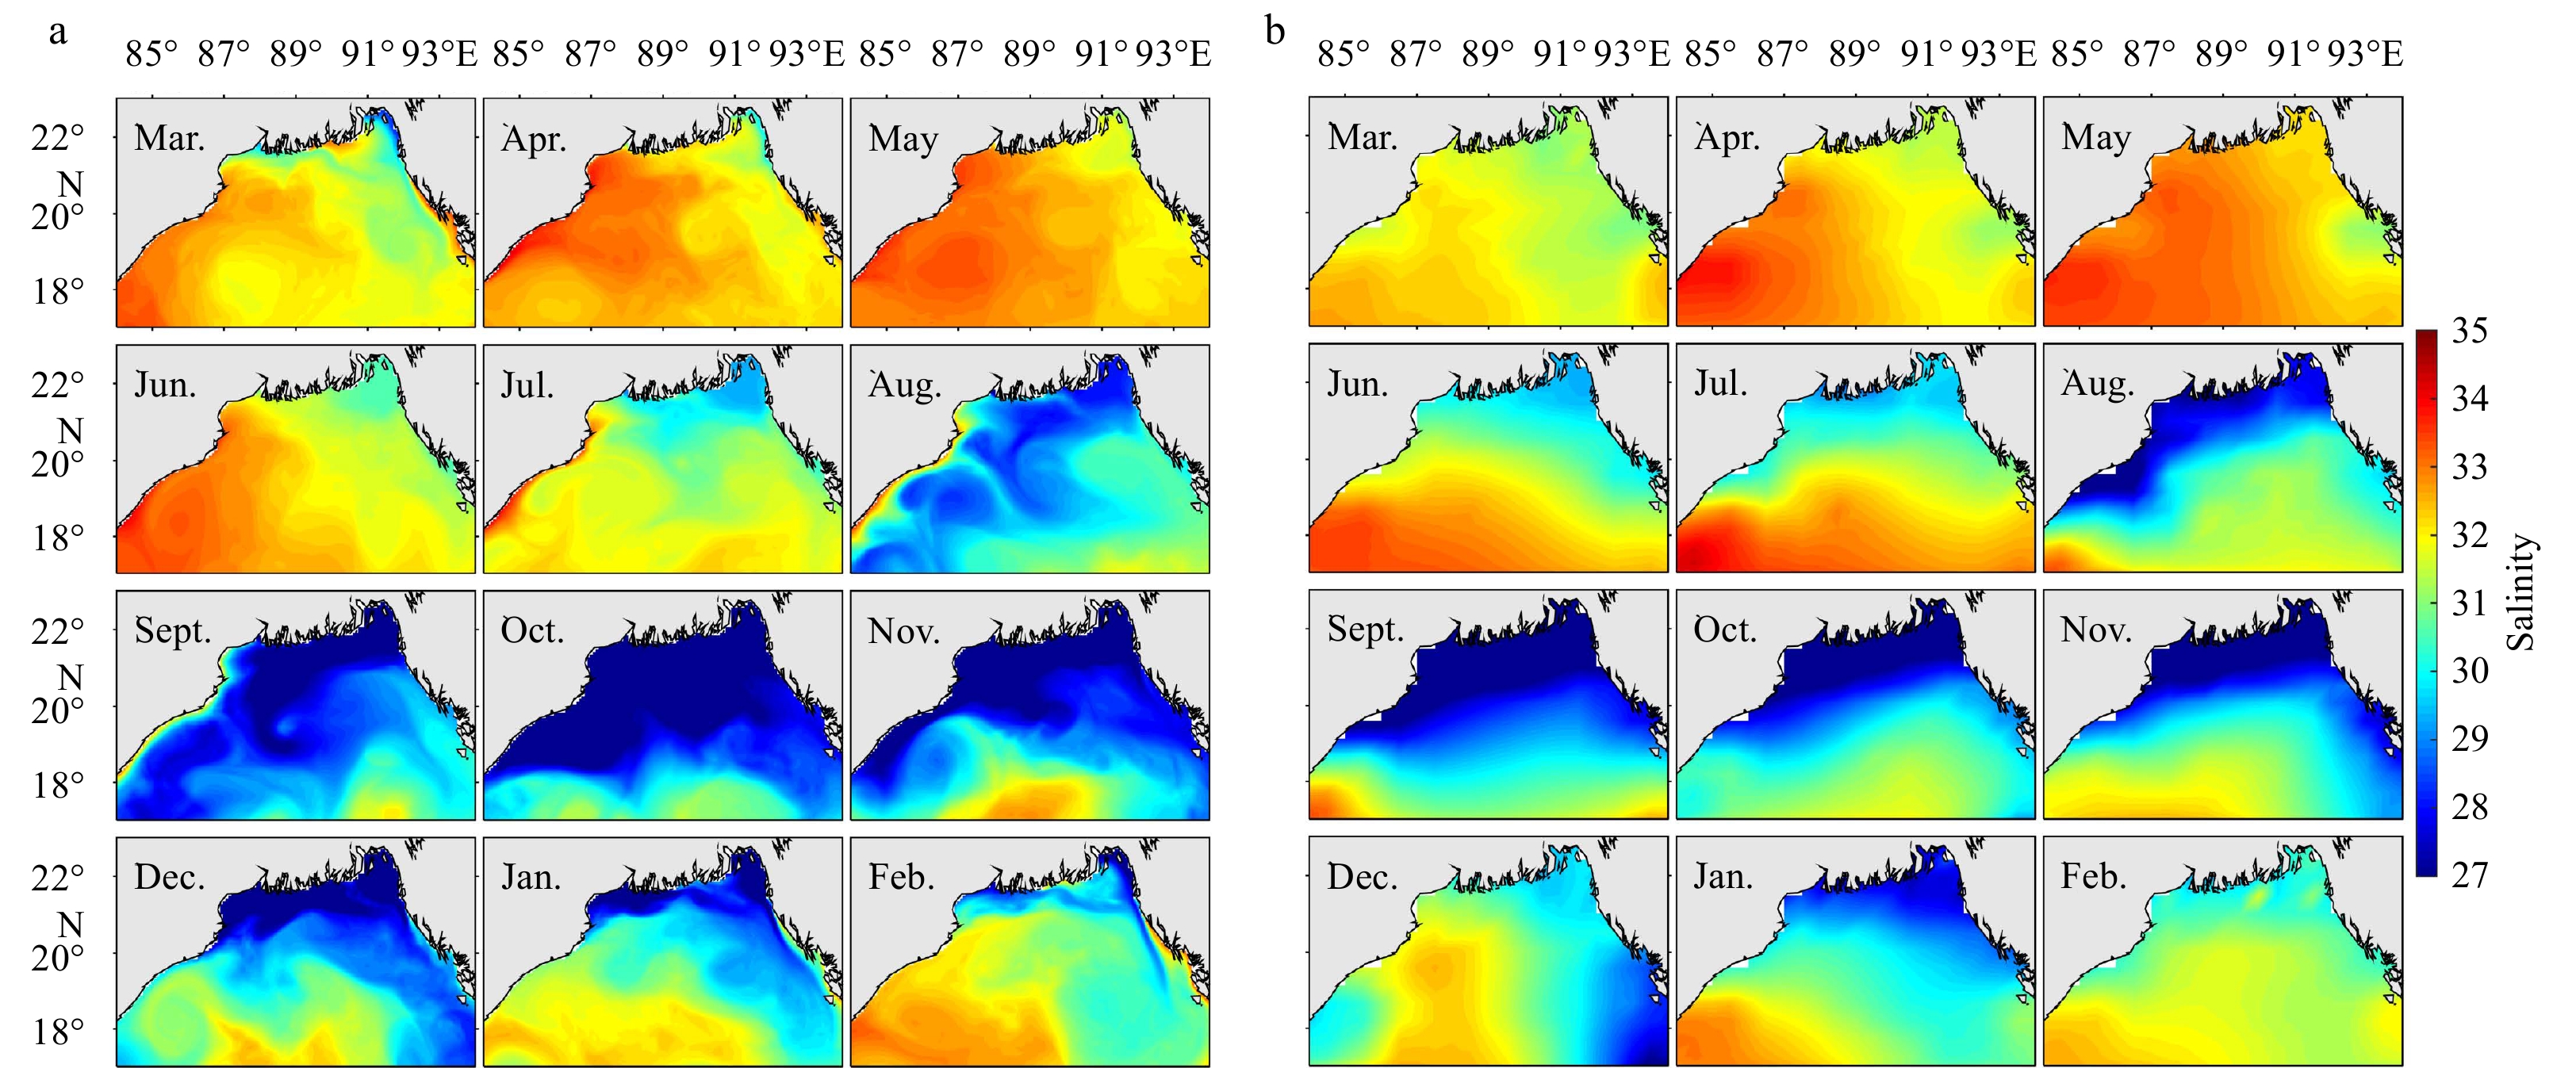
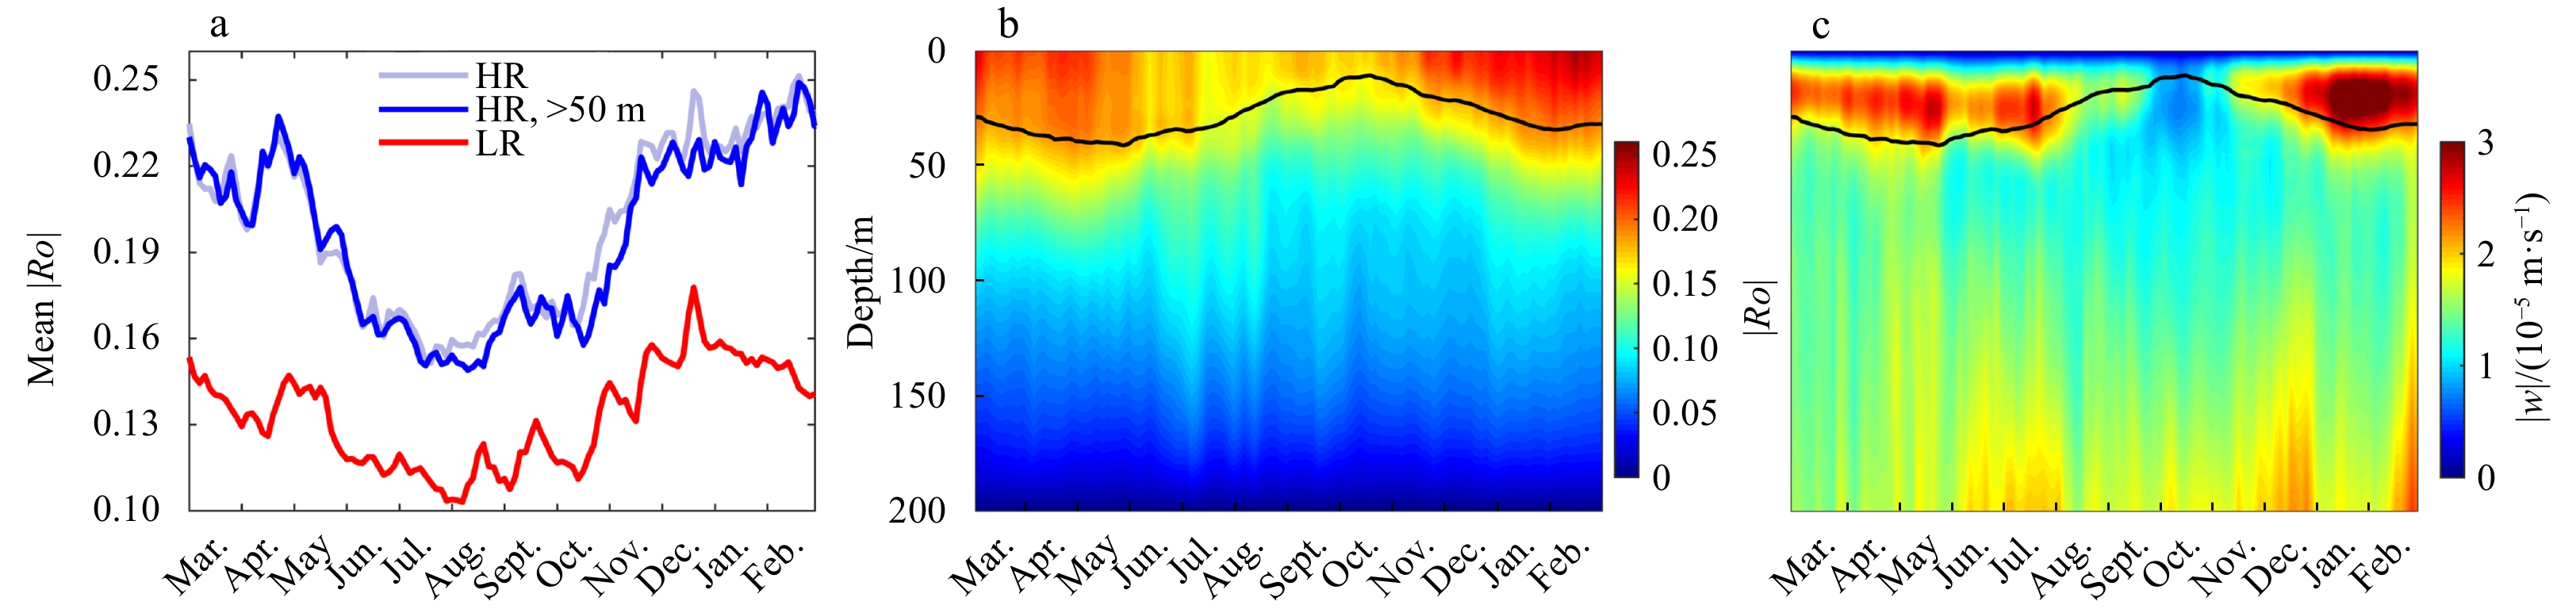
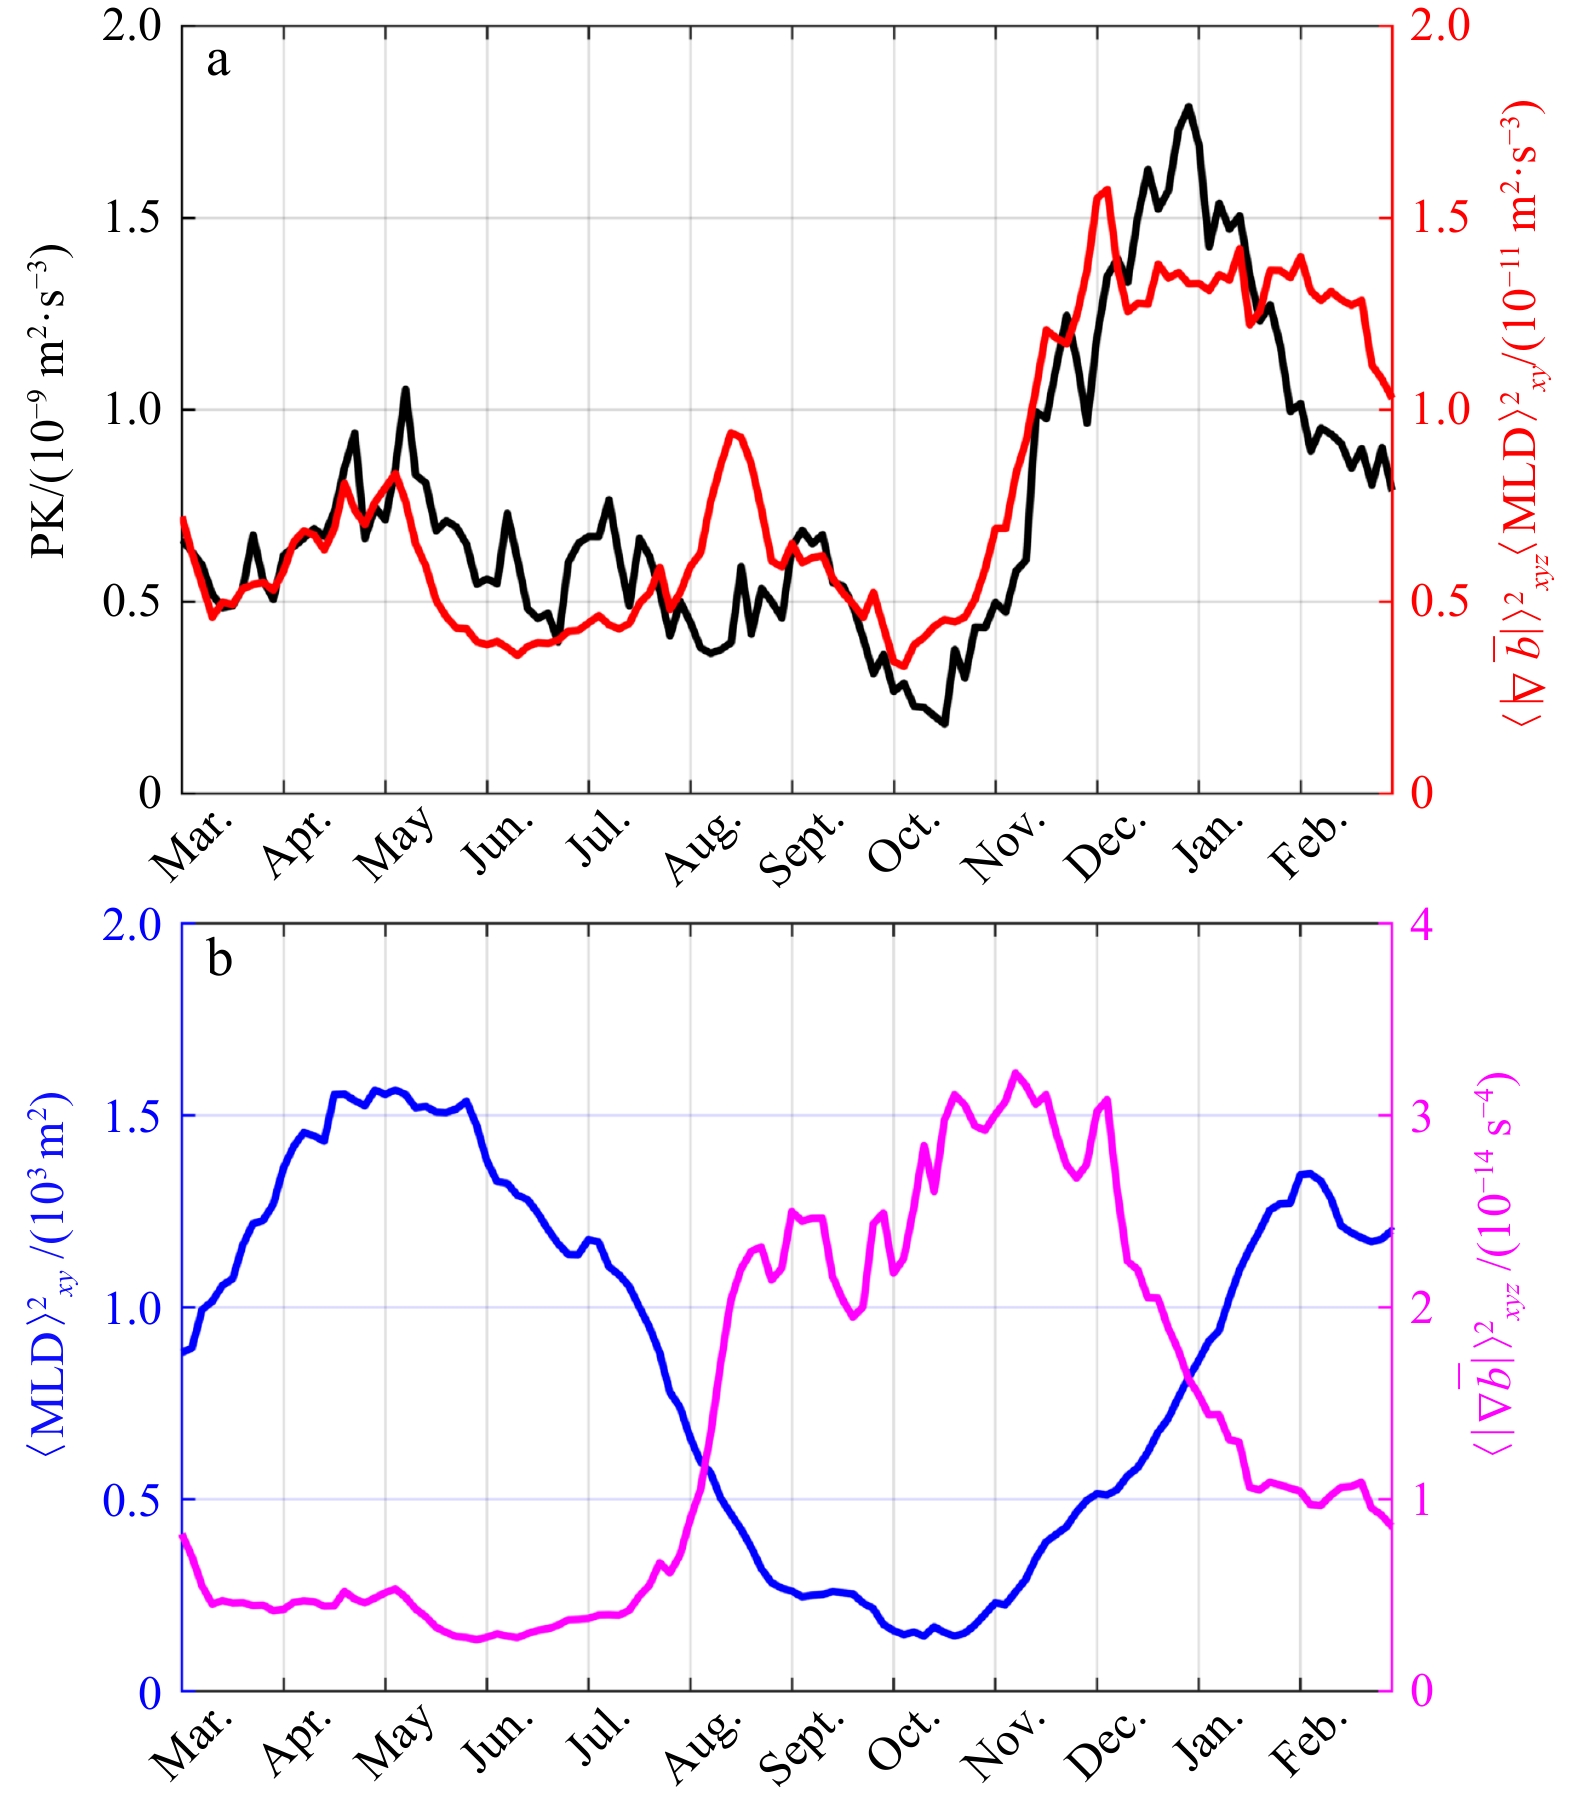
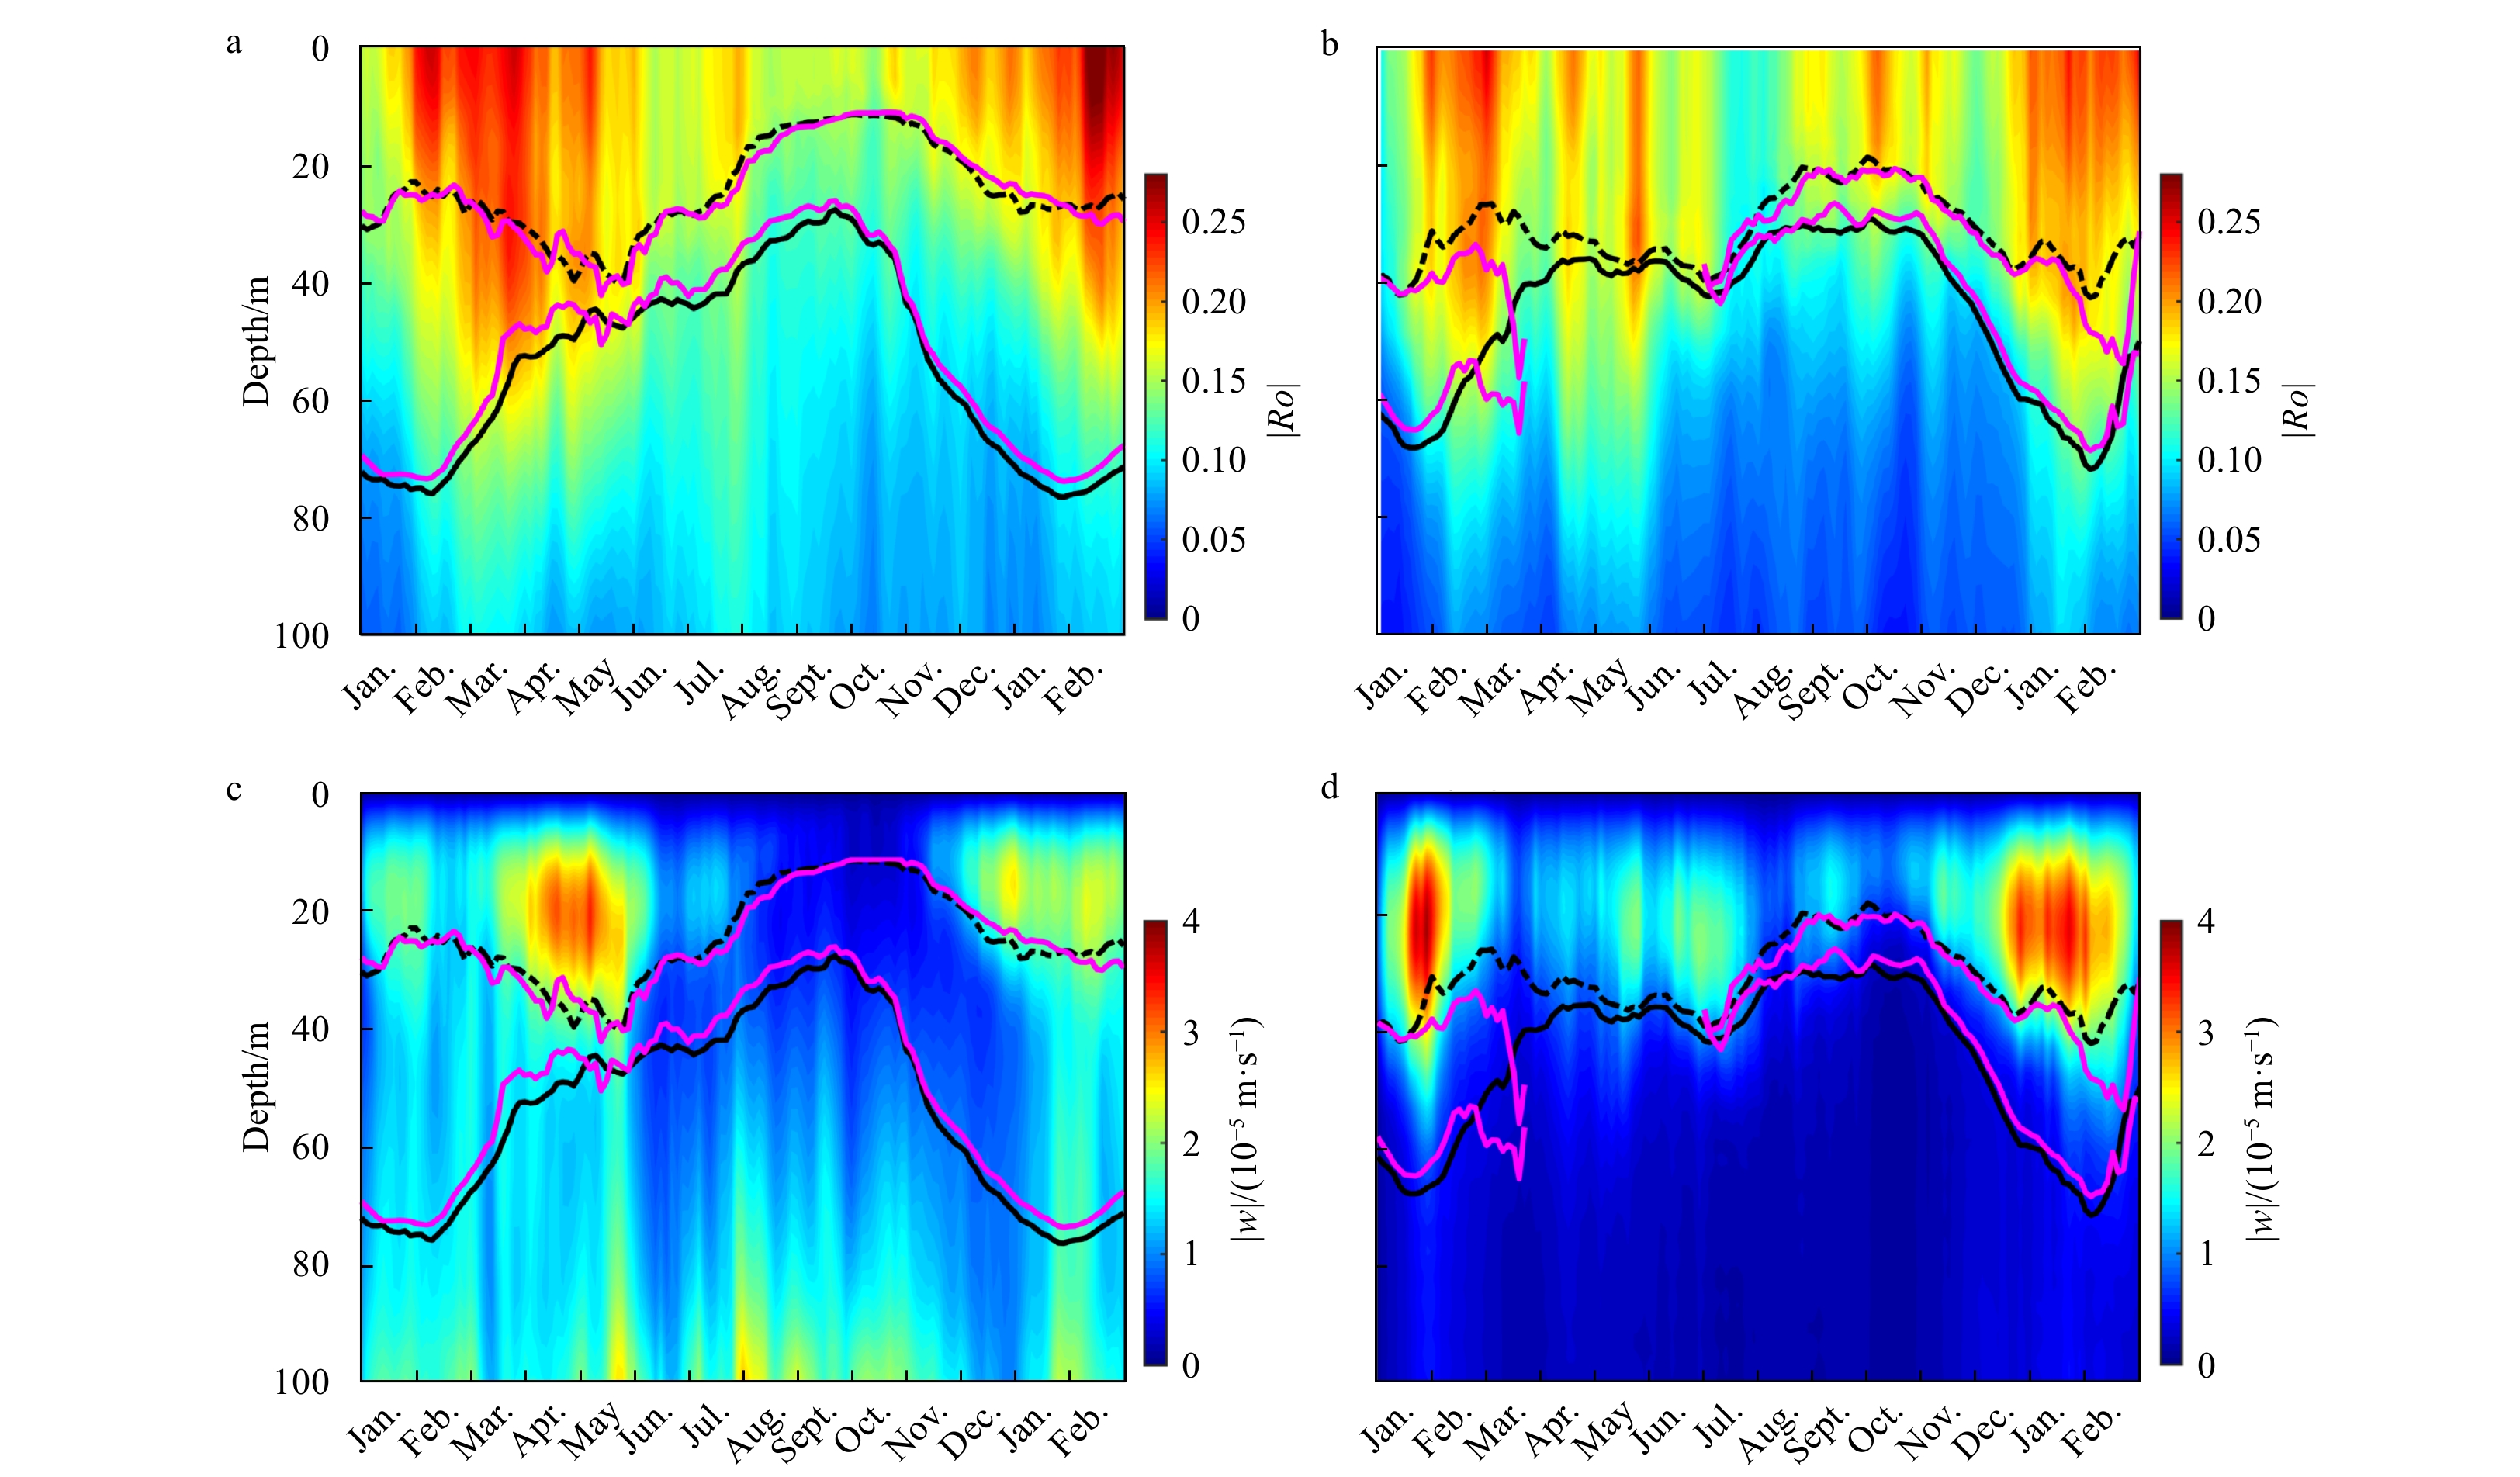
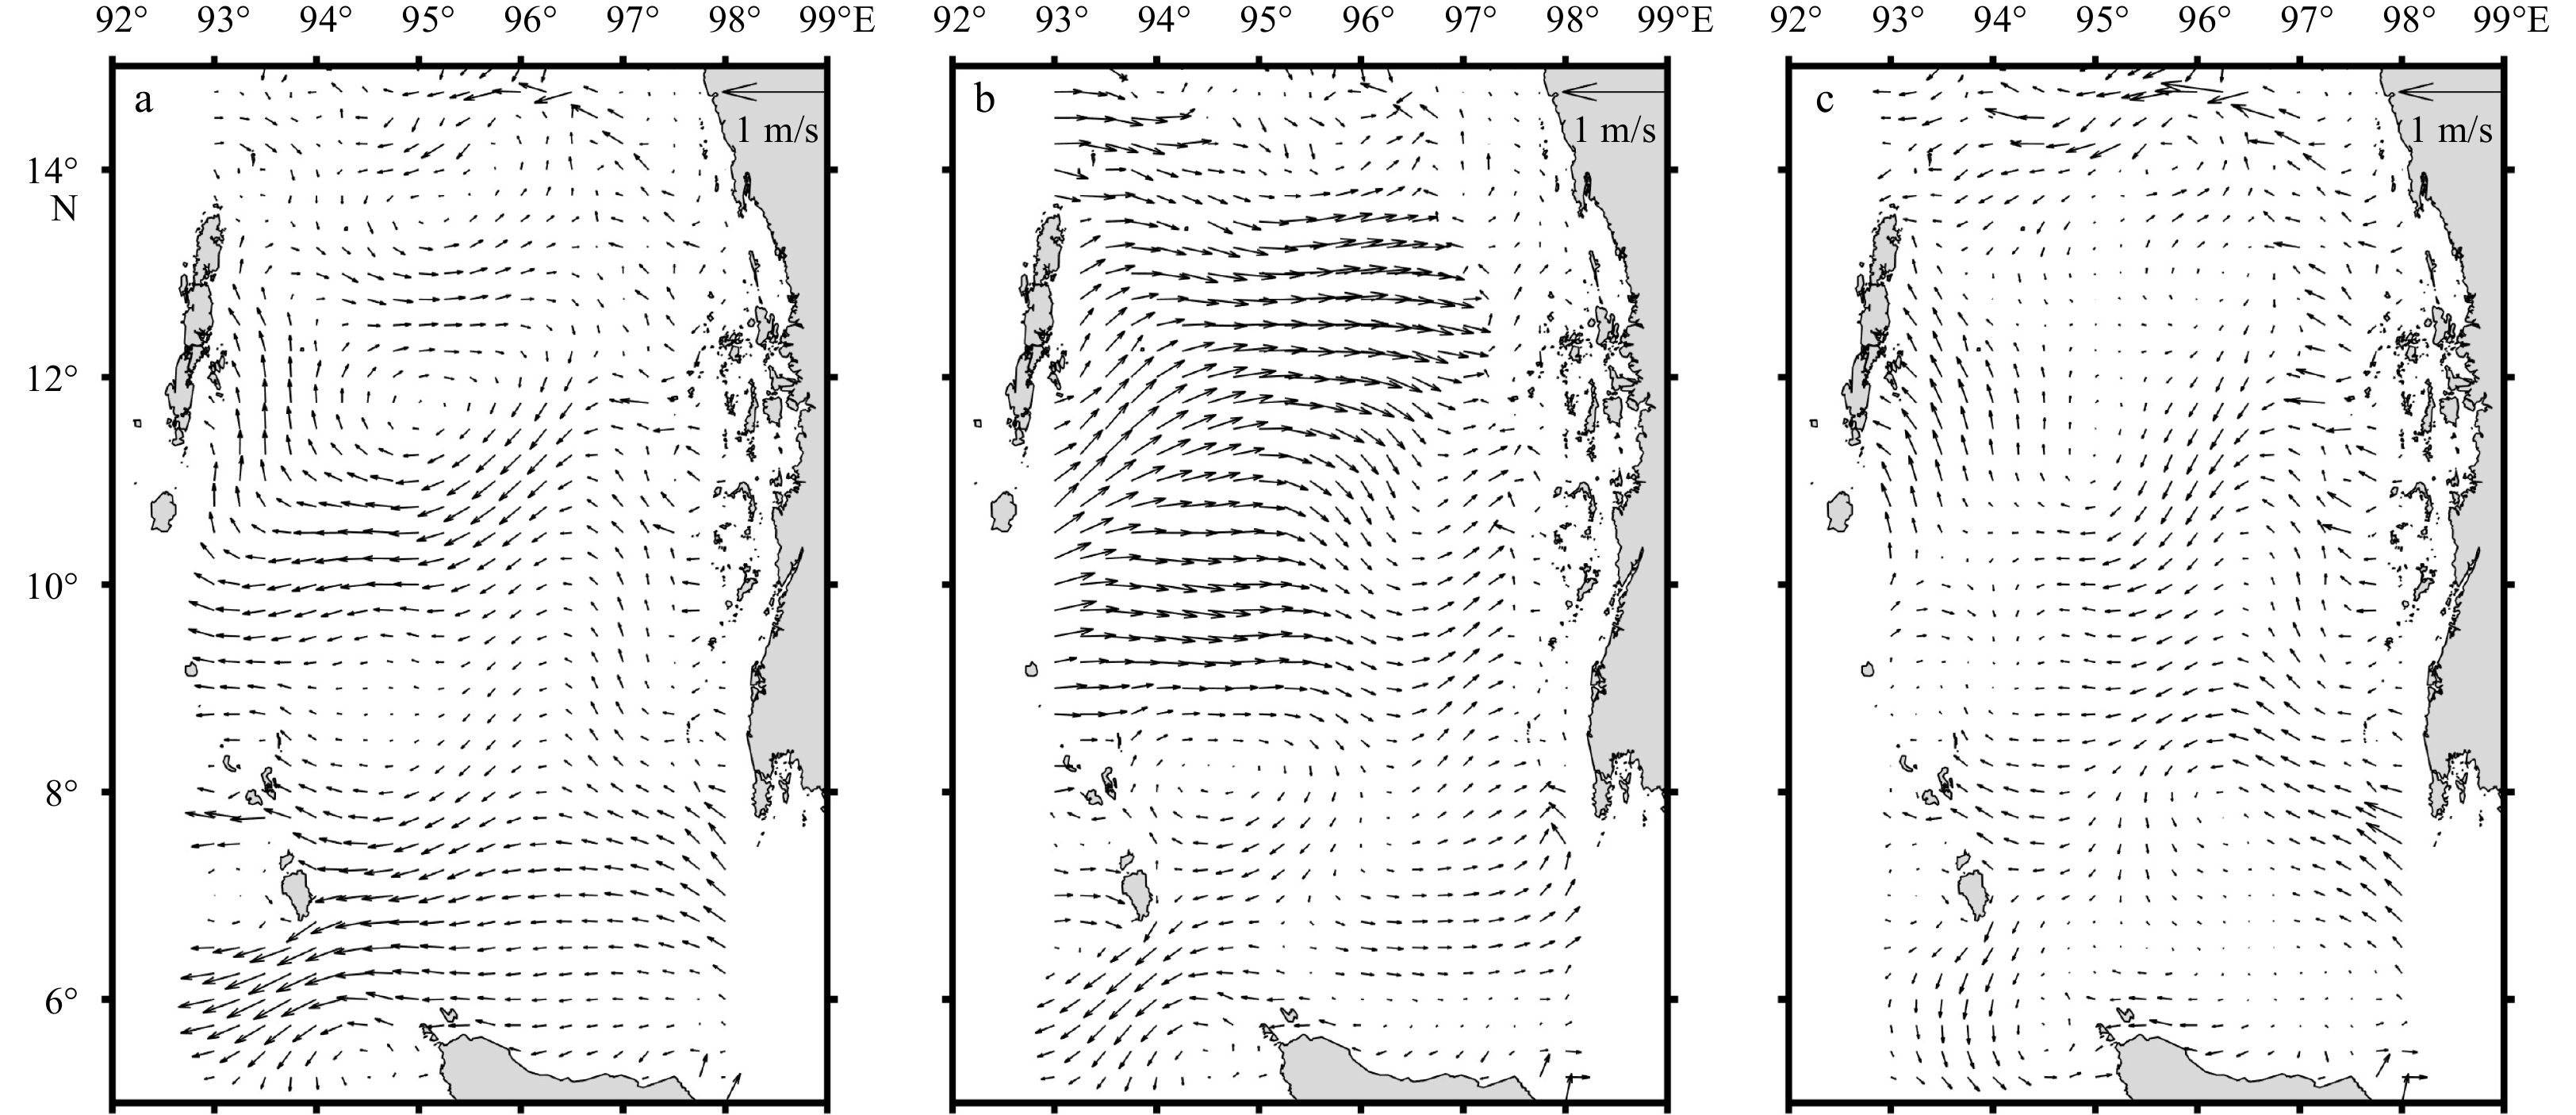
The unbalanced submesoscale motions and their seasonality in the northern Bay of Bengal (BoB) are investigated using outputs of the high resolution regional oceanic modeling system. Submesoscale motions in the forms of filaments and eddies are present in the upper mixed layer during the whole annual cycle. Submesoscale motions show an obvious seasonality, in which they are active during the winter and spring but weak during the summer and fall. Their seasonality is associated with the mixed layer instability that depends on the mixed layer depth (MLD). During the winter, the MLD provides a much greater reservoir of the available potential energy, which promotes mixed layer instability to develop active submesoscale motions. The variations of MLD are likely modulated by the larger scale motions and the influxes of freshwater. Further investigations imply that the MLD and the stratified barrier layer are combined to determine the vertical structure of the submesoscale motions. The shallow MLD and strong stratification below during the summer and fall seem to prevent the downward extension of submesoscale motions. But in spring when the weak stratification exists, the penetration depth exceeds the base of the barrier layer.
Seasonal and spatial variations of kinematic parameters of internal solitary waves in the Andaman Sea
Yuqi Wu, Jieshuo Xie, Jiexin Xu, Zhiwu Chen, Yinghui He, Shuqun Cai
2022, 41(4): 14-22. doi: 10.1007/s13131-021-1854-7
Abstract:
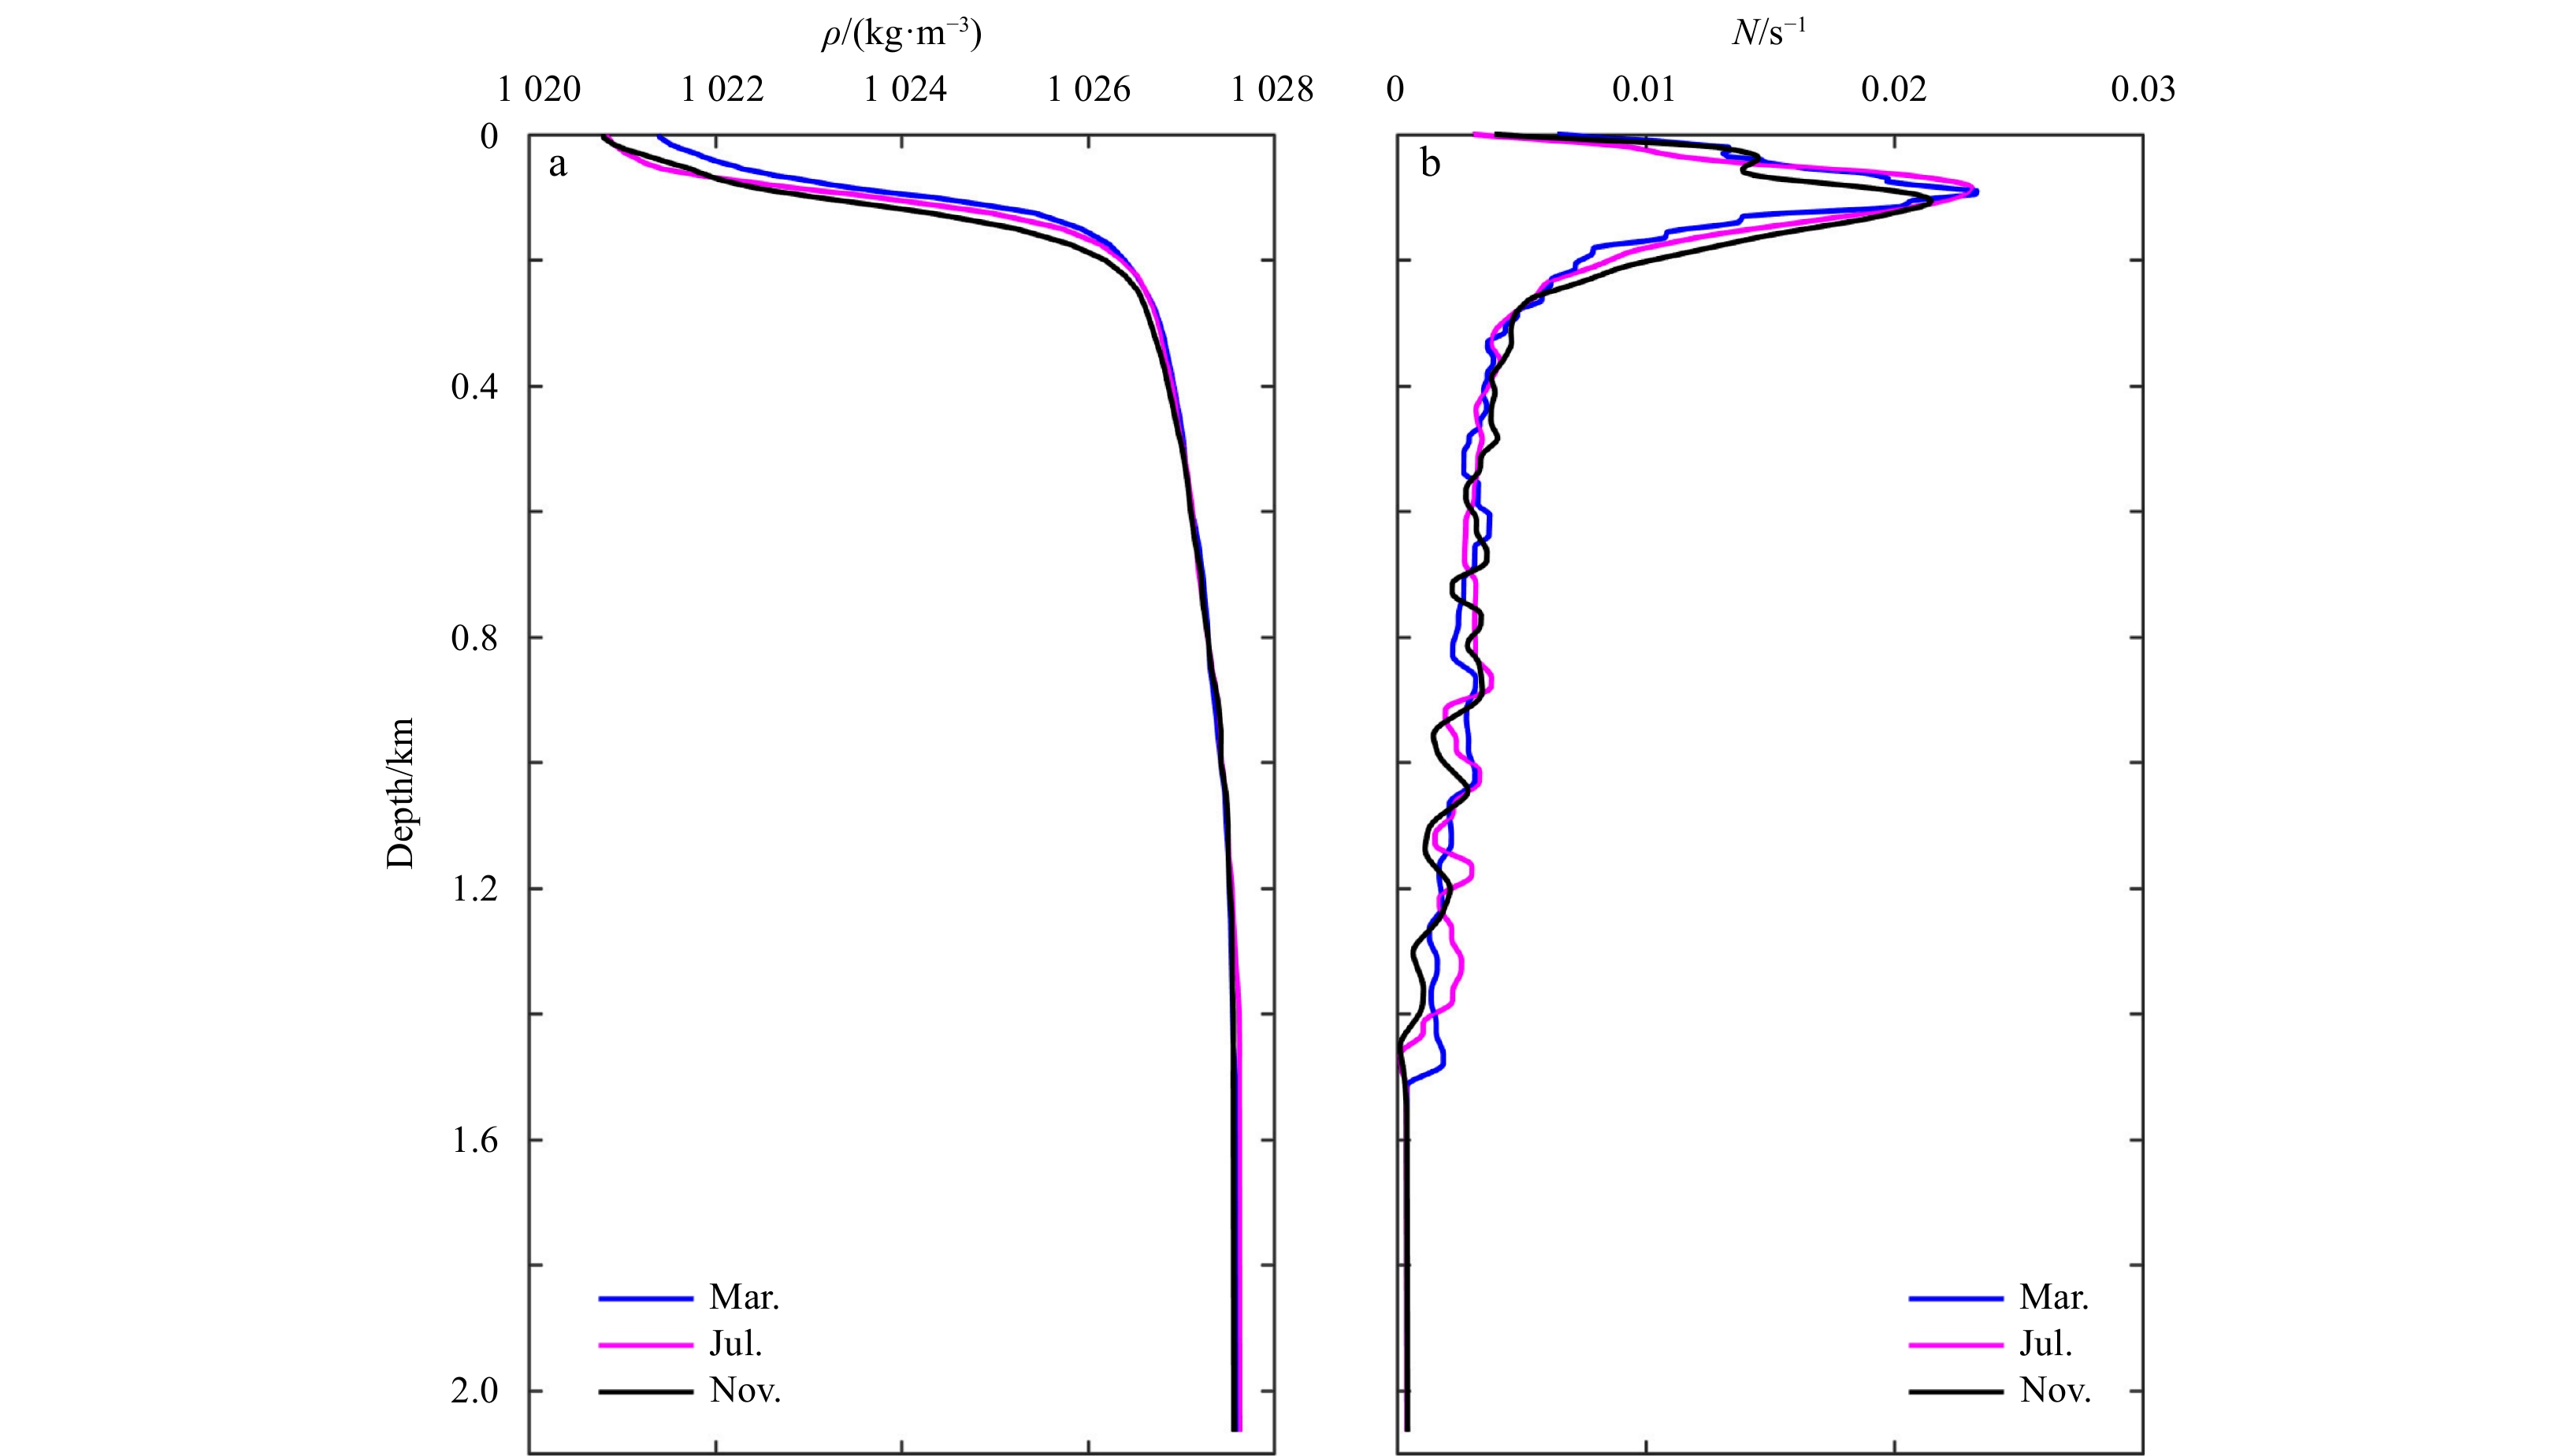
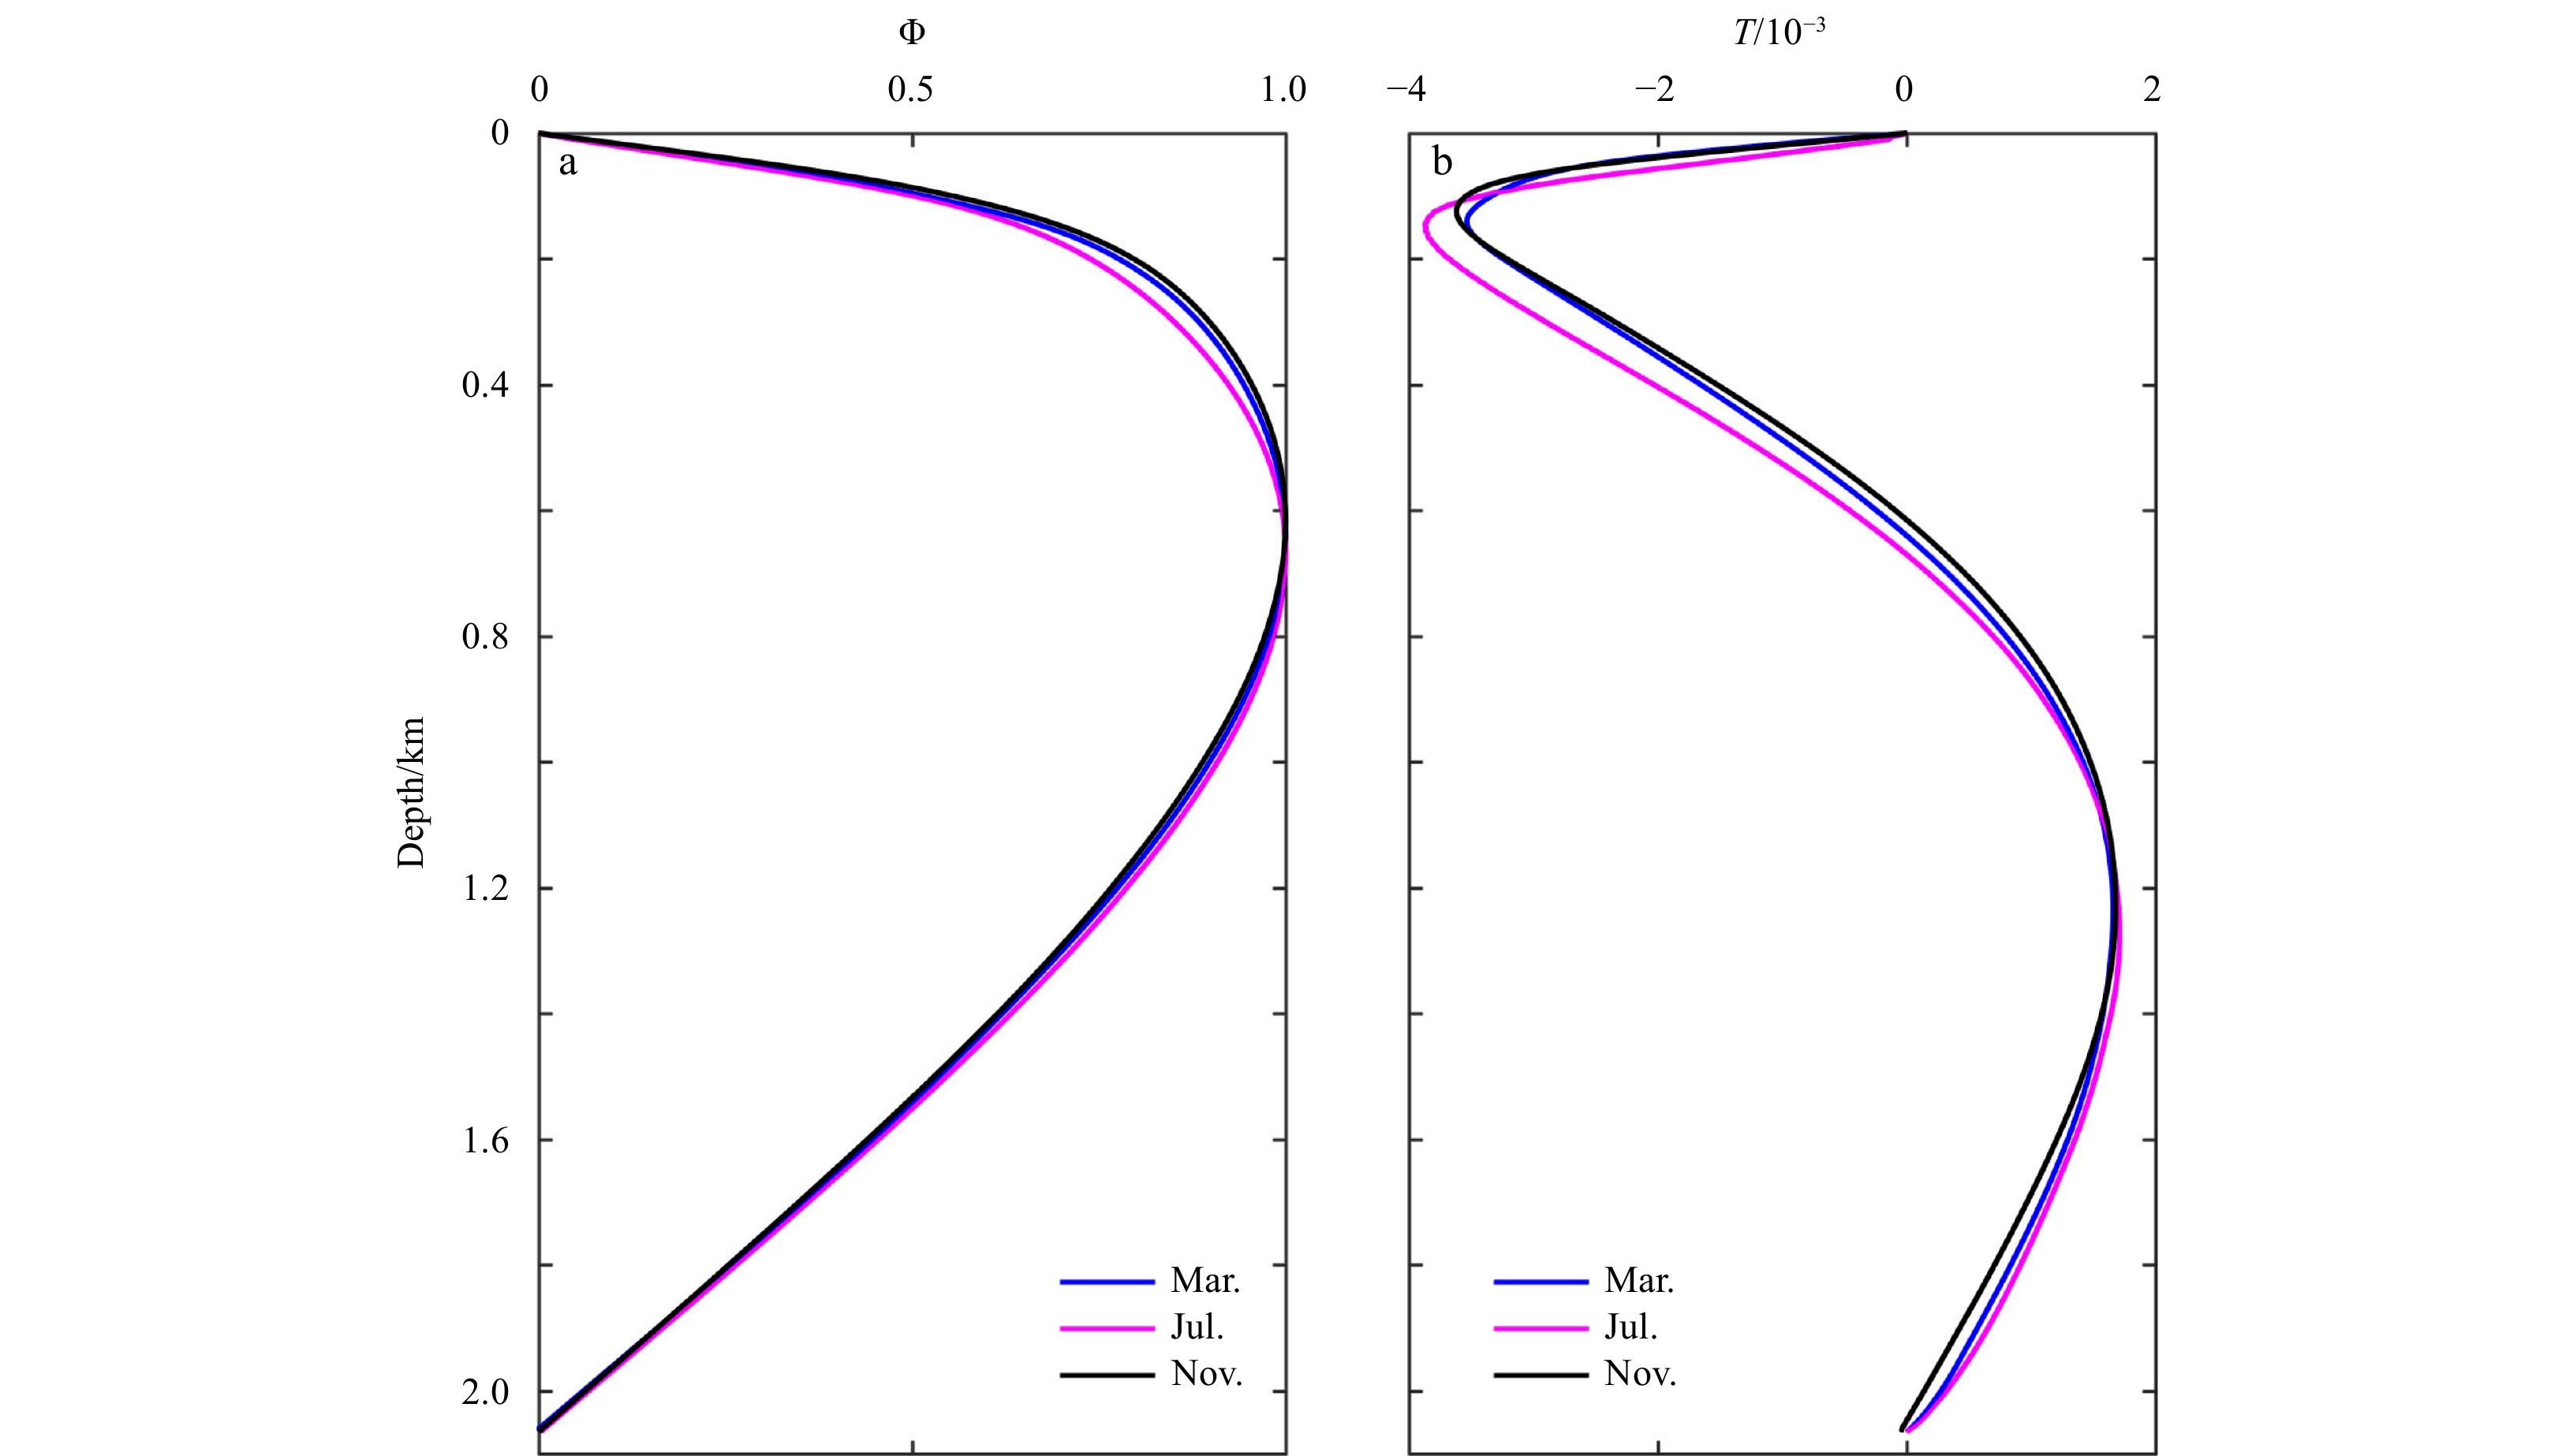
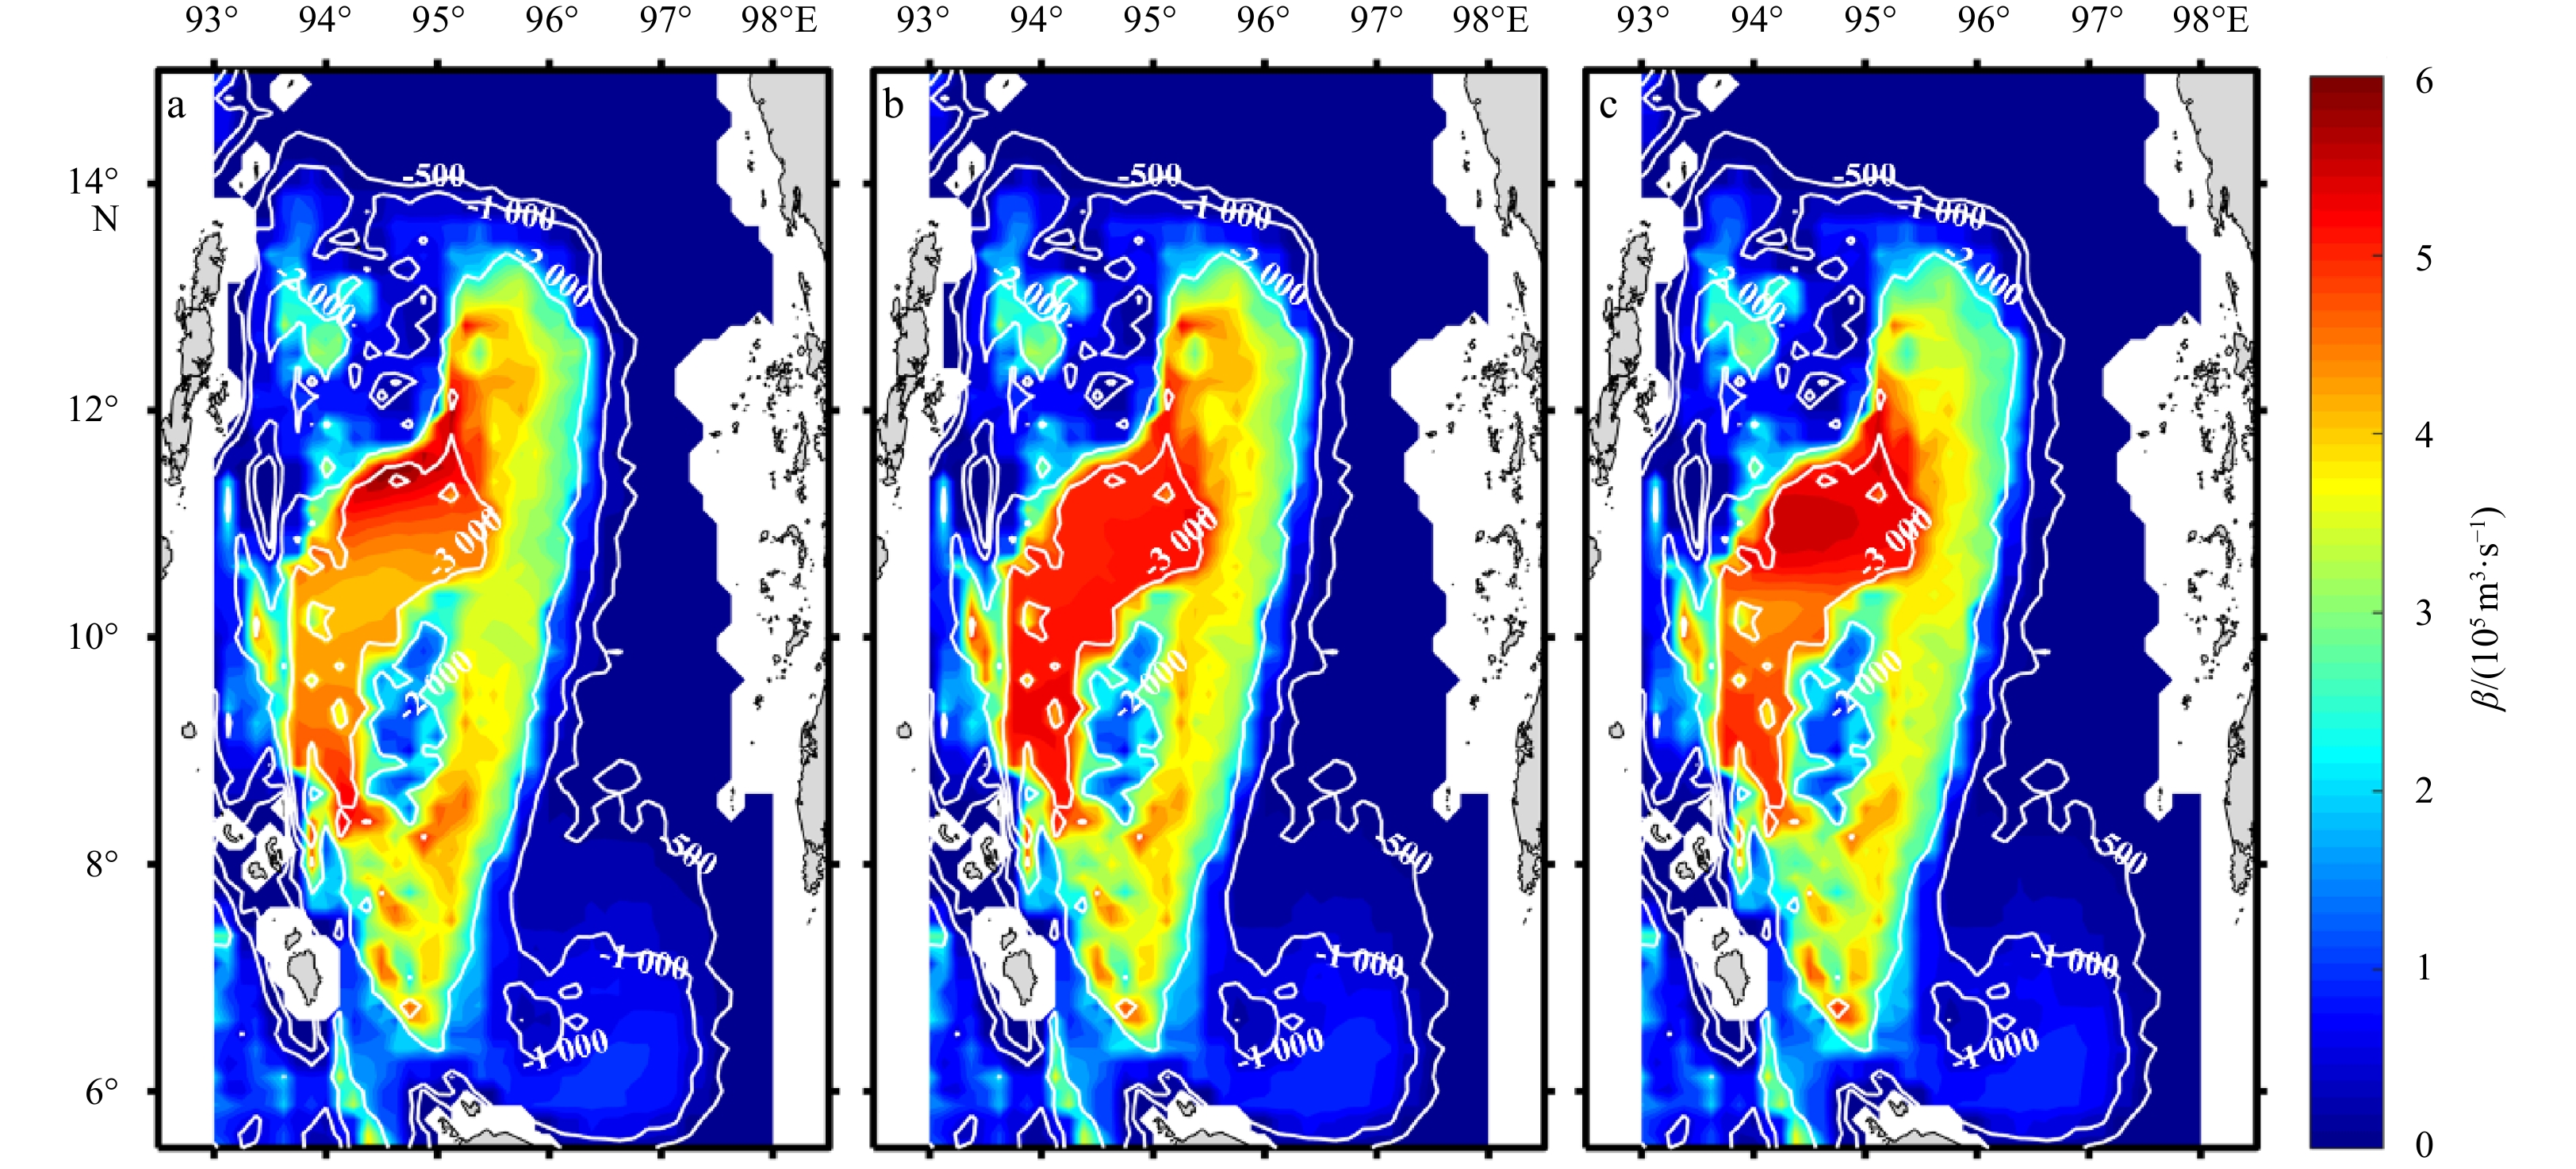
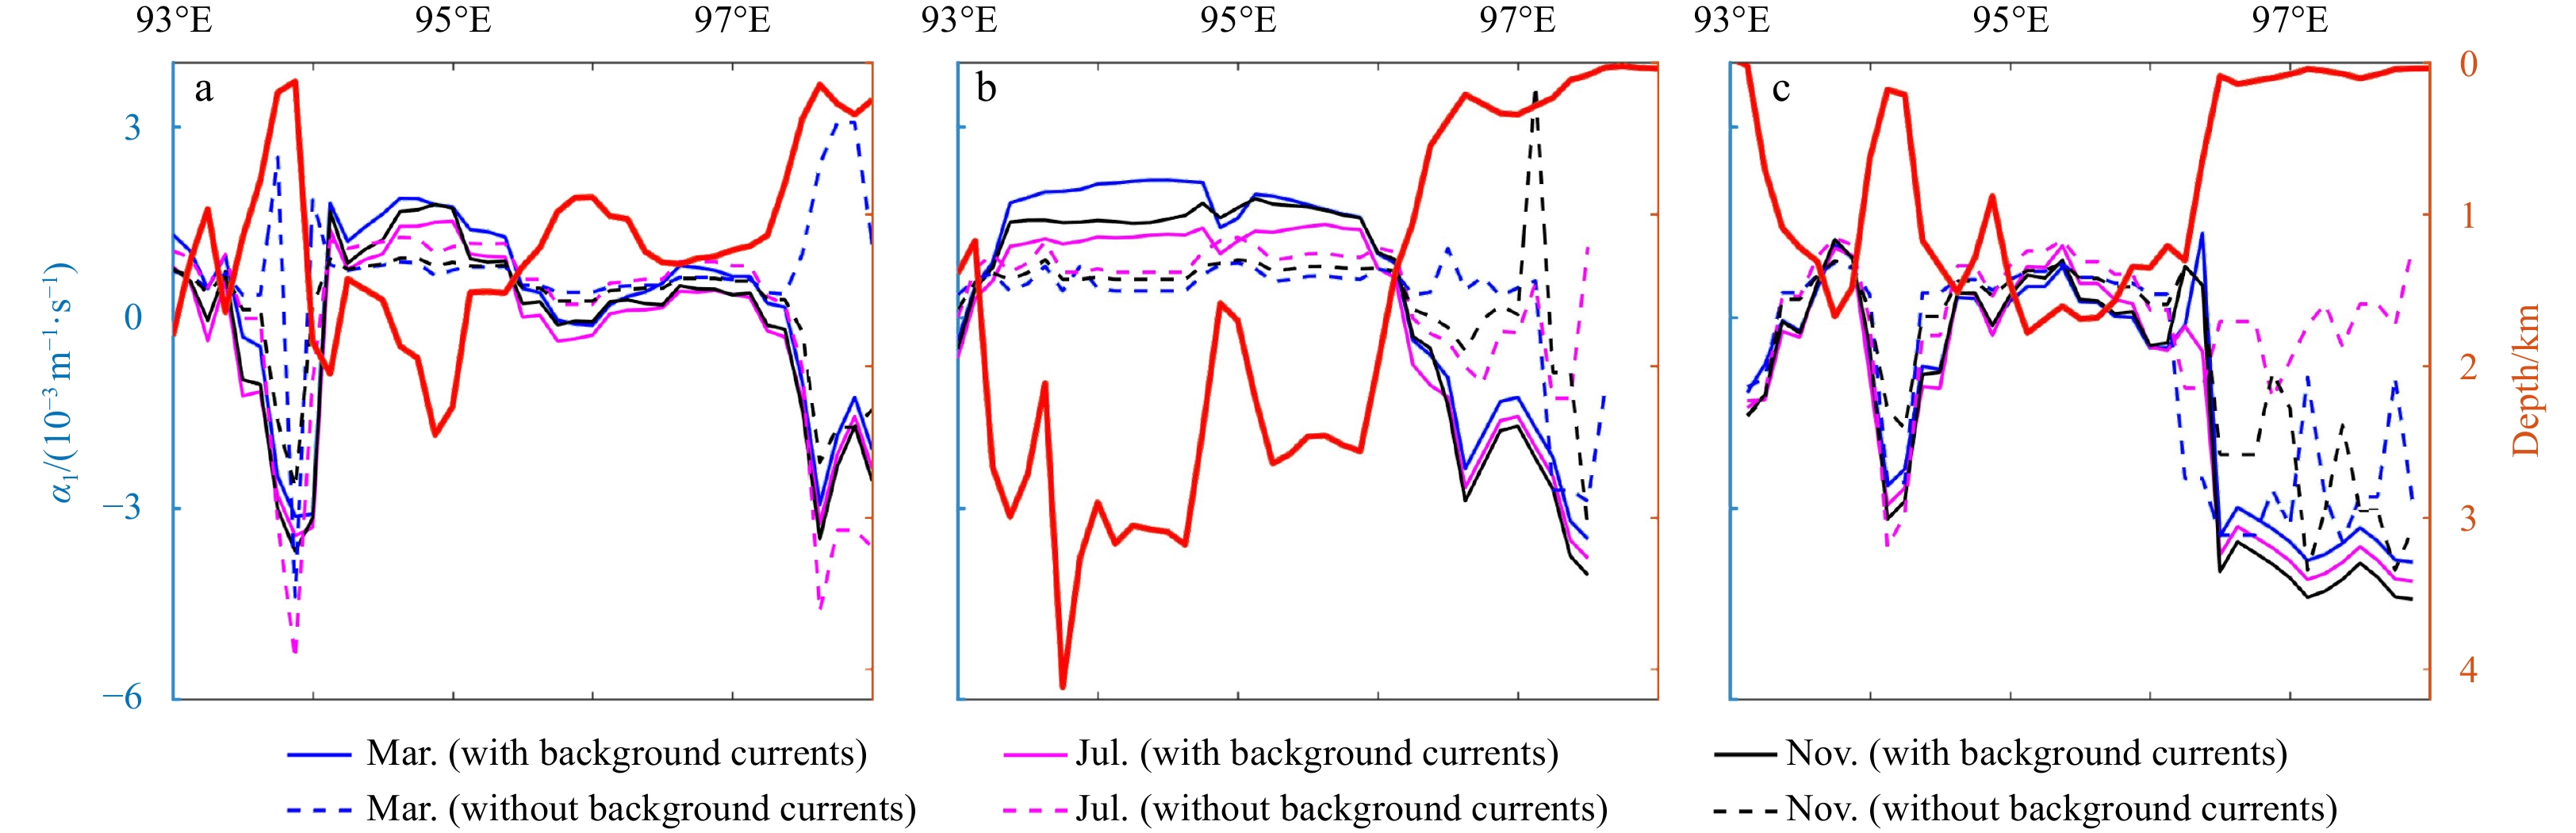
The horizontally variable density stratification and background currents are taken into the variable-coefficent extended Korteweg-de Vries (evKdV) theory to obtain the geographical and seasonal distribution of kinematic parameters of internal solitary waves in the Andaman Sea (AS). The kinematic parameters include phase speed, dispersion parameter, quadratic and cubic nonlinear parameters. It shows that the phase speed and dispersion parameter are mainly determined by the topographic feature and have limited seasonal variation. The maximum phase speed is 2.6 m/s, which occurs in the cool season (November) in the middle of the AS, while the phase speed in the cool season is slightly larger than those in other seasons, up to 11.4% larger than that in the rainy season (July) in the southern AS. The dispersion parameter in the cool season can be 22.3% larger than that in the hot season. The nonlinear parameters have significant seasonal variation, and they can even change their signs at the continental slope in the north of the AS, from season to season. Meanwhile, the algebraic solitons dominate in the AS with minimum amplitudes (aal) ranging from 0.1 m to 102 m, and the maximum aal occurs in the cool season in the southern AS. The effect of the background flow on the parameters is also studied. The background flow has a great influence on the nonlinear parameters, e.g., the value of cubic nonlinear parameter can be reduced by 1/3 when the background flow is not considered.
Spatiotemporal variation and mechanisms of temperature inversion in the Bay of Bengal and the eastern equatorial Indian Ocean
K M Azam Chowdhury, Wensheng Jiang, Guimei Liu, Md Kawser Ahmed, Shaila Akhter
2022, 41(4): 23-39. doi: 10.1007/s13131-021-1873-4
Abstract:
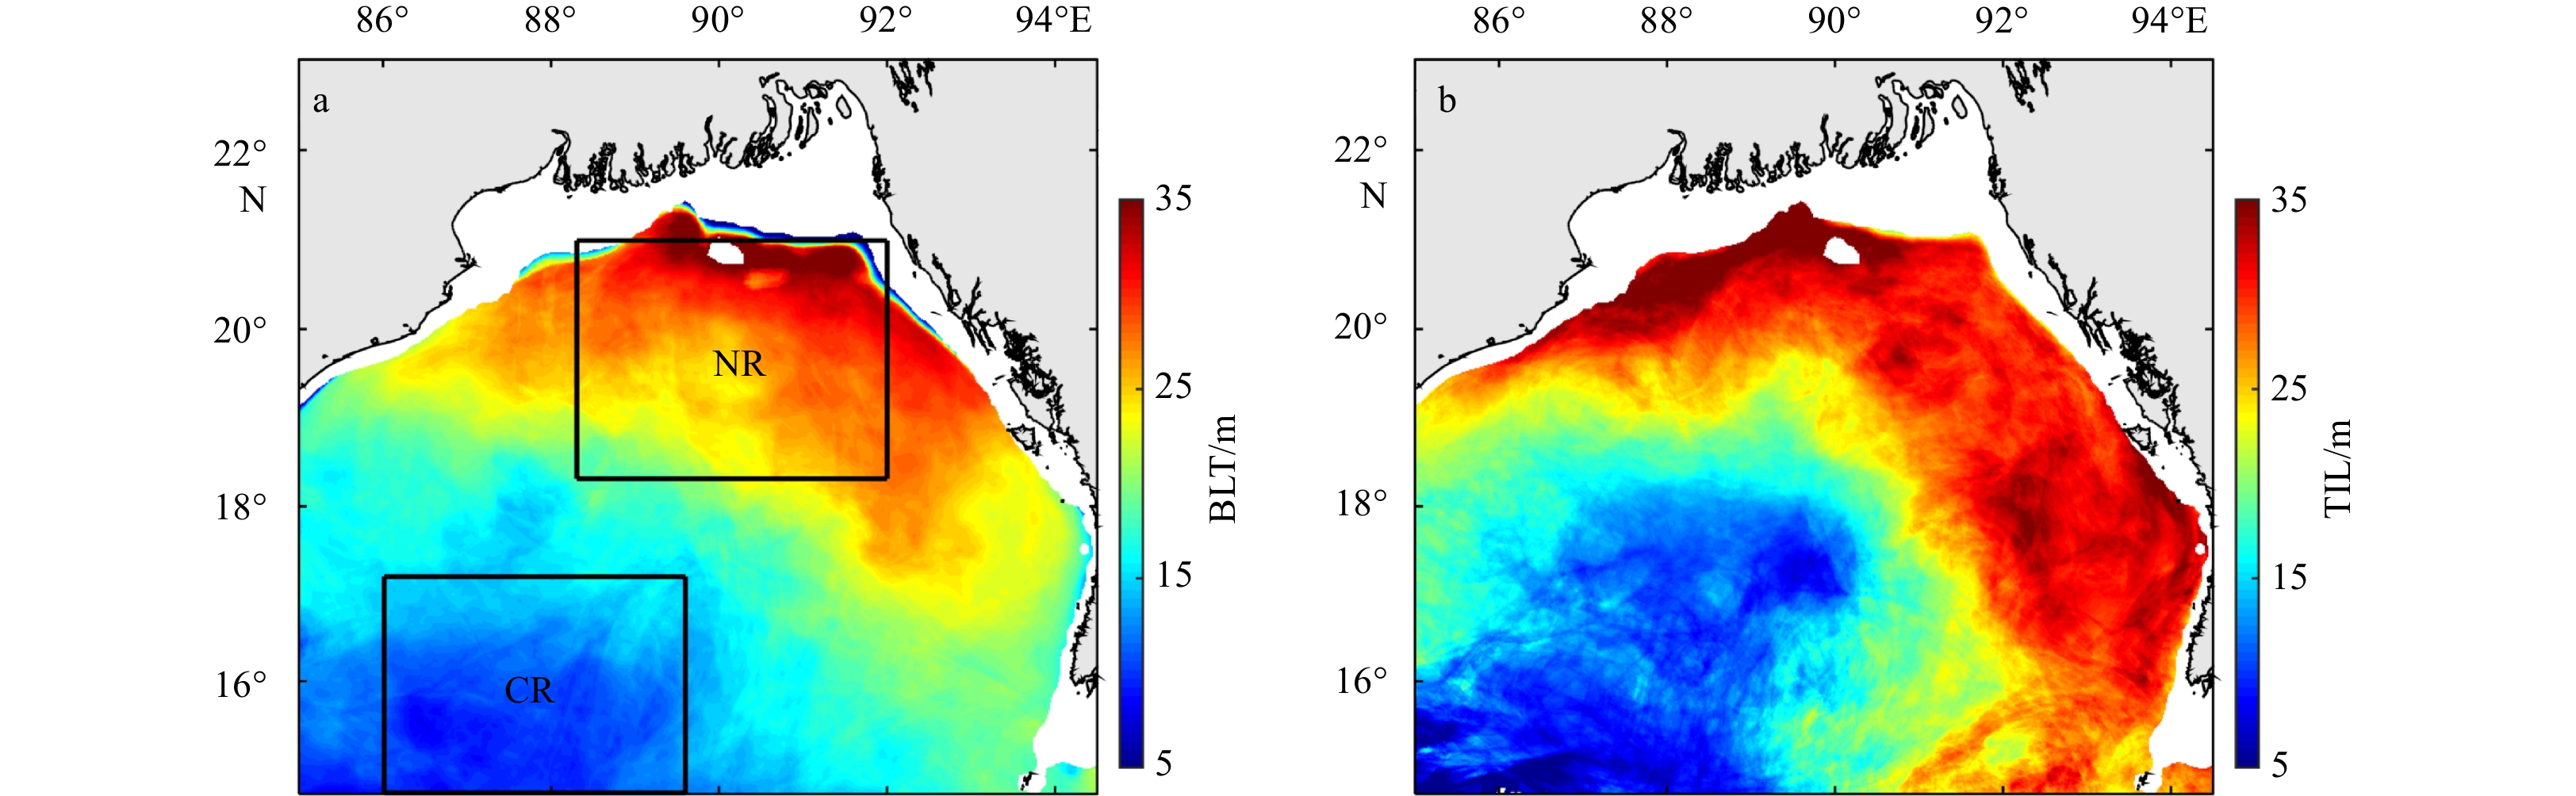
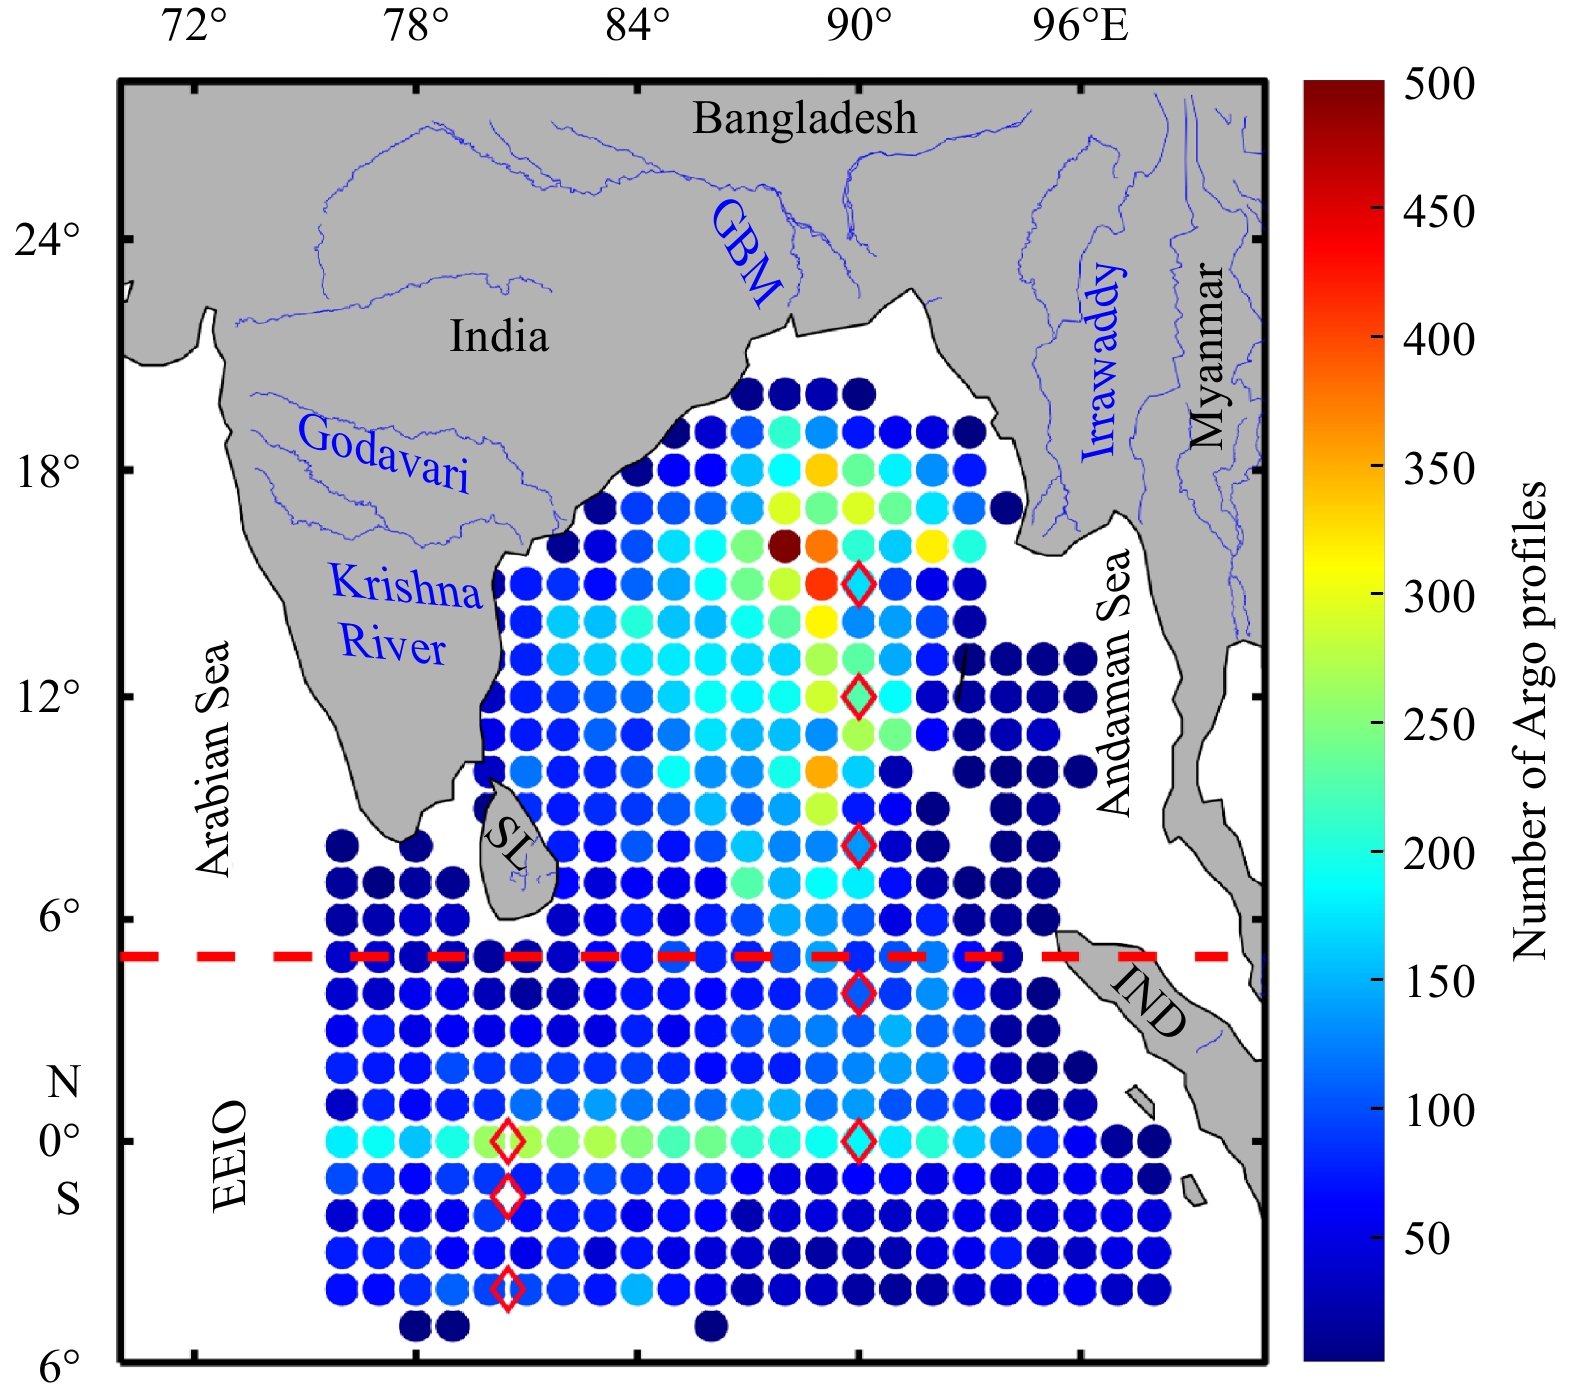
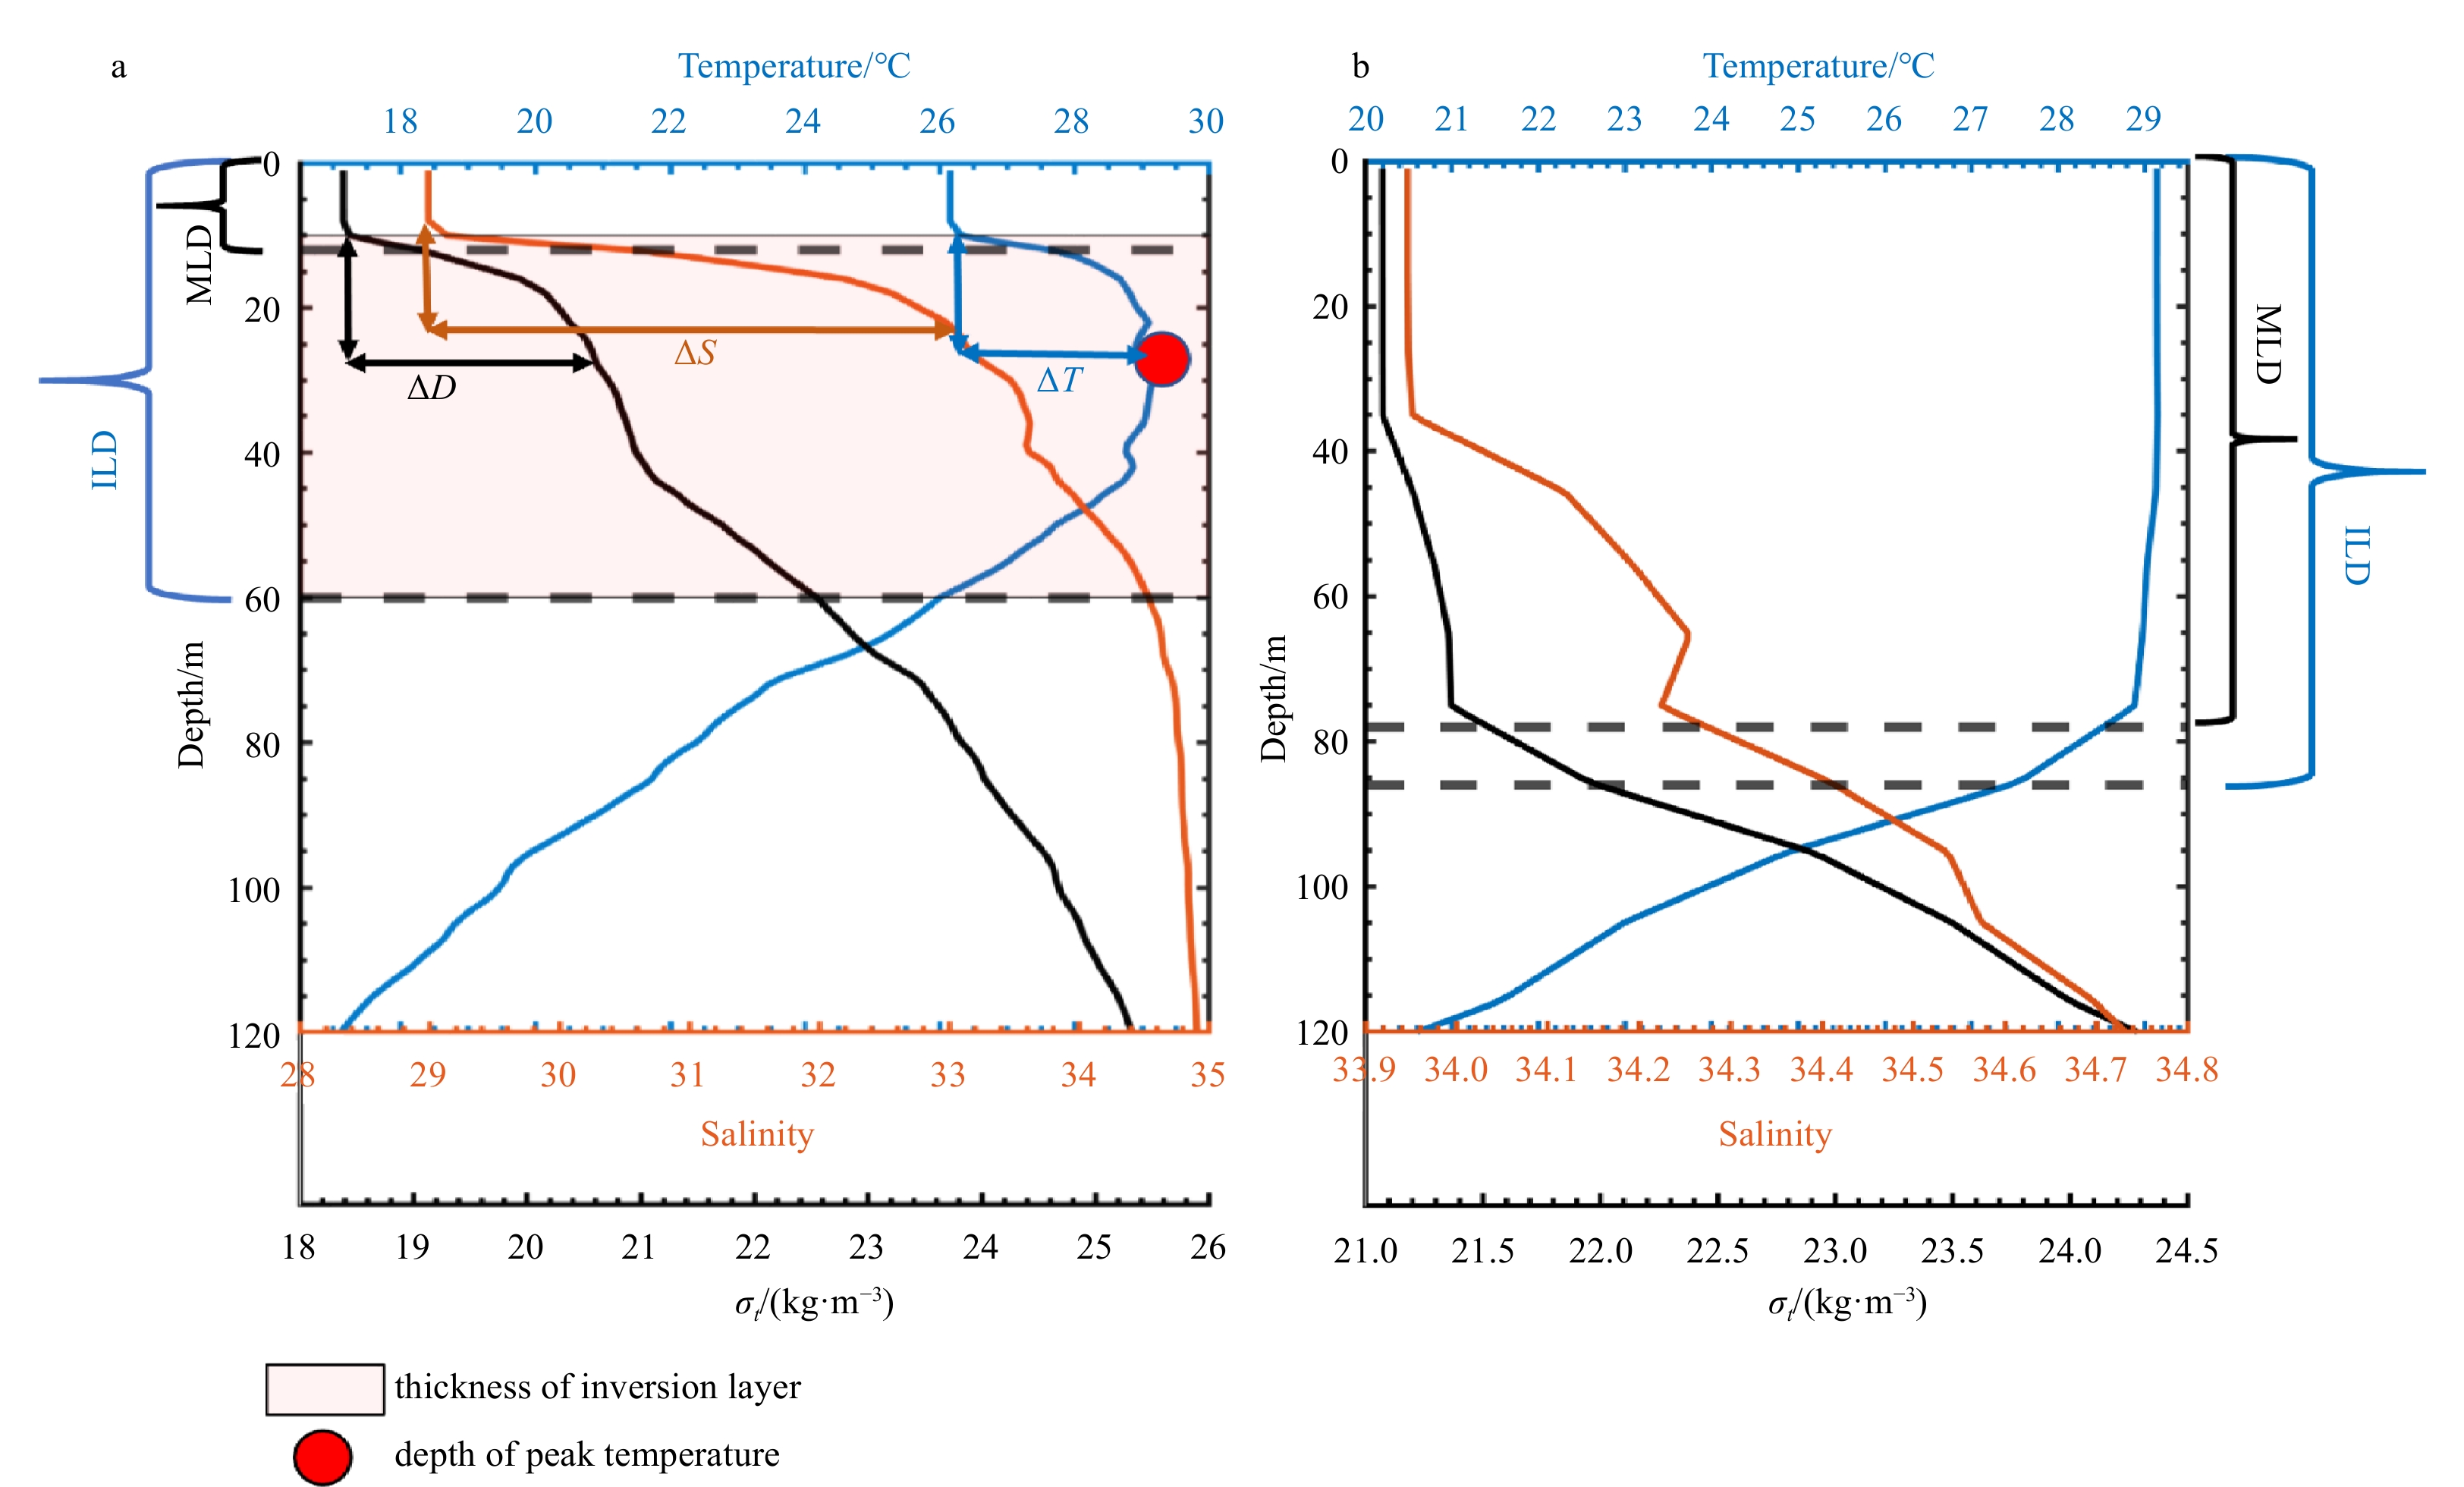
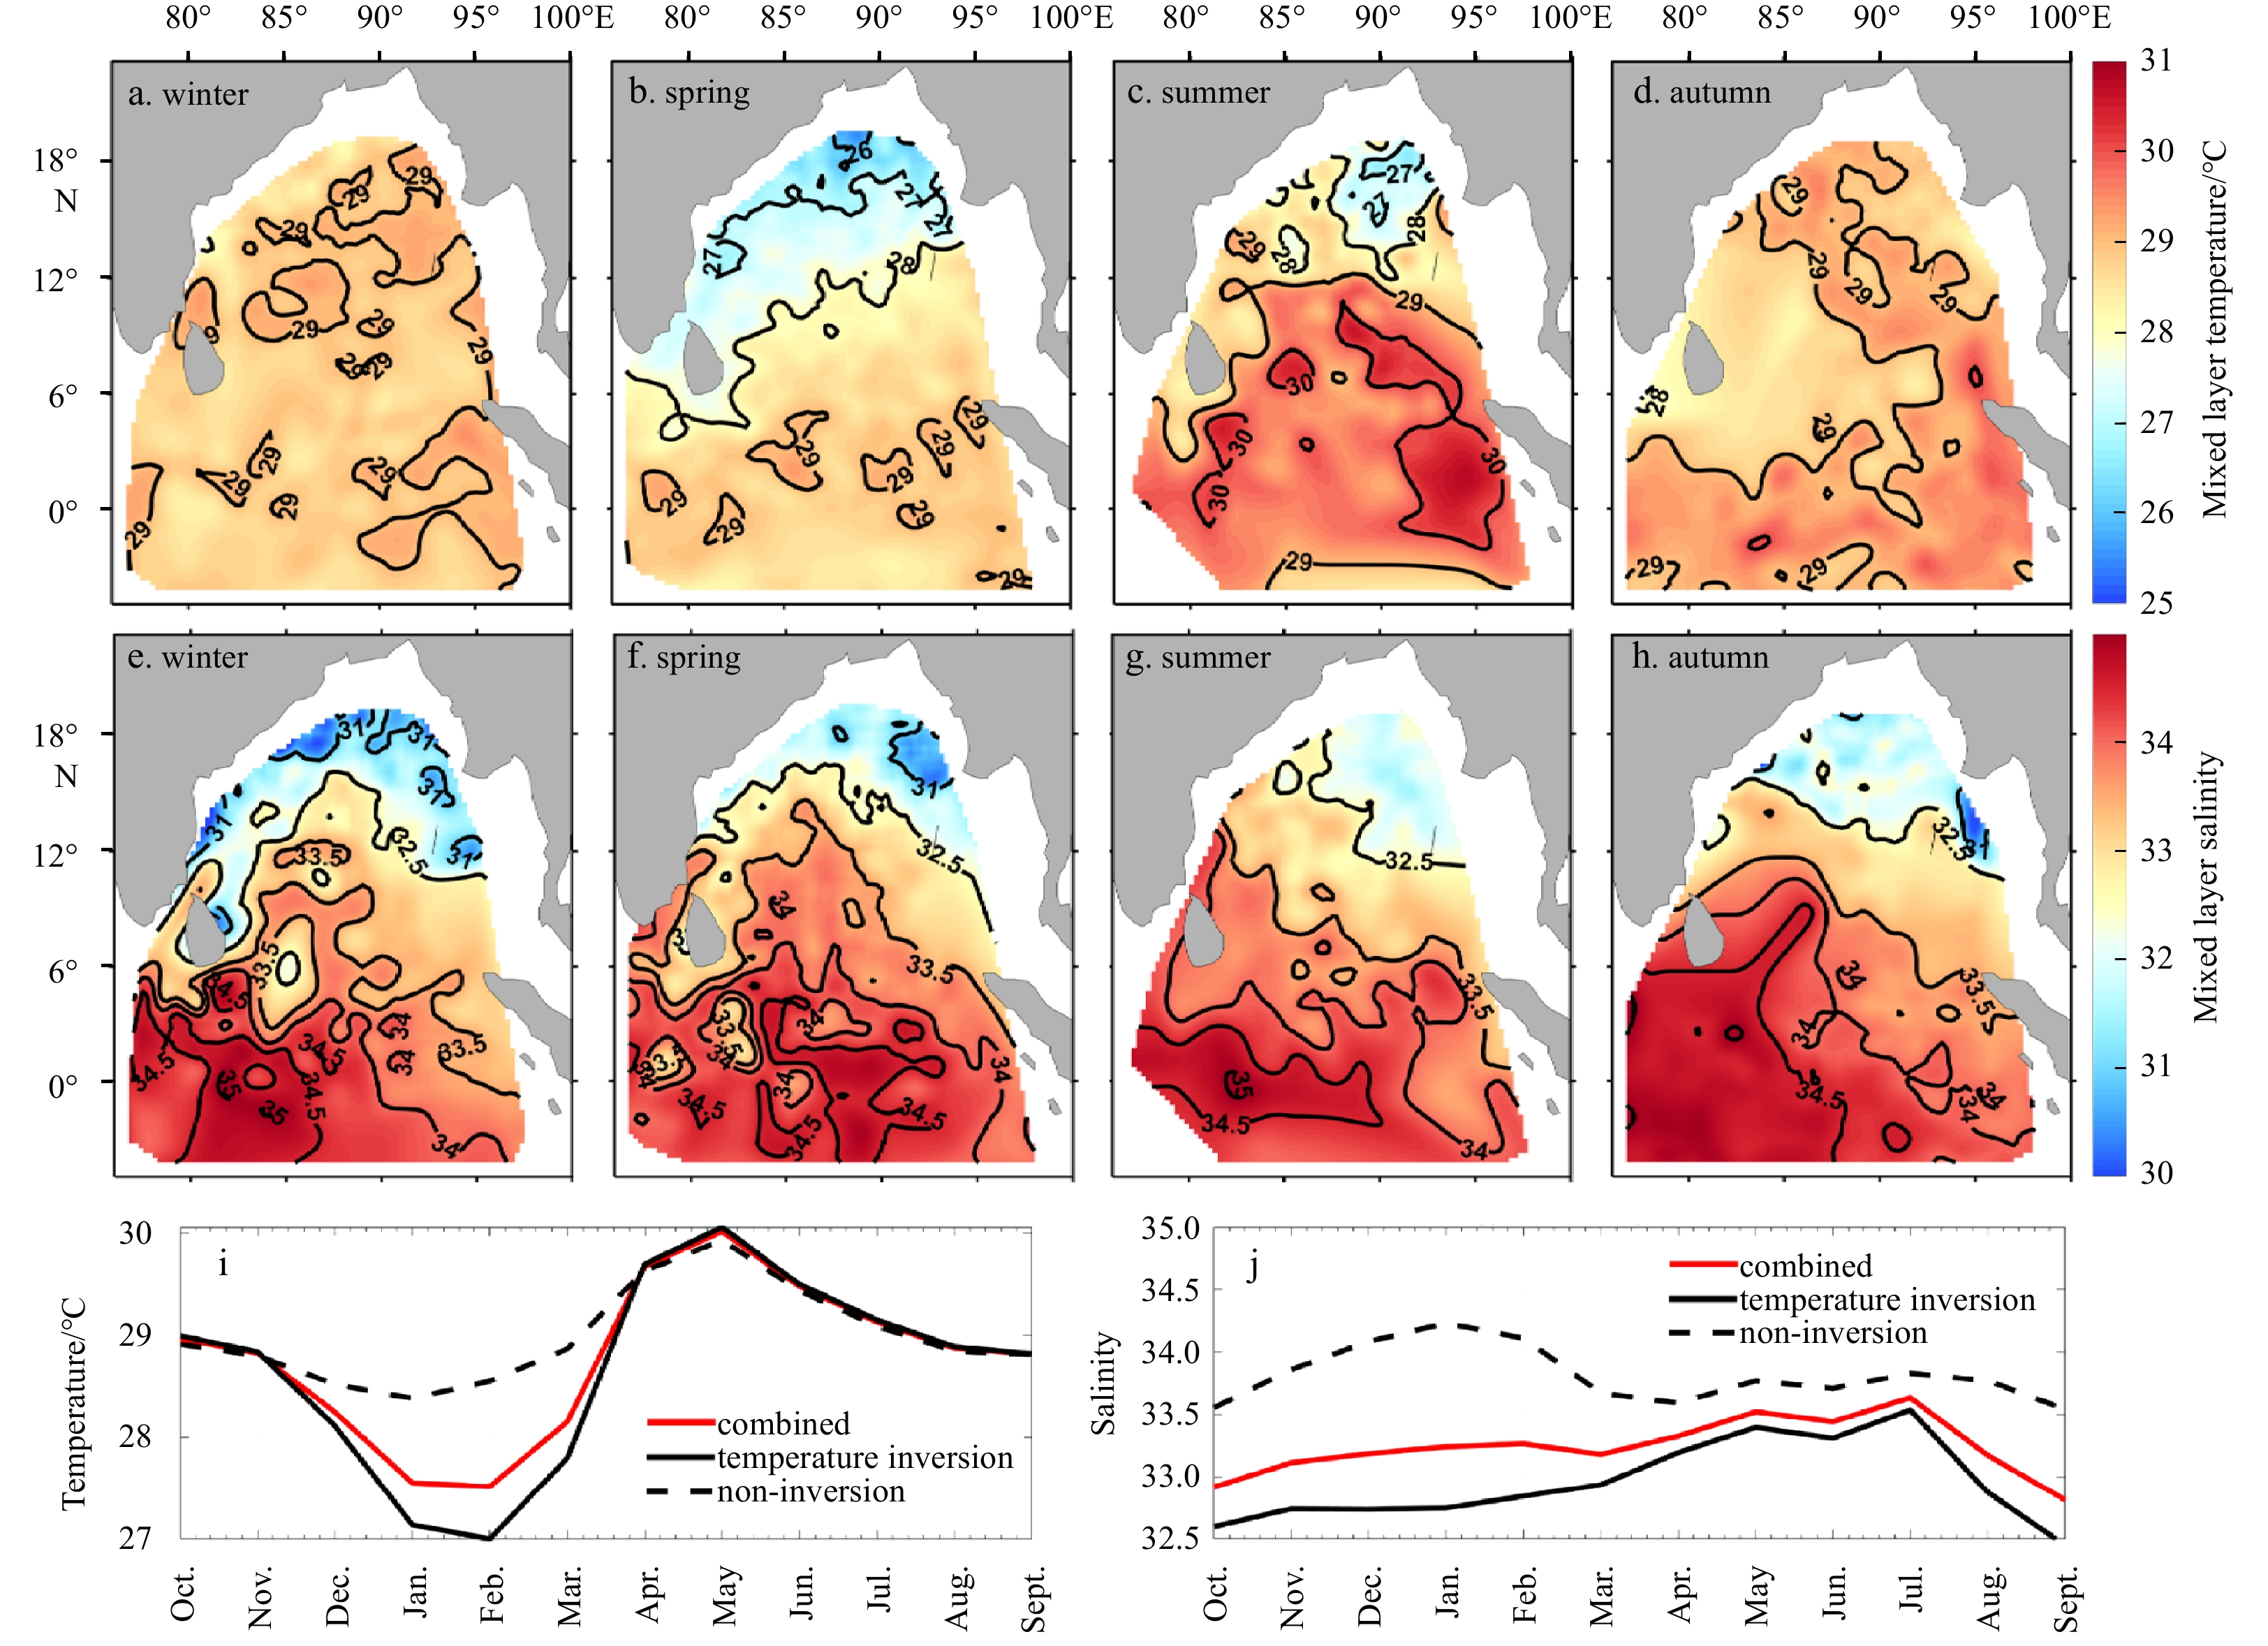
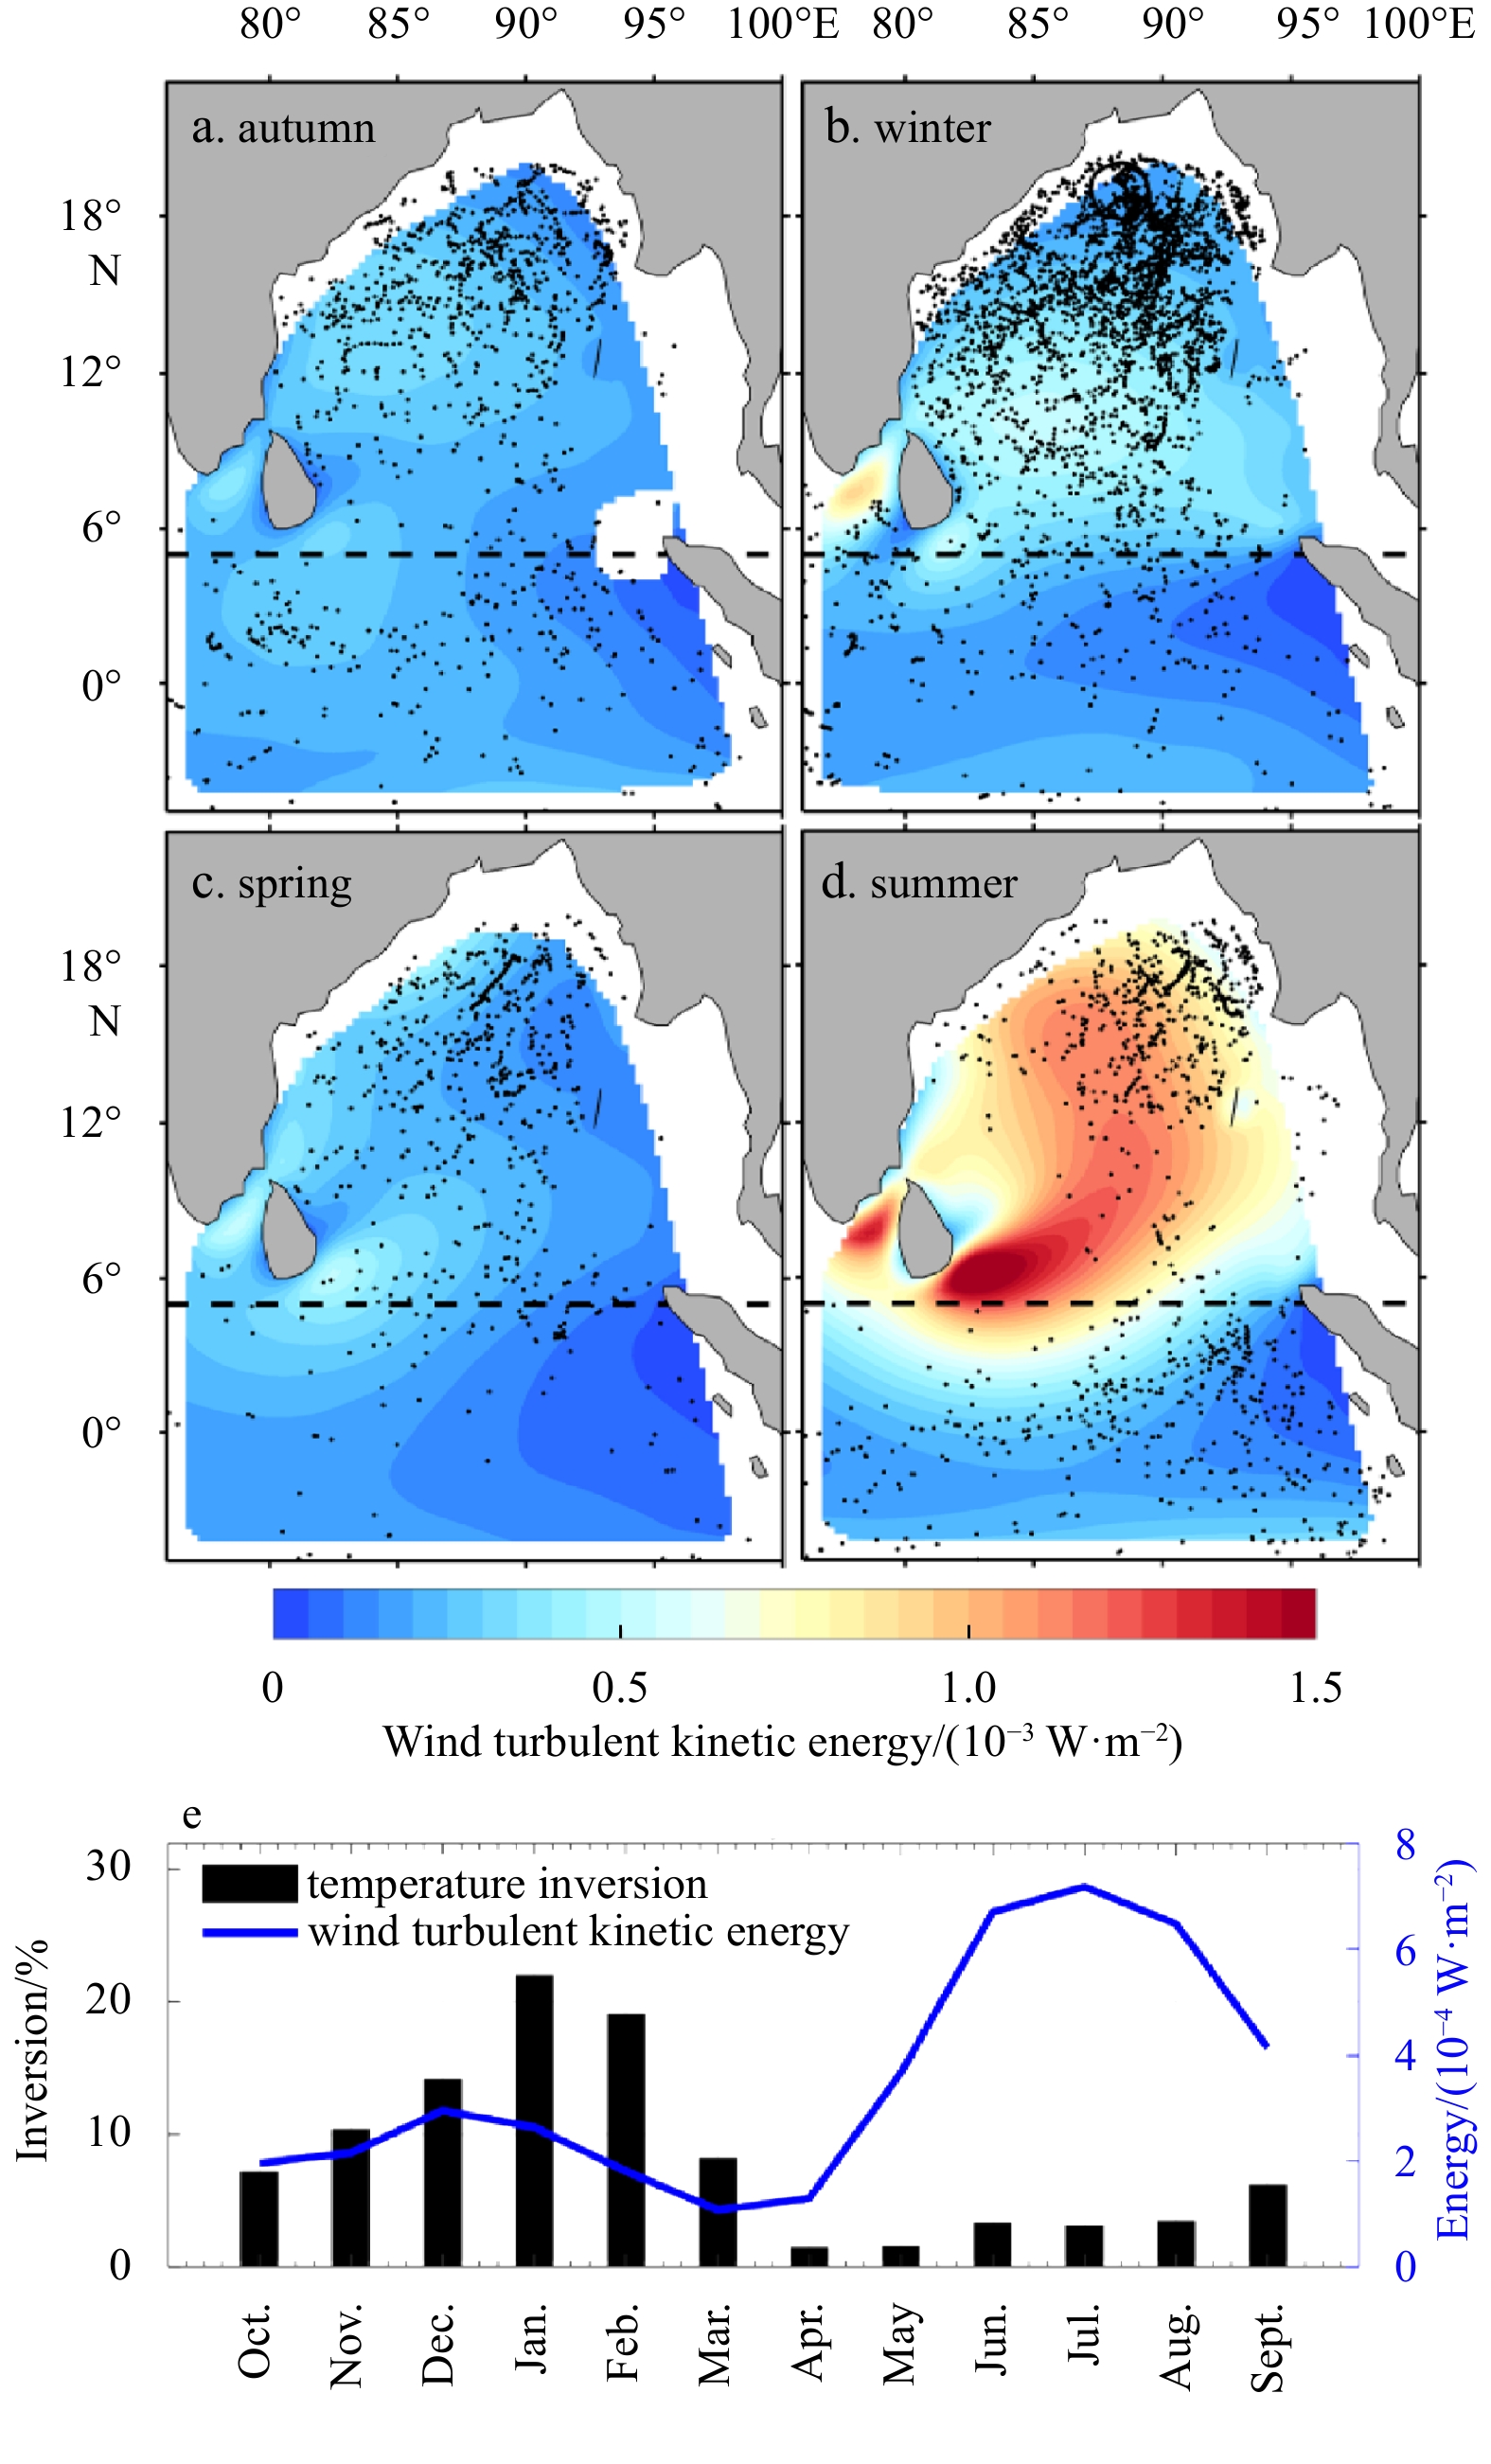
In the northern Bay of Bengal, the existence of intense temperature inversion during winter is a widely accepted phenomenon. However, occurrences of temperature inversion during other seasons and the spatial distribution within and adjacent to the Bay of Bengal are not well understood. In this study, a higher resolution spatiotemporal variation of temperature inversion and its mechanisms are examined with mixed layer heat and salt budget analysis utilizing long-term Argo (2004 to 2020) and RAMA (2007 to 2020) profiles data in the Bay of Bengal and eastern equatorial Indian Ocean (EEIO). Temperature inversion exists (17.5% of the total 39 293 Argo and 51.6% of the 28 894 RAMA profiles) throughout the year in the entire study area. It shows strong seasonal variation, with the highest occurrences in winter and the lowest in spring. Besides winter inversion in the northern Bay of Bengal, two other regions with frequent temperature inversion are identified in this study for the first time: the northeastern part of the Bay of Bengal and the eastern part of the EEIO during summer and autumn. Driving processes of temperature inversion for different subregions are revealed in the current study. Penetration of heat (mean ~25 W/m2) below the haline-stratified shallow mixed layer leads to a relatively warmer subsurface layer along with the simultaneous cooling tendency in mixed layer, which controls more occurrence of temperature inversion in the northern Bay of Bengal throughout the year. Comparatively lower cooling tendency due to net surface heat loss and higher mixed layer salinity leaves the southern part of the bay less supportive to the formation of temperature inversion than the northern bay. In the EEIO, slightly cooling tendency in the mixed layer along with the subduction of warm-salty Arabian Sea water beneath the cold-fresher Bay of Bengal water, and downwelling of thermocline creates a favorable environment for forming temperature inversion mainly during summer and autumn. Deeper isothermal layer depth, and thicker barrier layer thickness intensify the temperature inversion both in the Bay of Bengal and EEIO.
Surface available gravitational potential energy in the world oceans
Ruixin Huang, Bo Qiu, Zhiyou Jing
2022, 41(4): 40-56. doi: 10.1007/s13131-021-1852-9
Abstract:
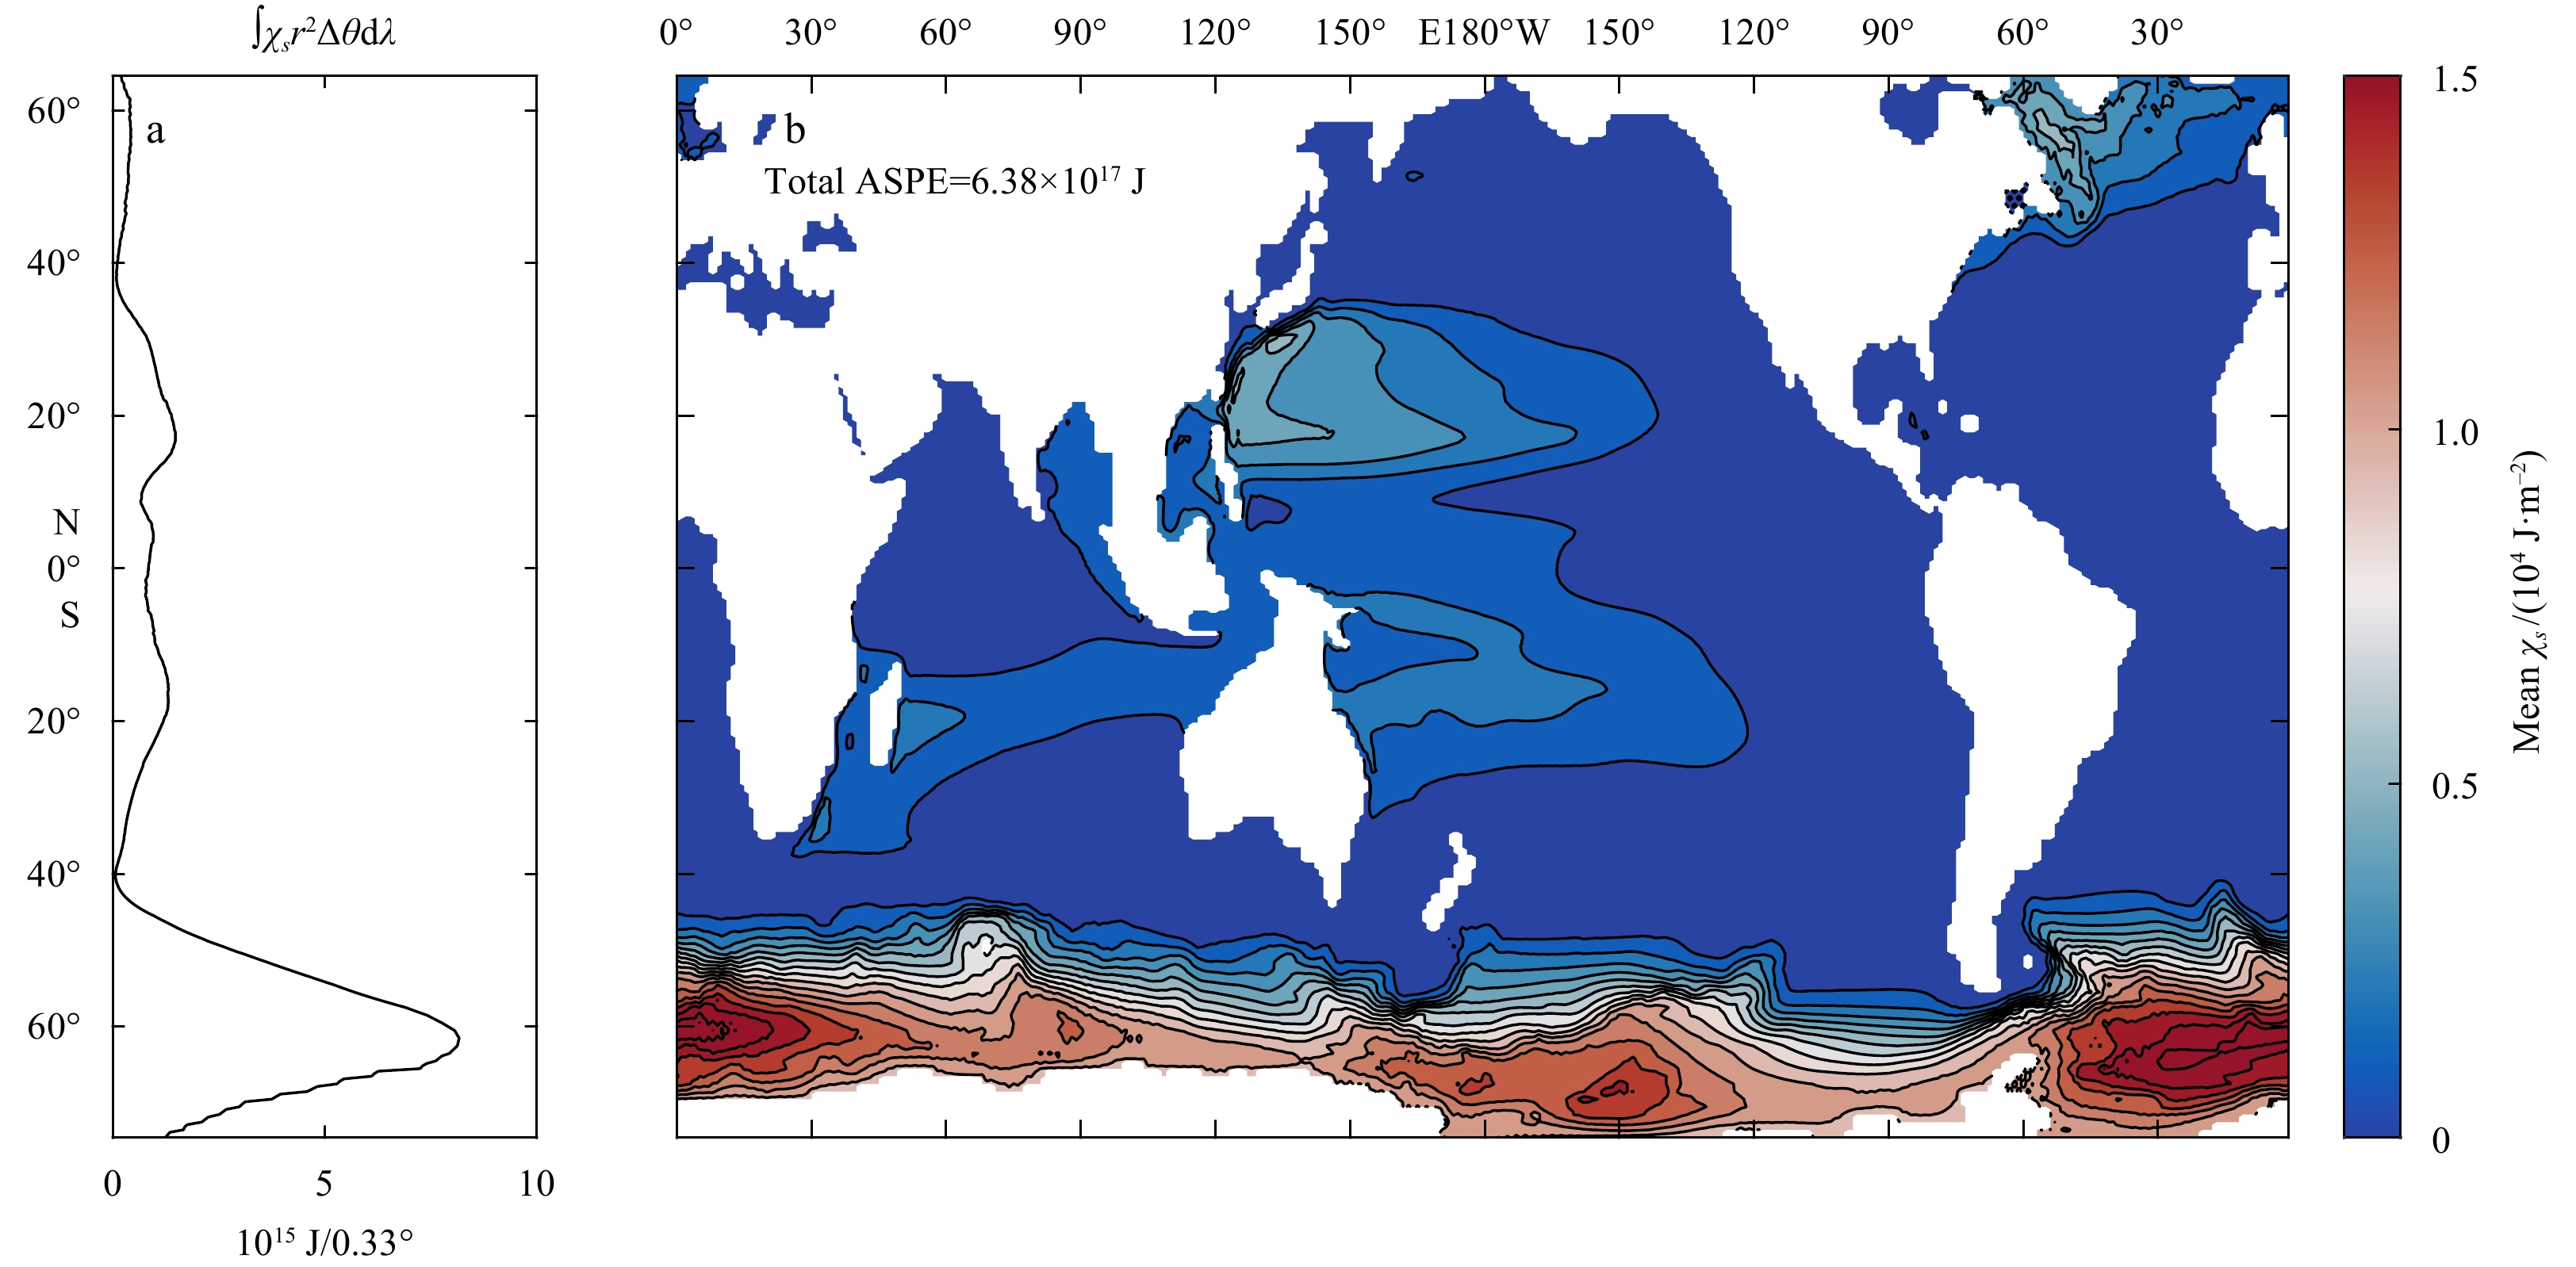
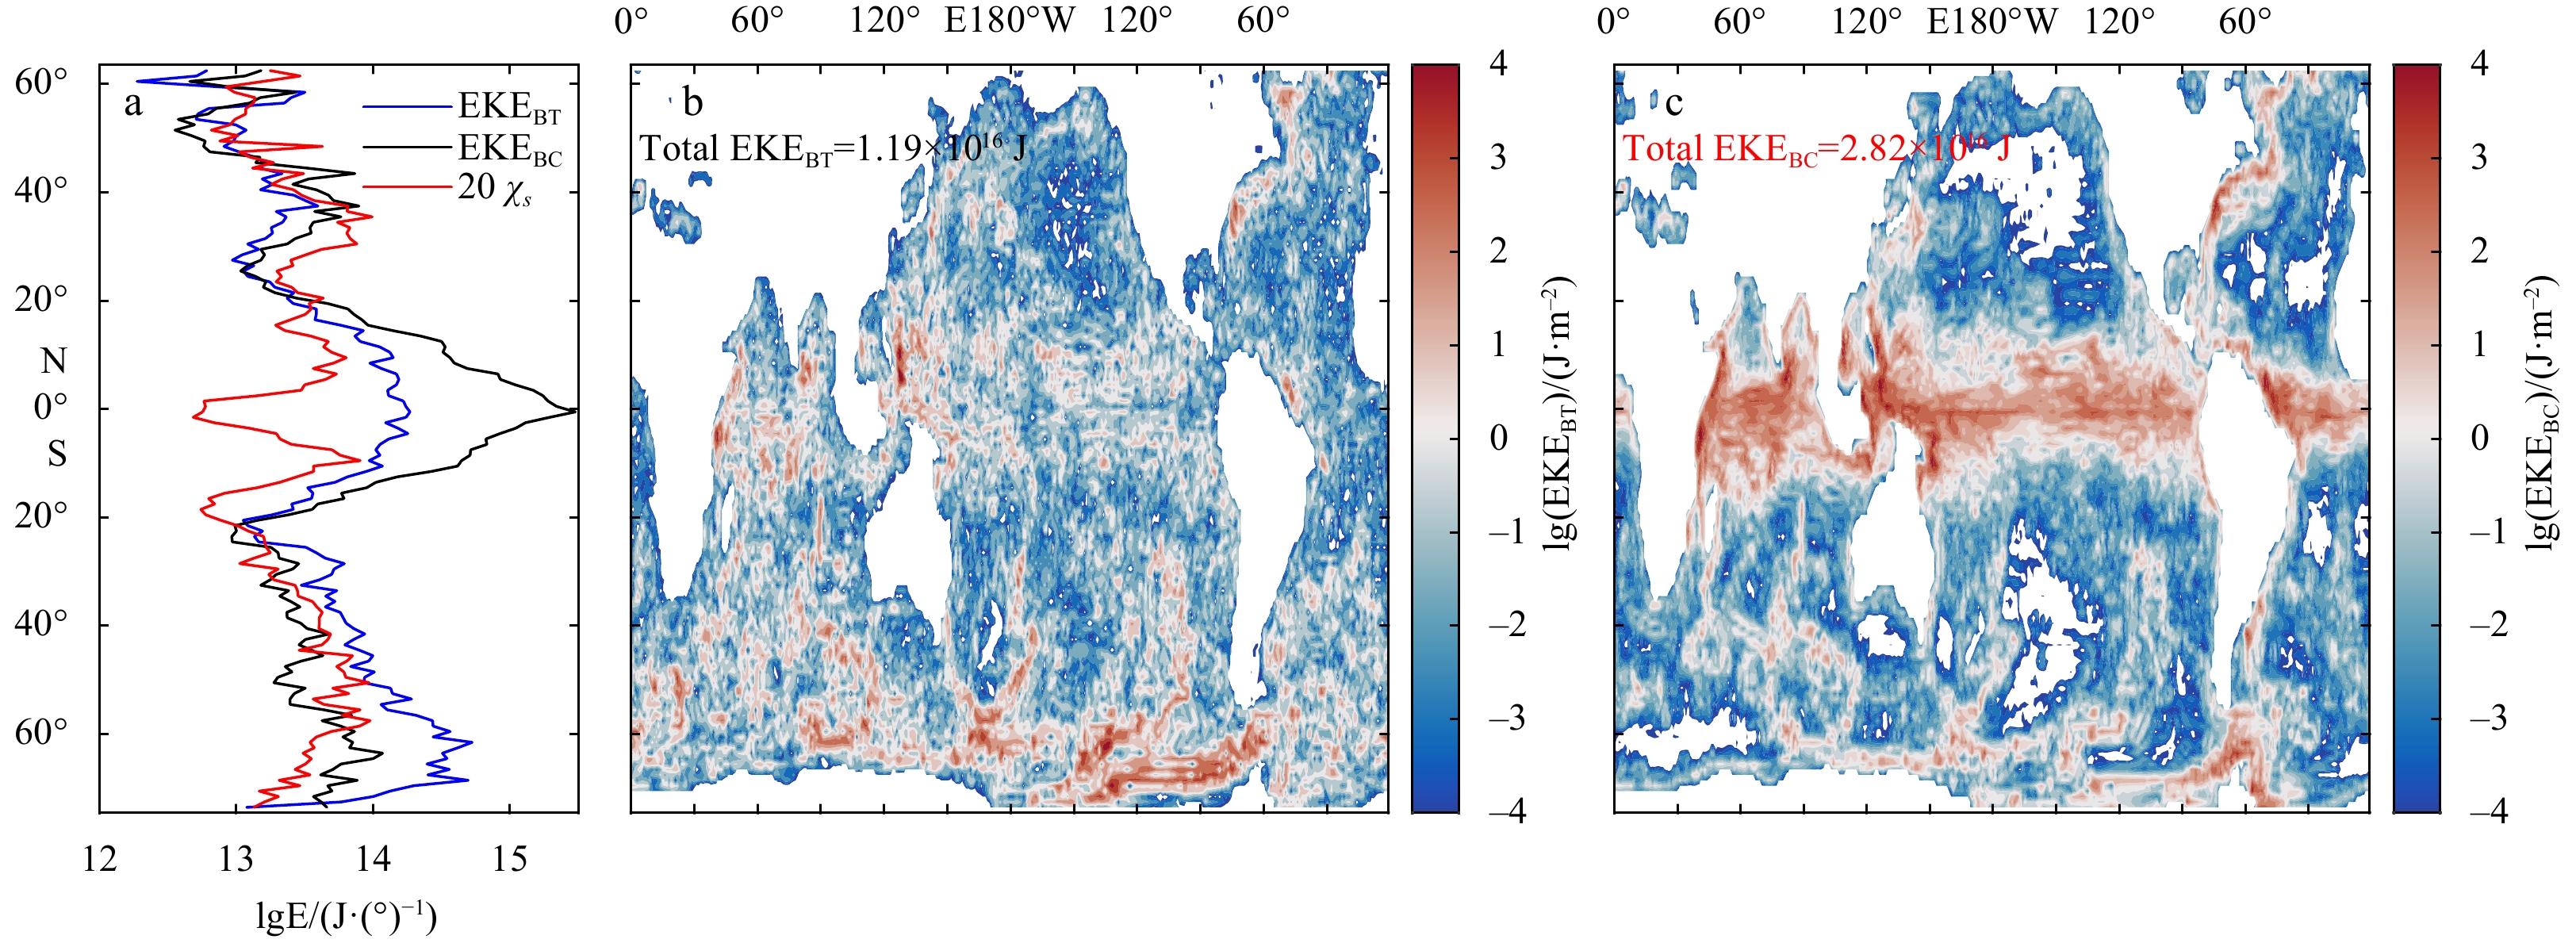
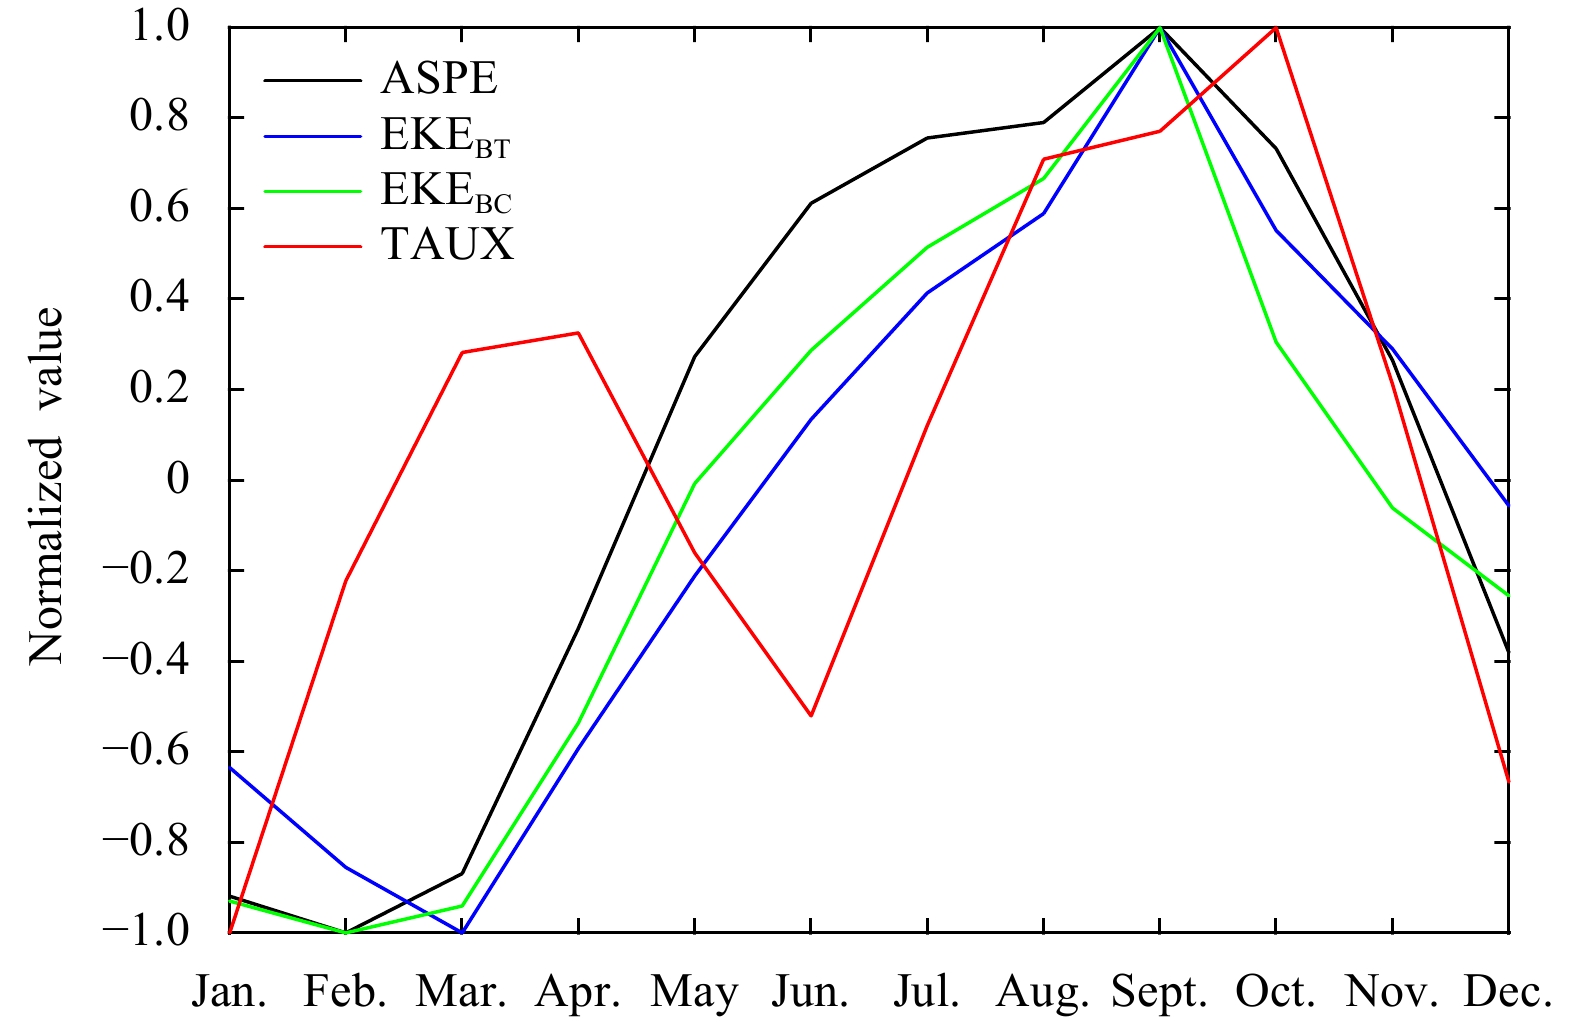
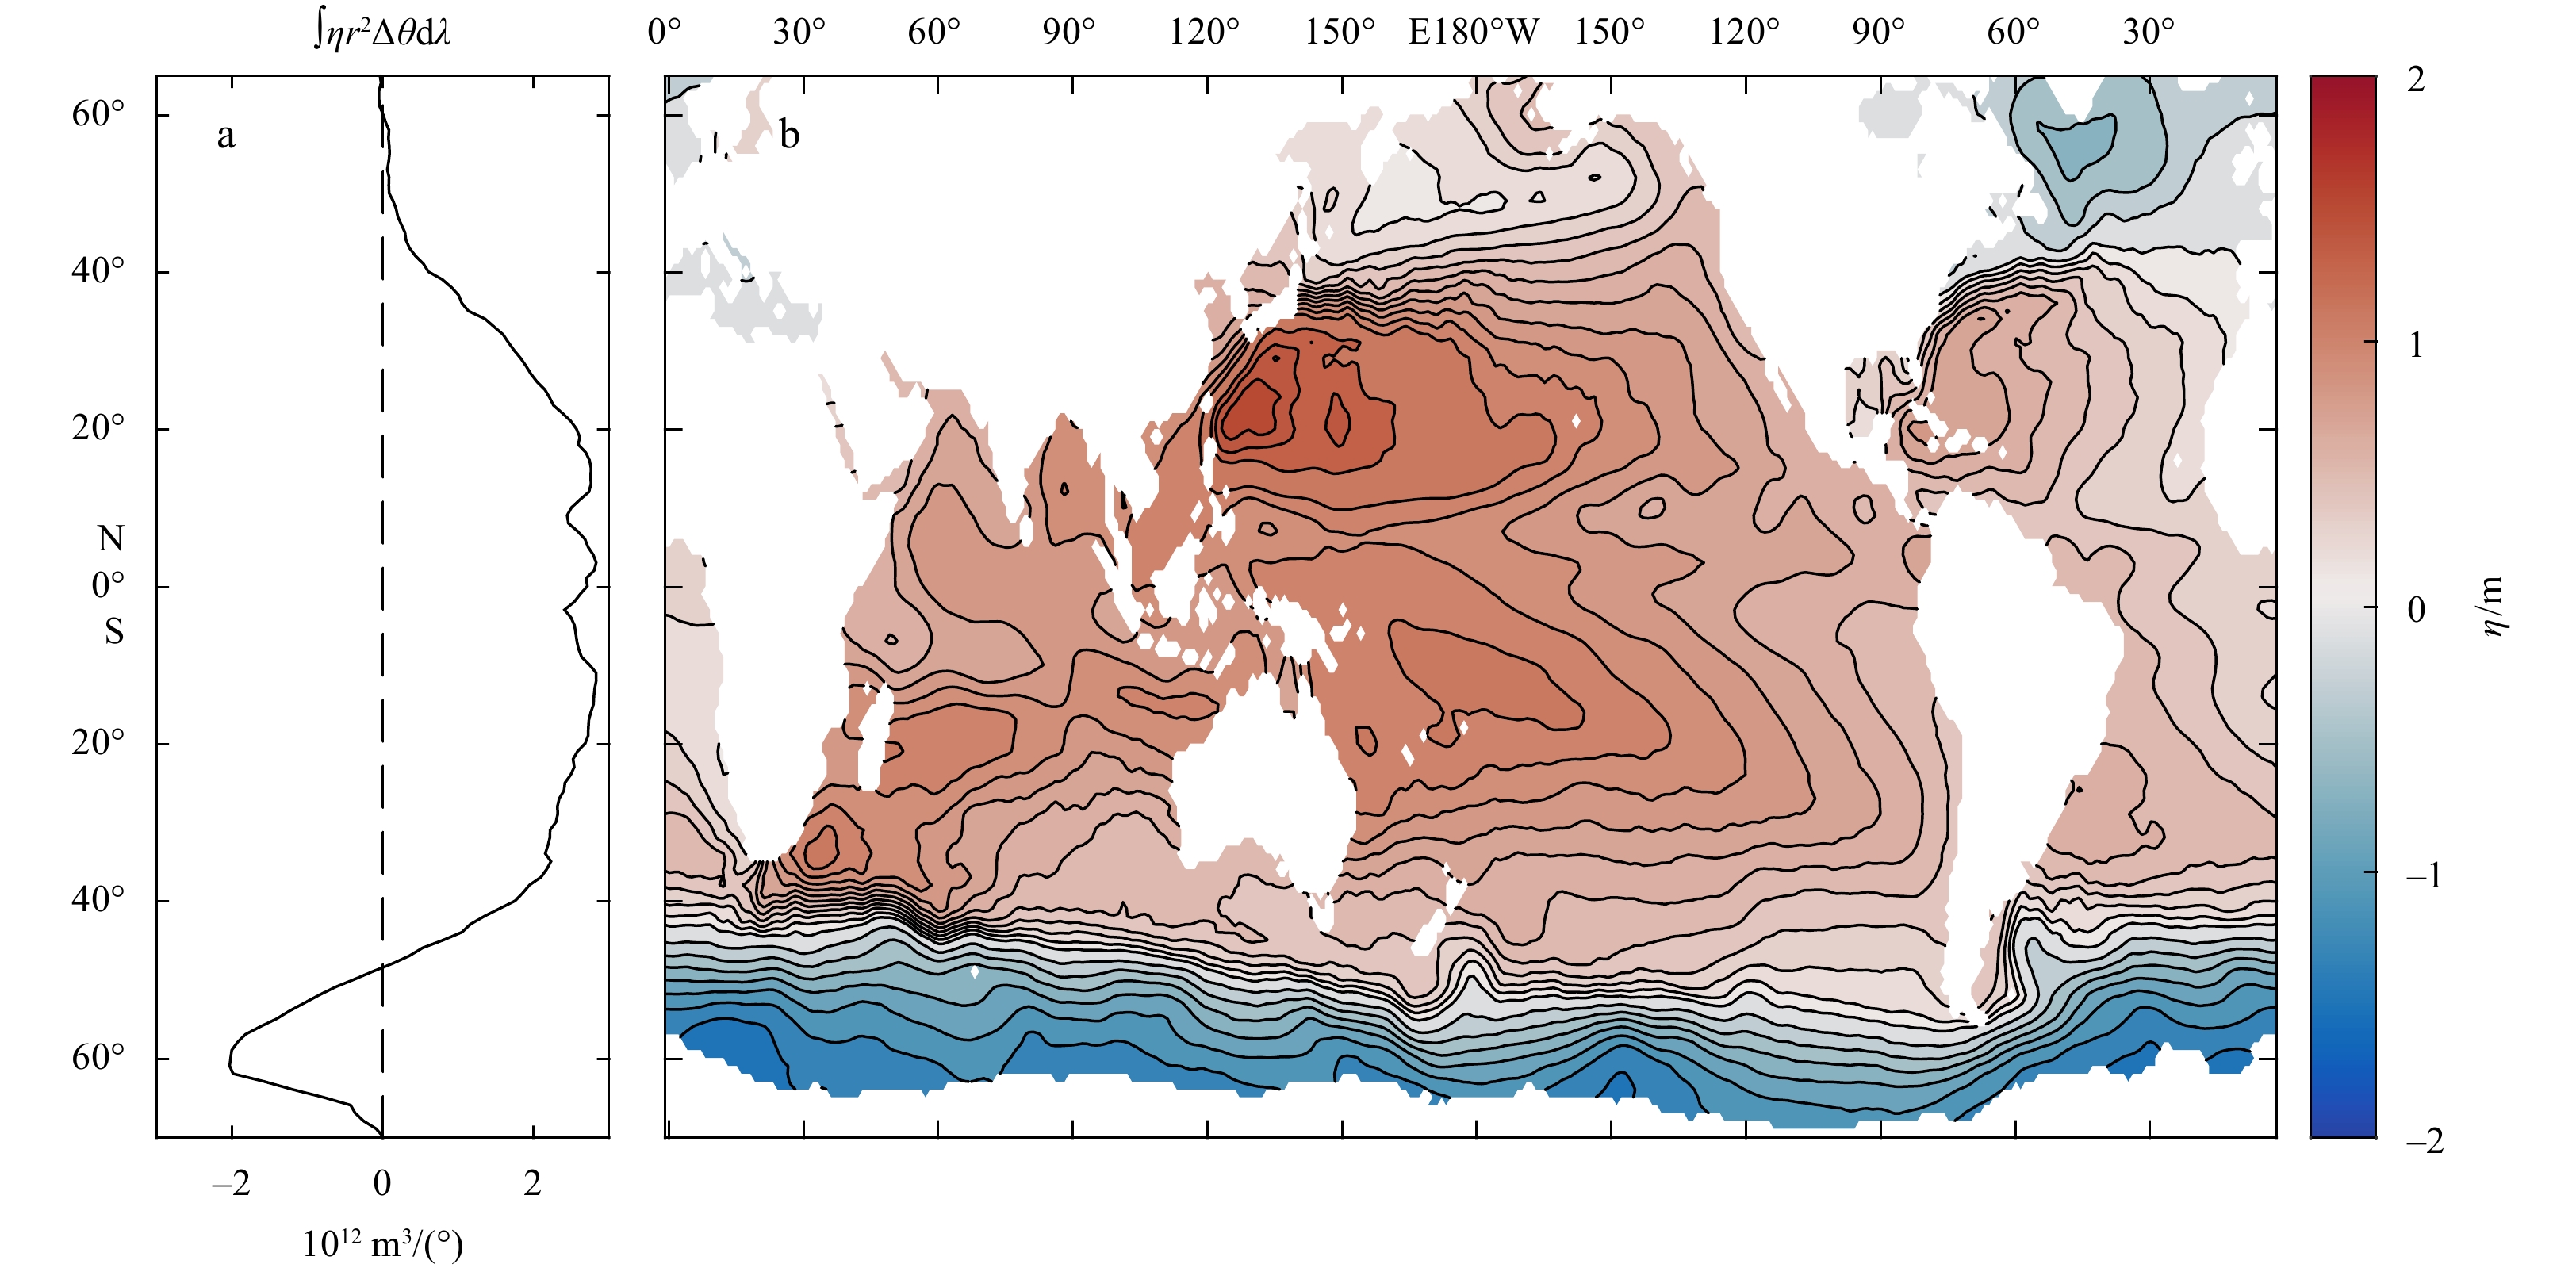
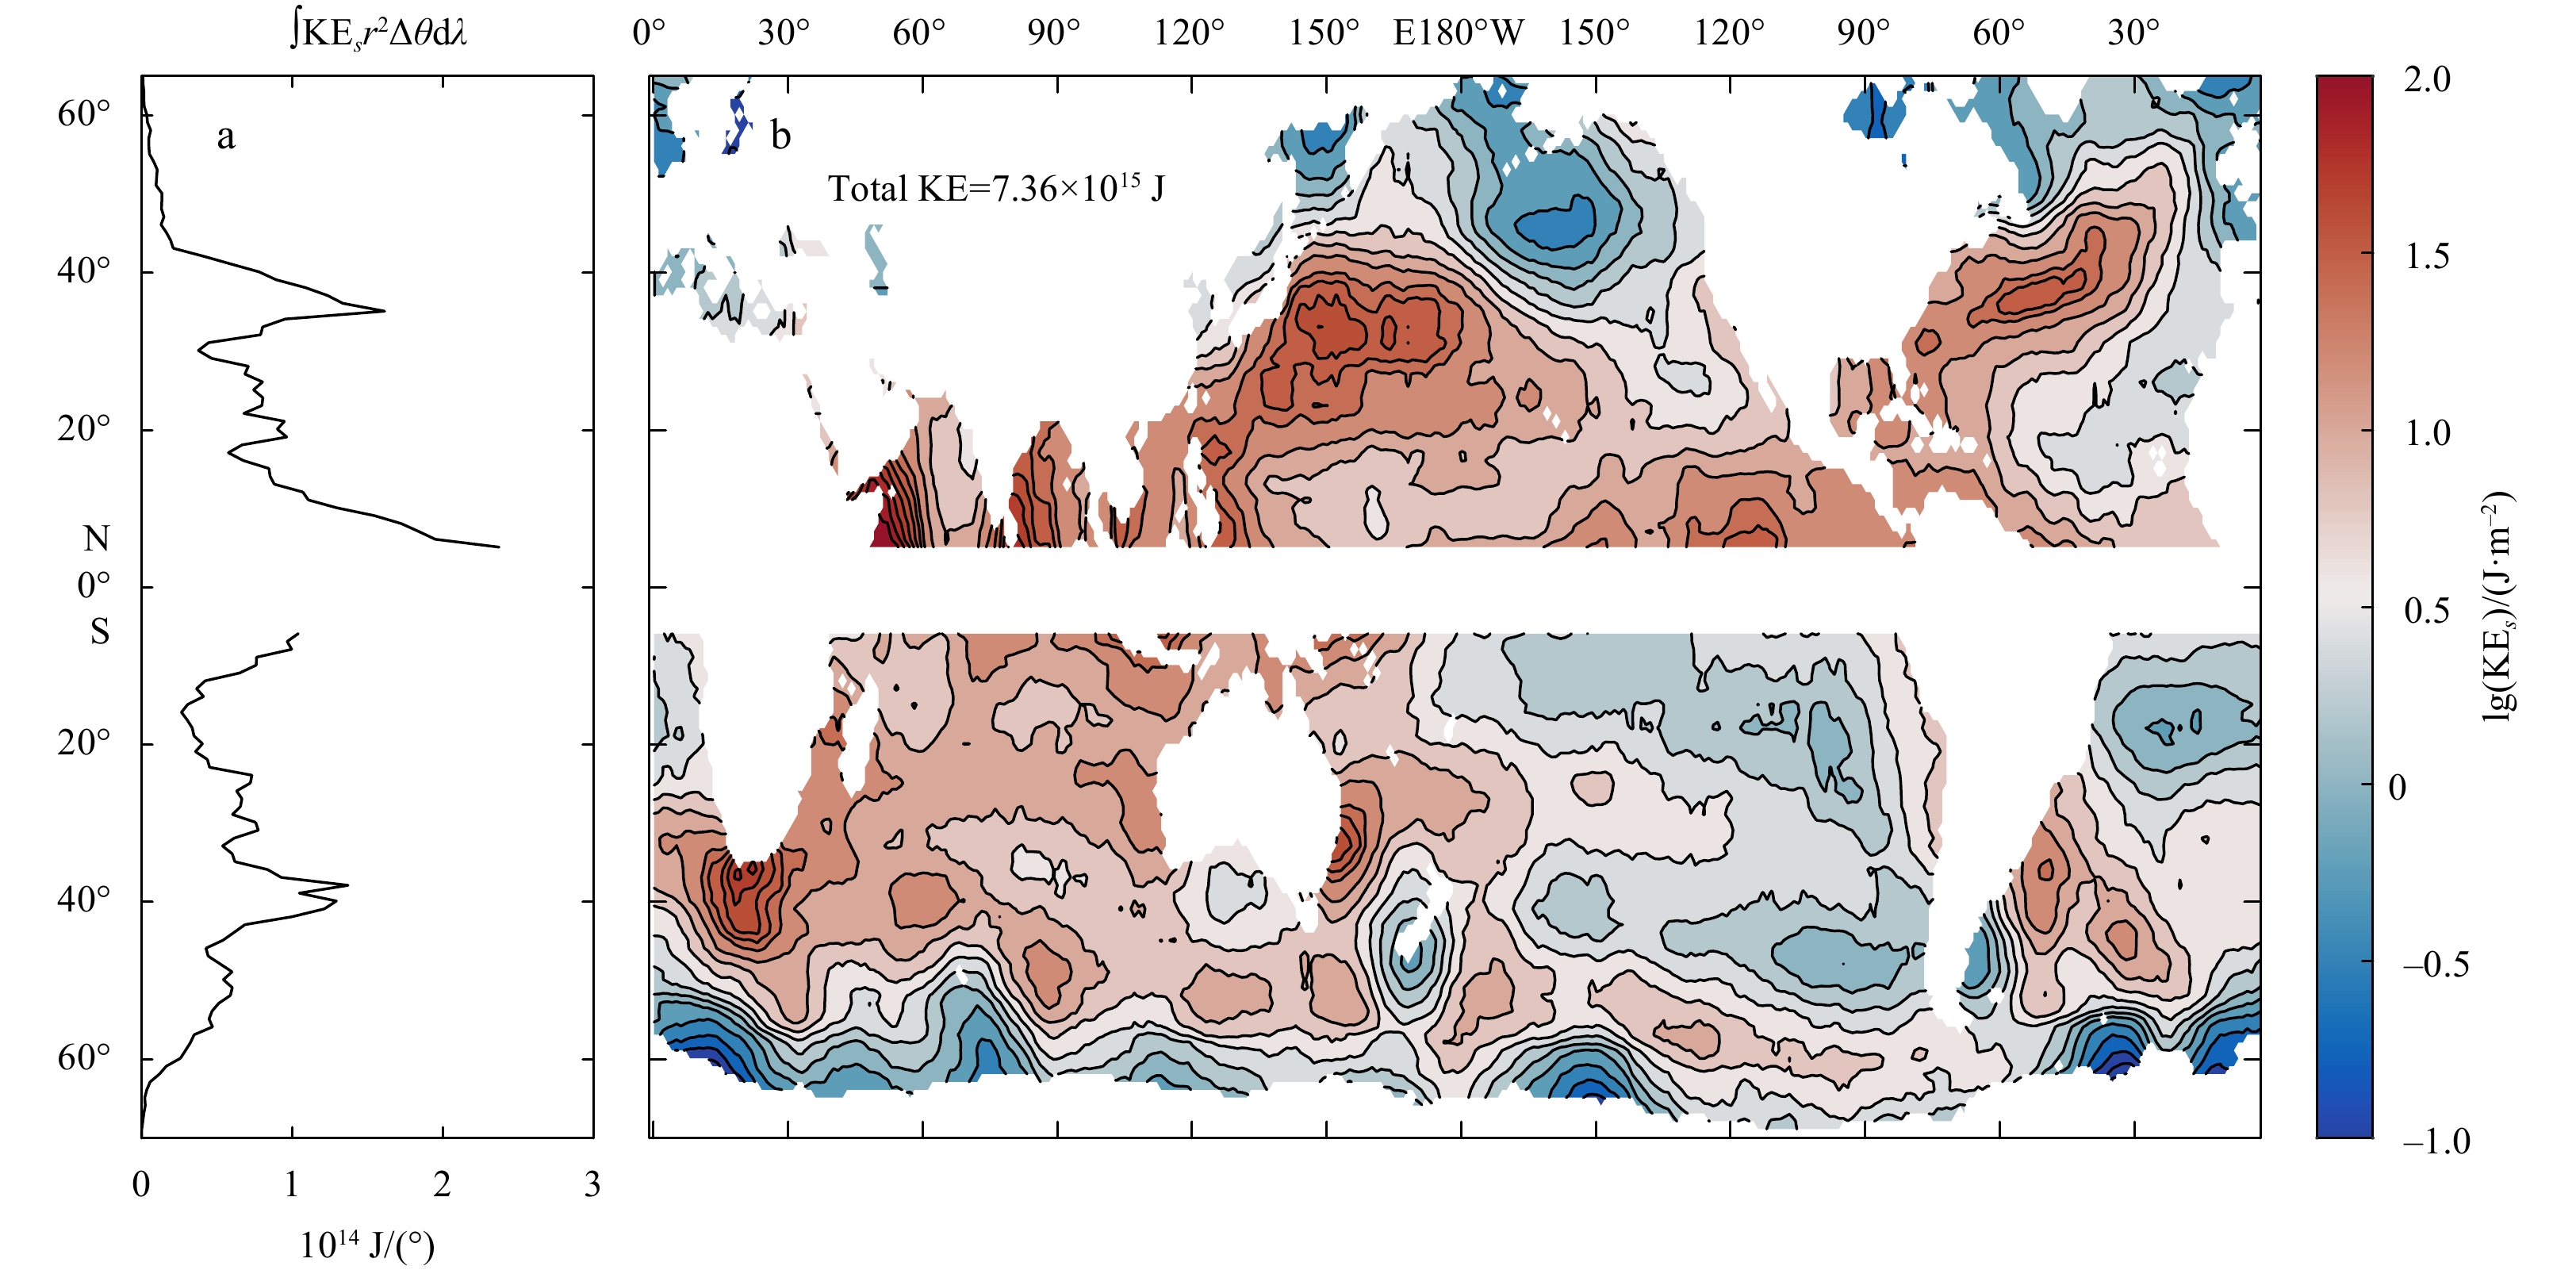
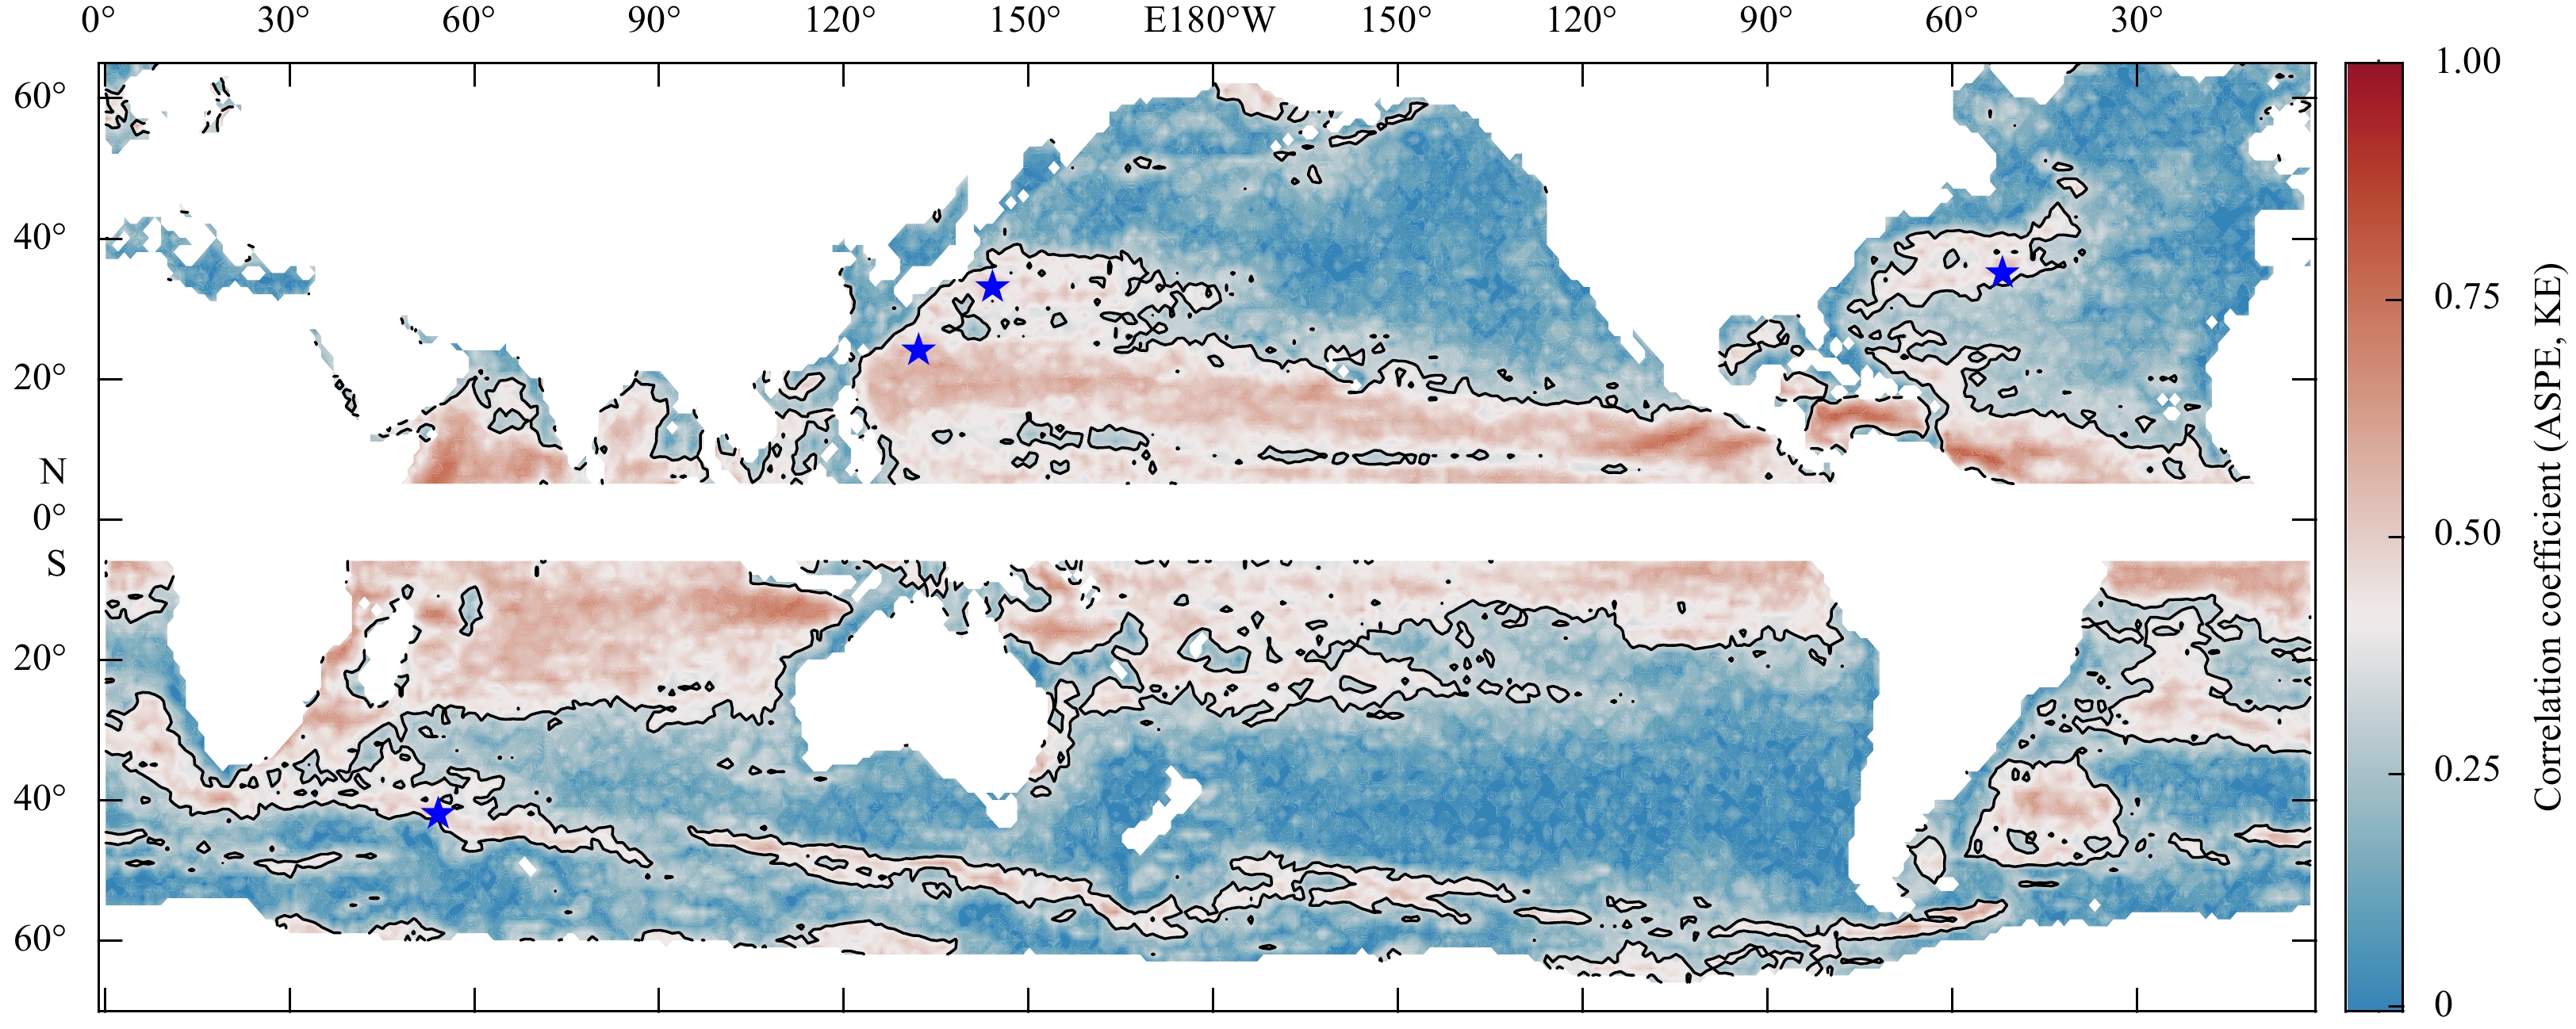
Satellite altimetry observations, including the upcoming Surface Water and Ocean Topography mission, provide snapshots of the global sea surface high anomaly field. The common practice in analyzing these surface elevation data is to convert them into surface velocity based on the geostrophic approximation. With increasing horizontal resolution in satellite observations, sea surface elevation data will contain many dynamical signals other than the geostrophic velocity. A new physical quantity, the available surface potential energy, is conceptually introduced in this study defined as the density multiplied by half of the squared deviation from the local mean reference surface elevation. This gravitational potential energy is an intrinsic property of the sea surface height field and it is an important component of ocean circulation energetics, especially near the sea surface. In connection with other energetic terms, this new variable may help us better understand the dynamics of oceanic circulation, in particular the processes in connection with the free surface data collected through satellite altimetry. The preliminary application of this concept to the numerically generated monthly mean Global Ocean Data Assimilation System data and Archiving, Validation, and Interpretation of Satellite Oceanographic altimeter data shows that the available surface potential energy is potentially linked to other dynamic variables, such as the total kinetic energy, eddy kinetic energy and available potential energy.
Prediction of visibility in the Arctic based on dynamic Bayesian network analysis
Shijun Zhao, Yulong Shan, Ismail Gultepe
2022, 41(4): 57-67. doi: 10.1007/s13131-021-1826-z
Abstract:
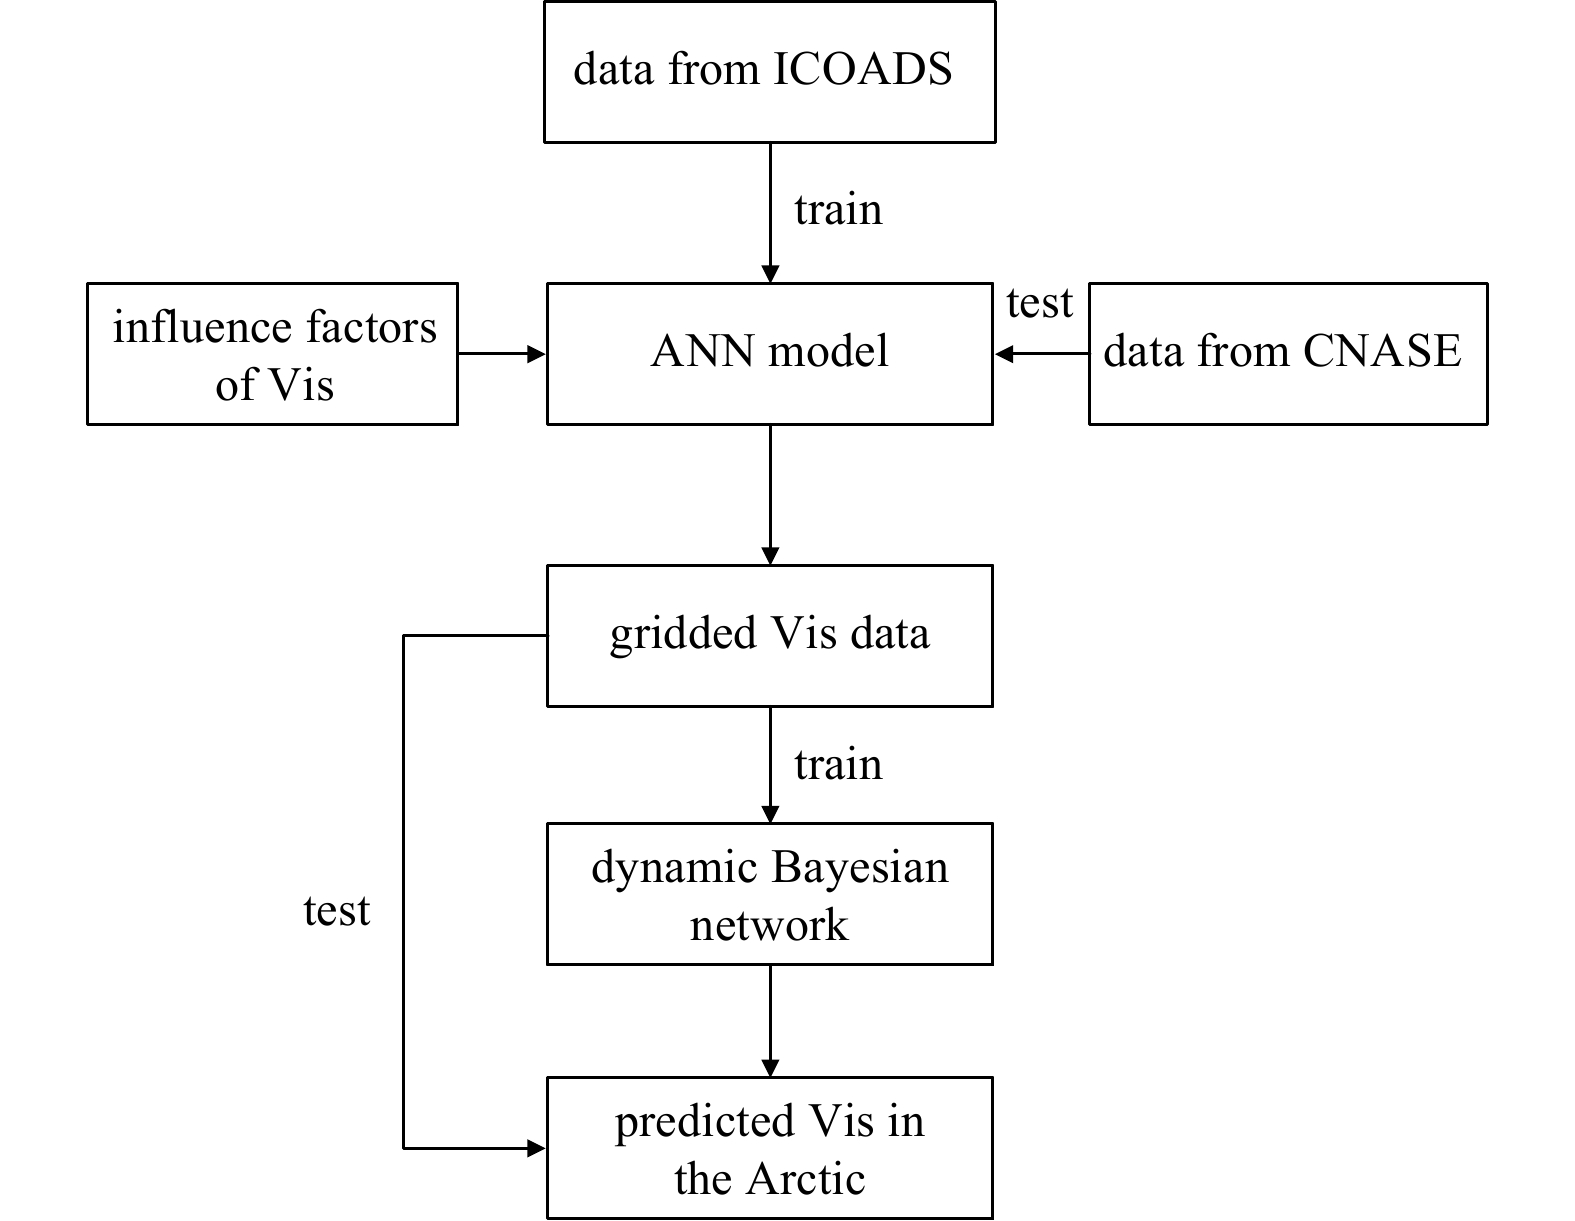
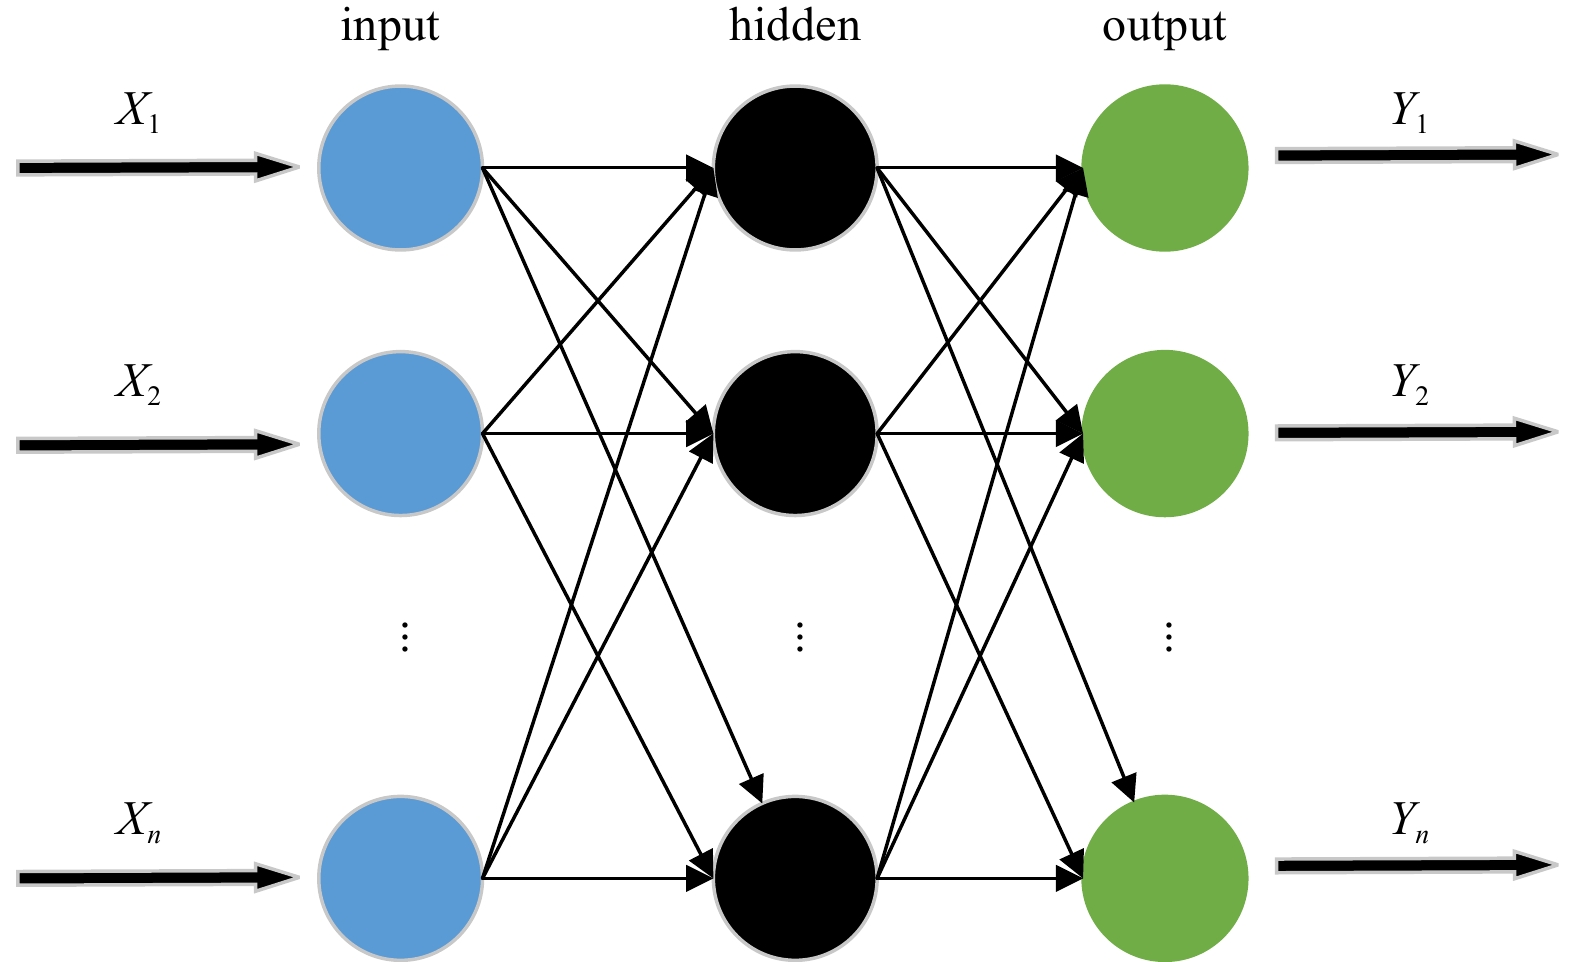
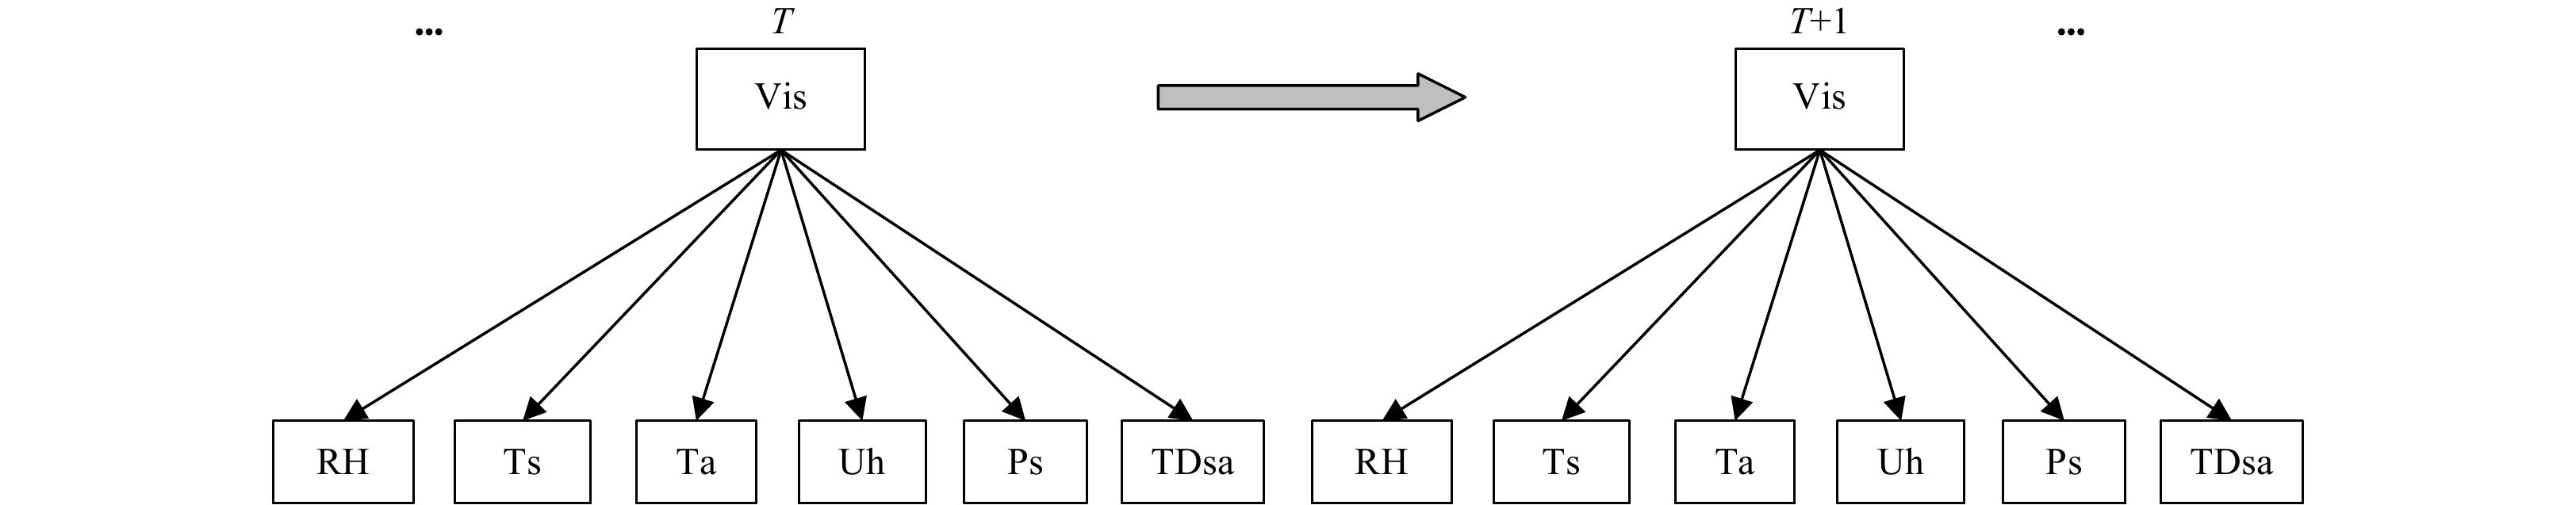
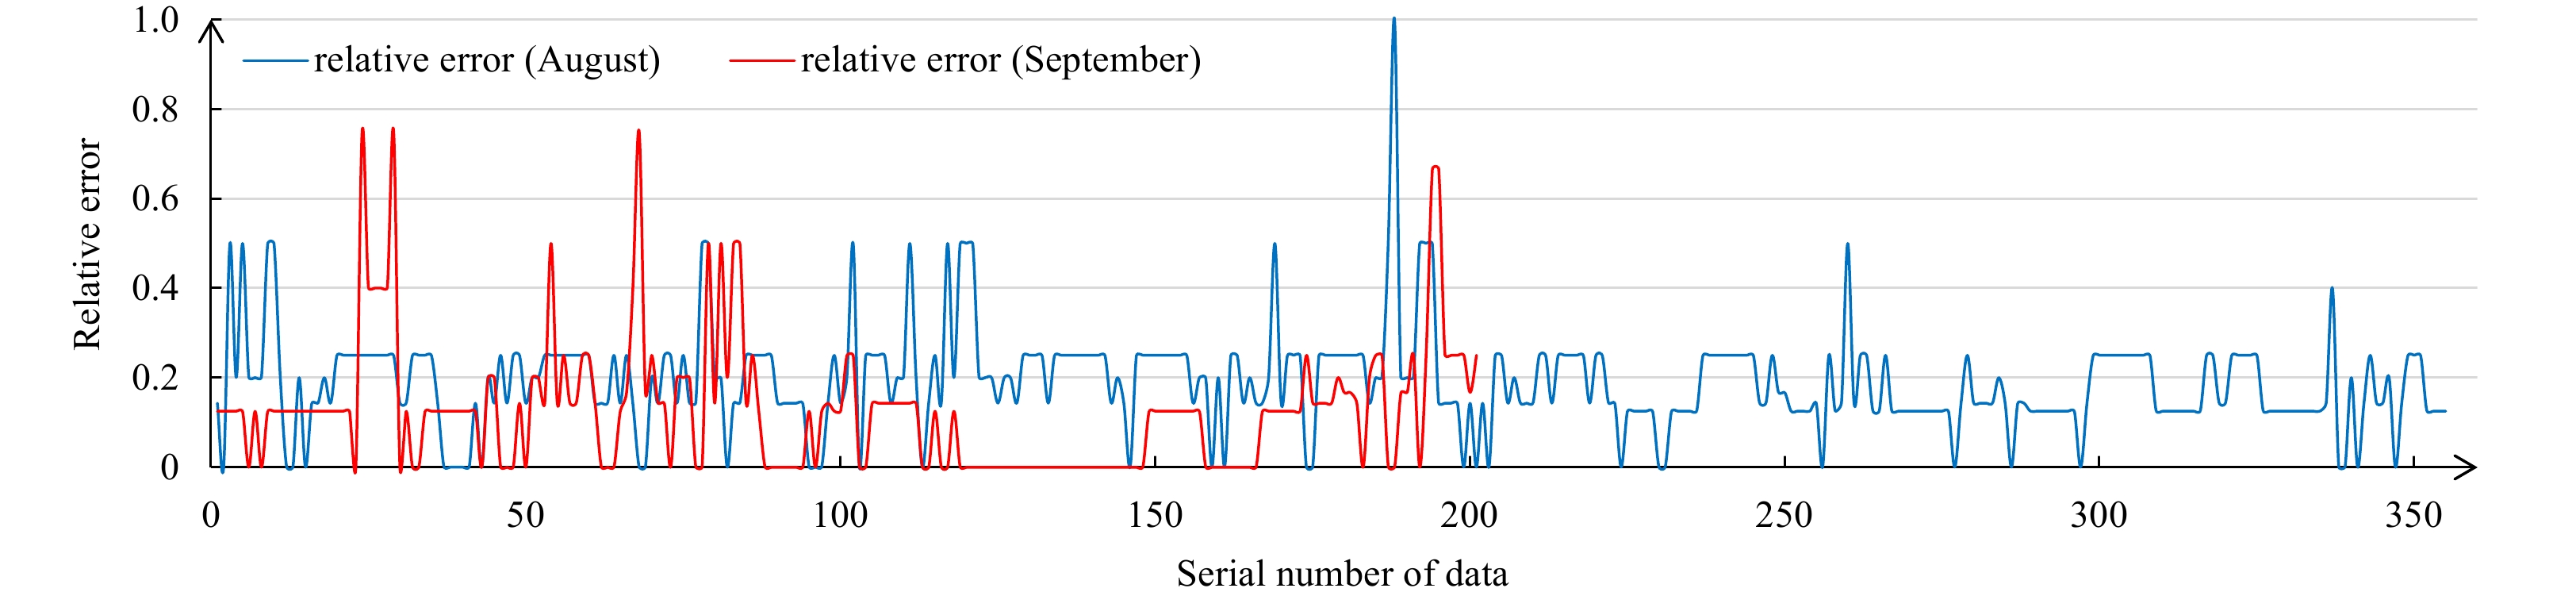
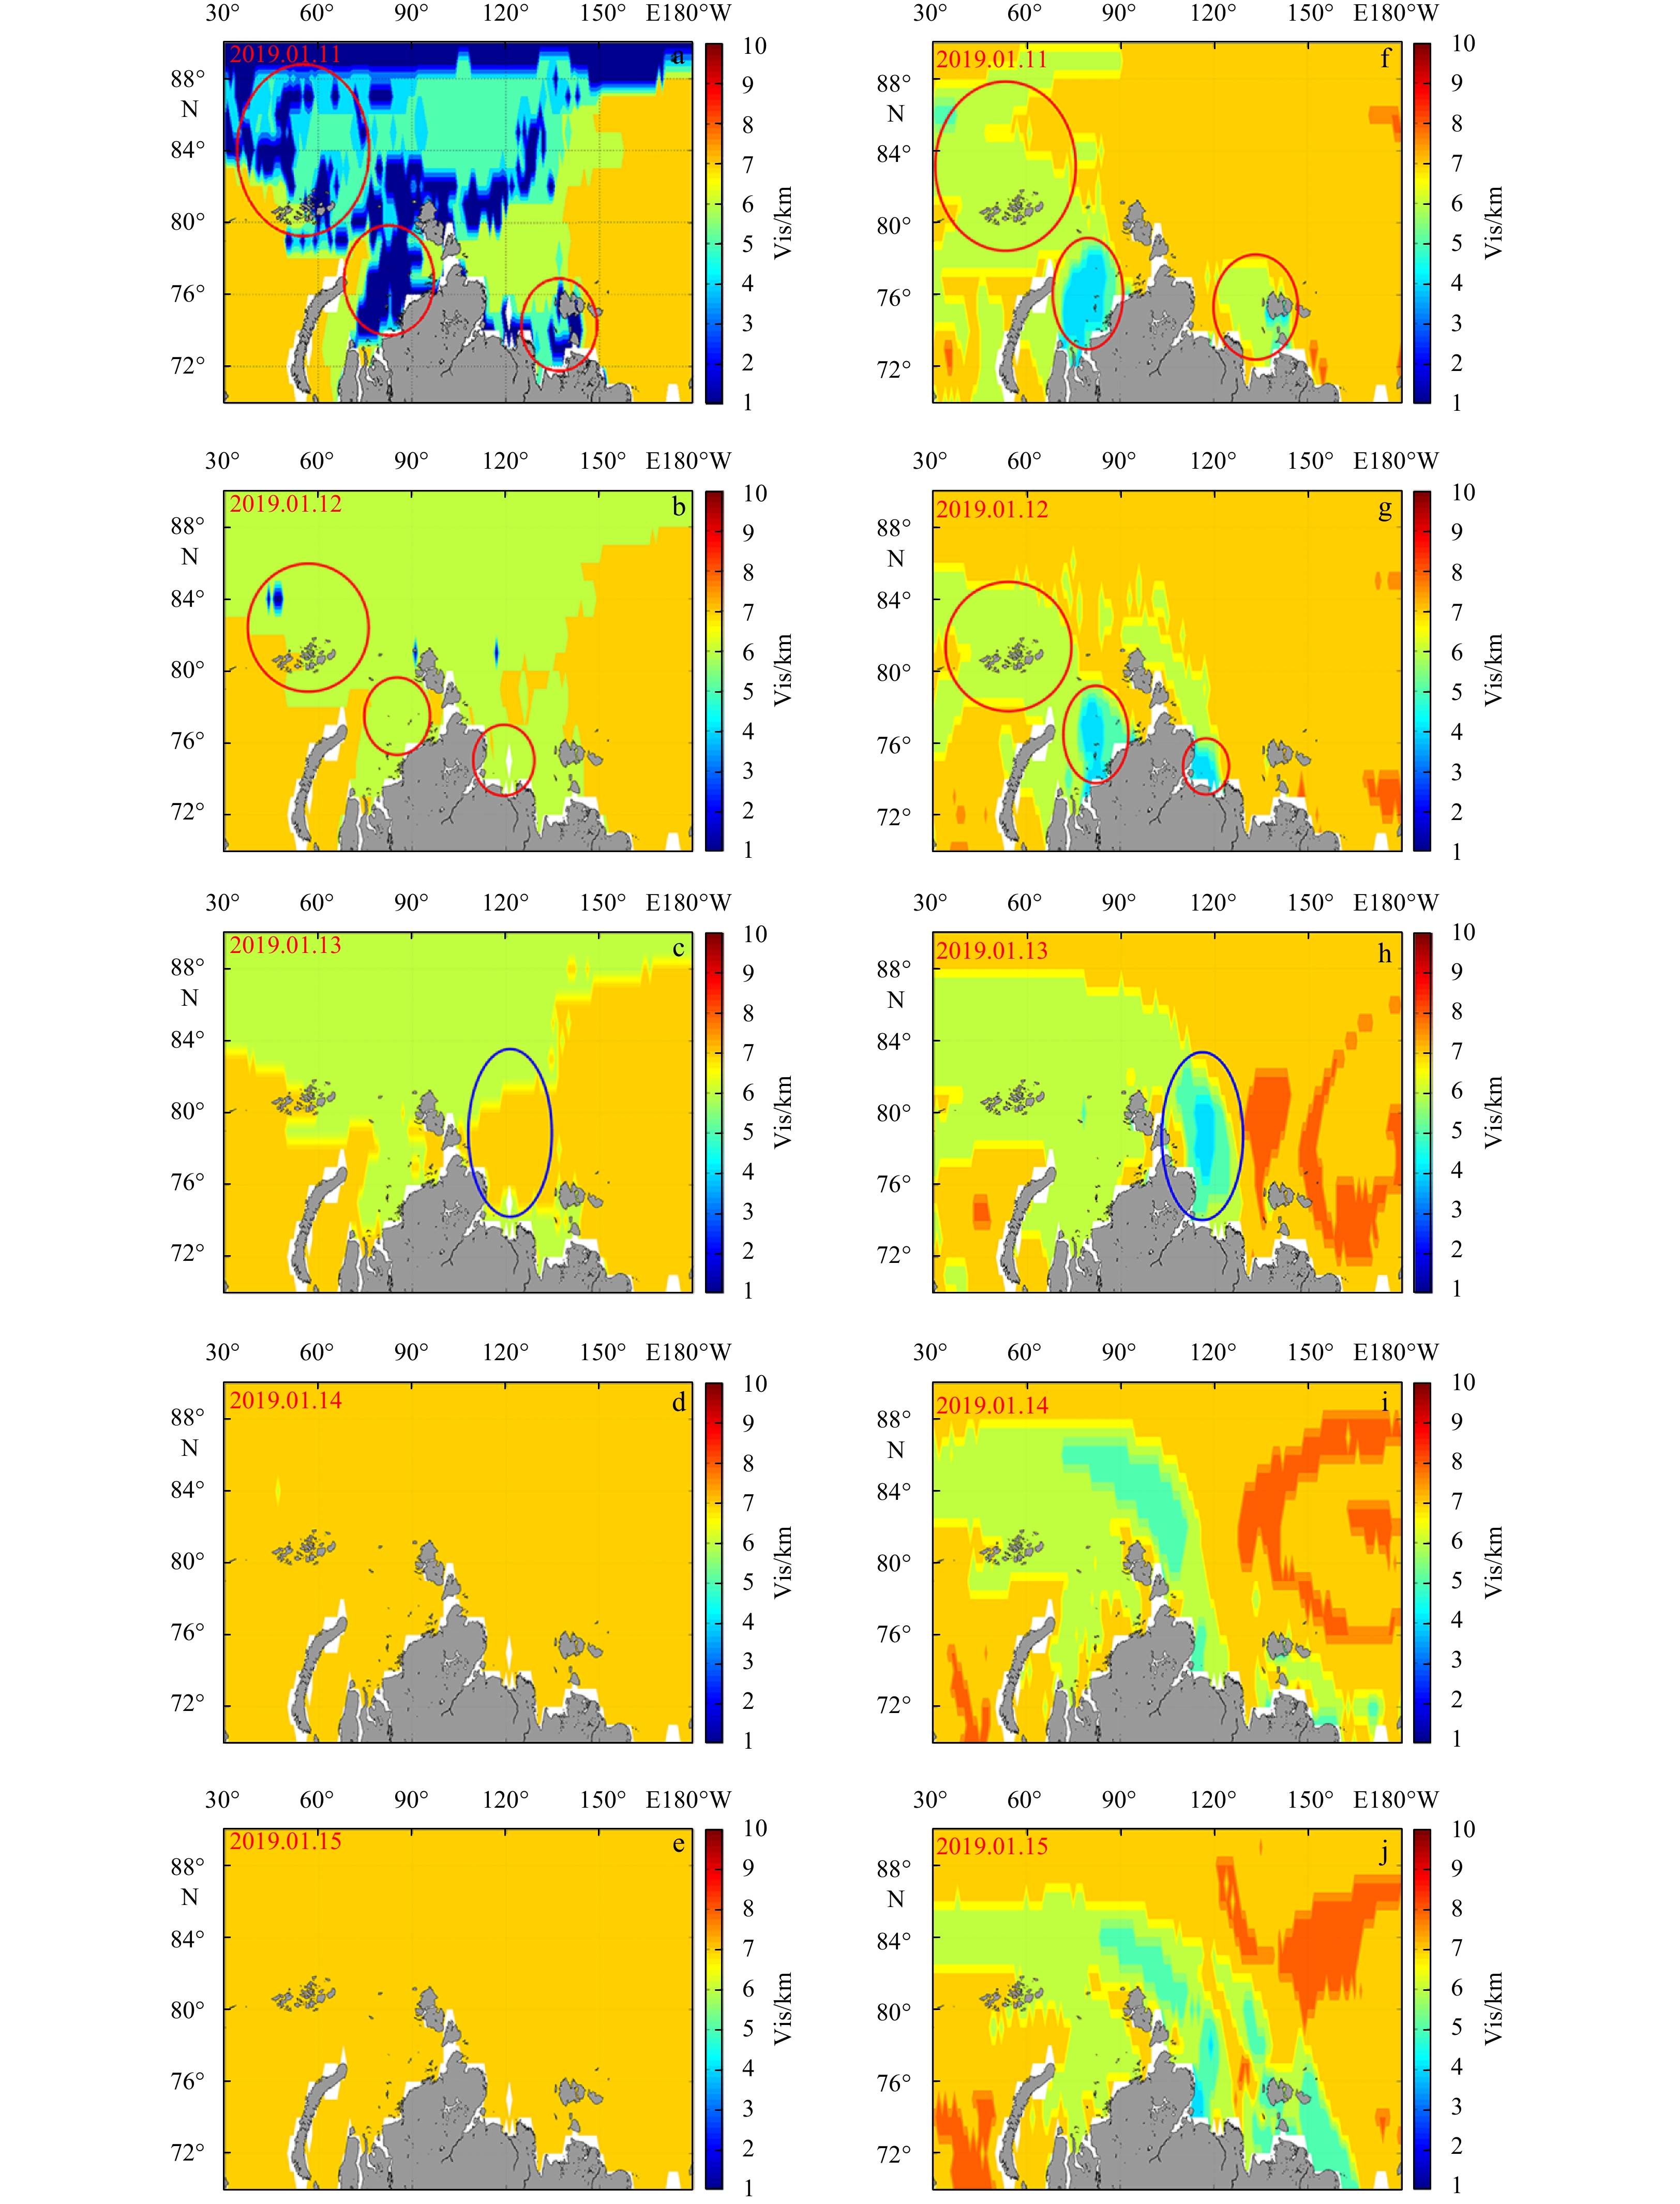
With the accelerated warming of the world, the safety and use of Arctic passages is receiving more attention. Predicting visibility in the Arctic has been a hot topic in recent years because of navigation risks and opening of ice-free northern passages. Numerical weather prediction and statistical prediction are two methods for predicting visibility. As microphysical parameterization schemes for visibility are so sophisticated, visibility prediction using numerical weather prediction models includes large uncertainties. With the development of artificial intelligence, statistical prediction methods have received increasing attention. In this study, we constructed a statistical model with a physical basis, to predict visibility in the Arctic based on a dynamic Bayesian network, and tested visibility prediction over a 1°×1° grid area averaged daily. The results show that the mean relative error of the predicted visibility from the dynamic Bayesian network is approximately 14.6% compared with the inferred visibility from the artificial neural network. However, dynamic Bayesian network can predict visibility for only 3 days. Moreover, with an increase in predicted area and period, the uncertainty of the predicted visibility becomes larger. At the same time, the accuracy of the predicted visibility is positively correlated with the time period of the input evidence data. It is concluded that using a dynamic Bayesian network to predict visibility can be useful over Arctic regions for projected climatic changes.
Contraction and warming of Antarctic Bottom Water in the Amundsen Sea
Yu Bai, Liang Zhao, Jingen Xiao, Shiying Lin
2022, 41(4): 68-79. doi: 10.1007/s13131-021-1829-8
Abstract:
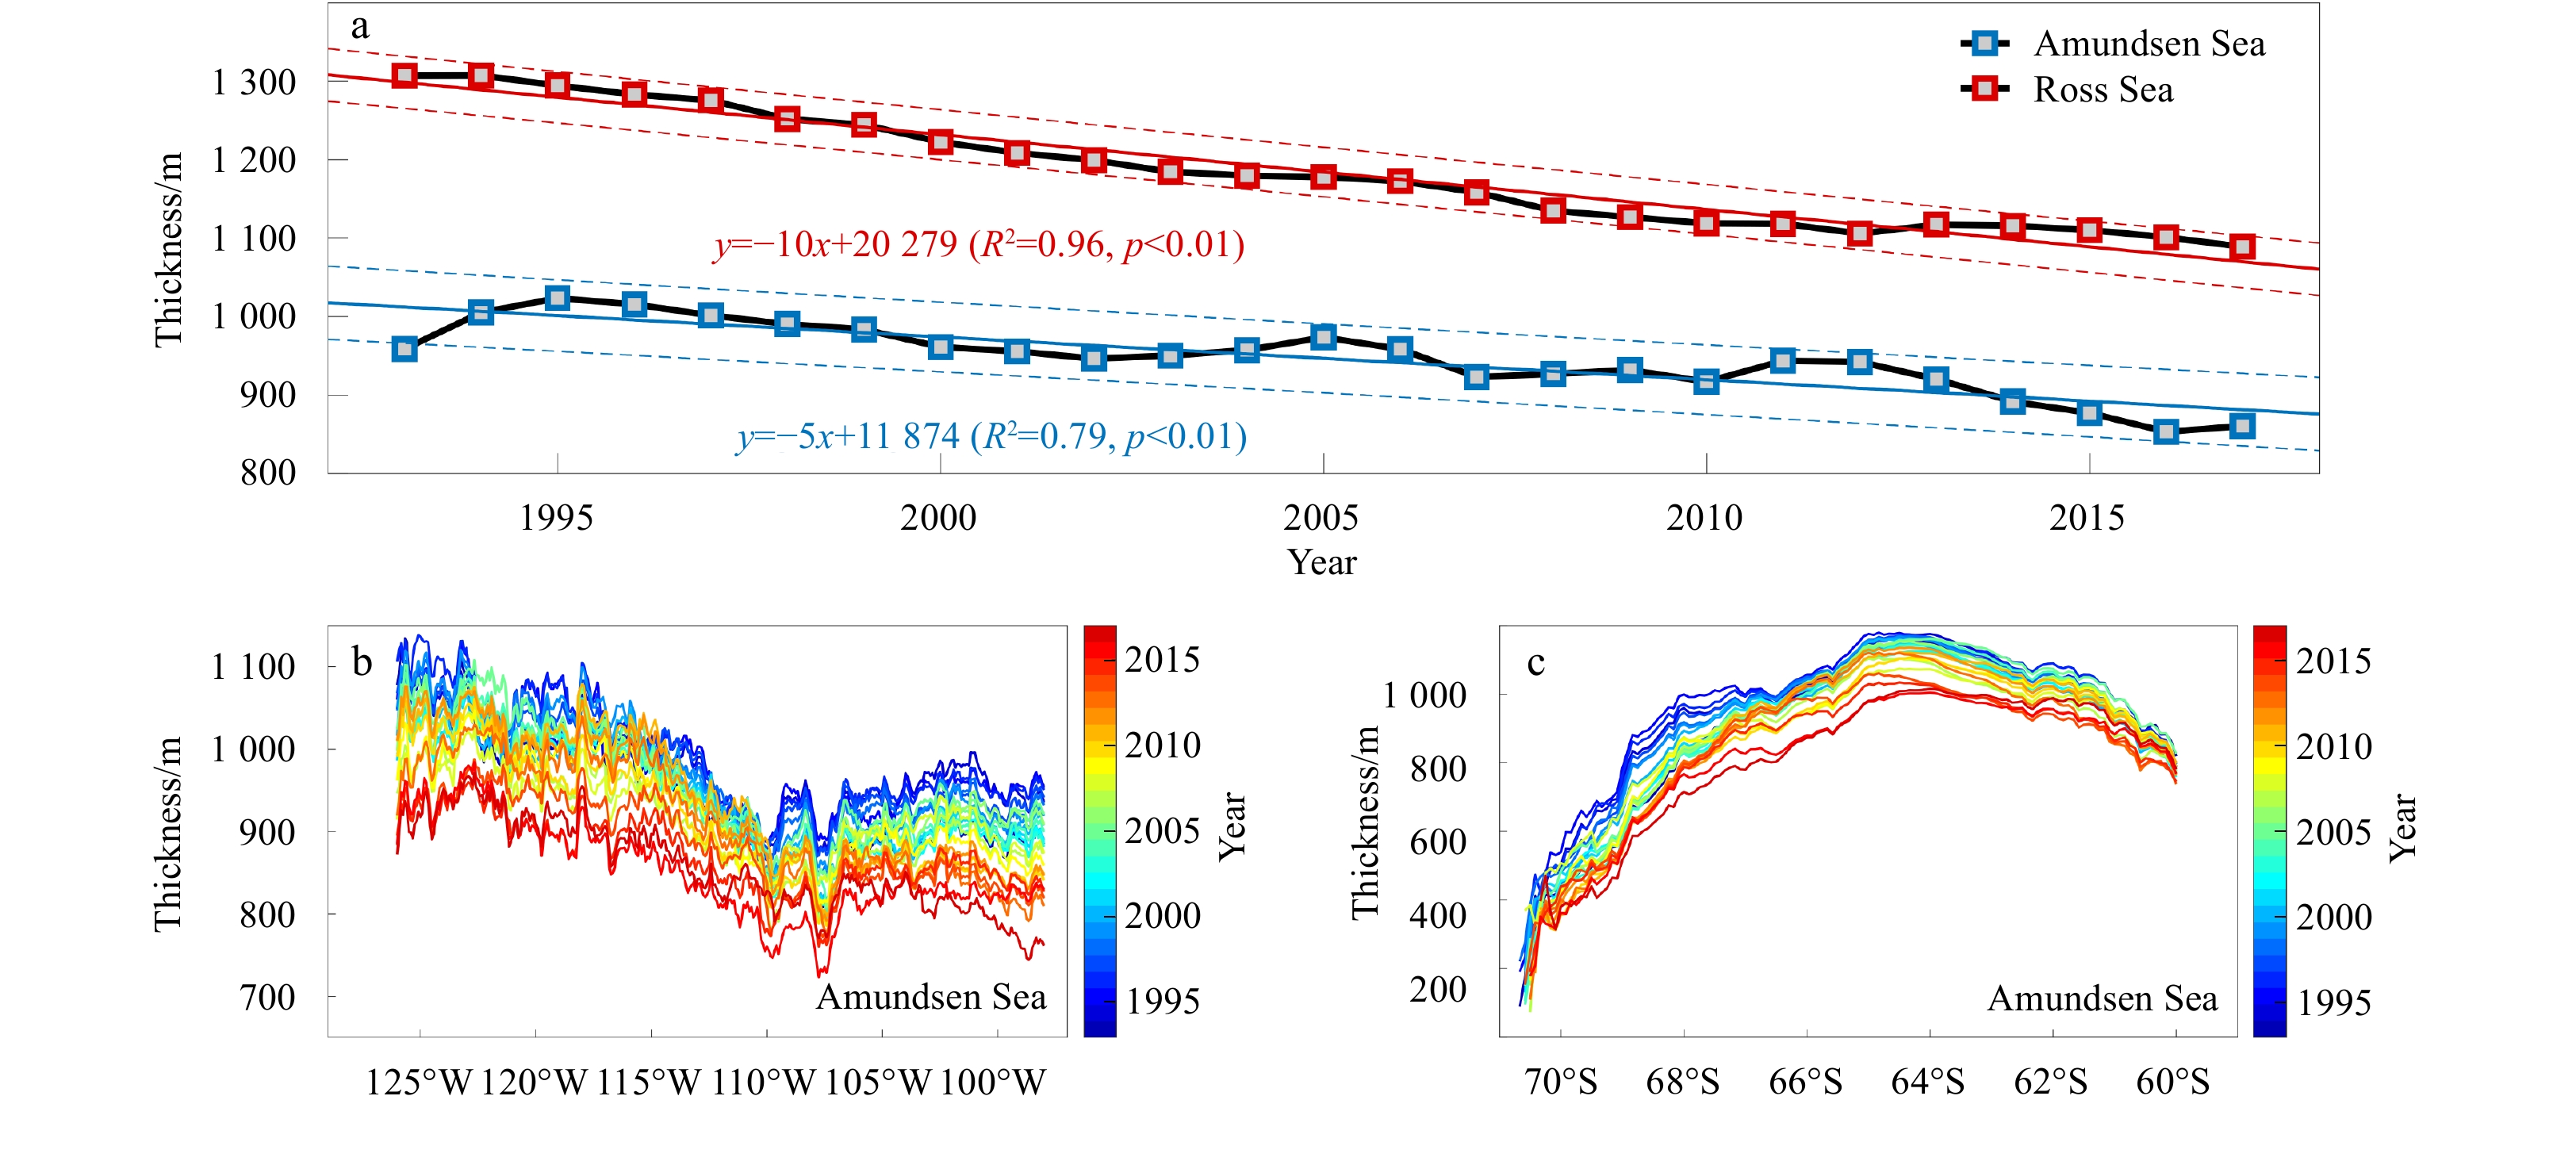
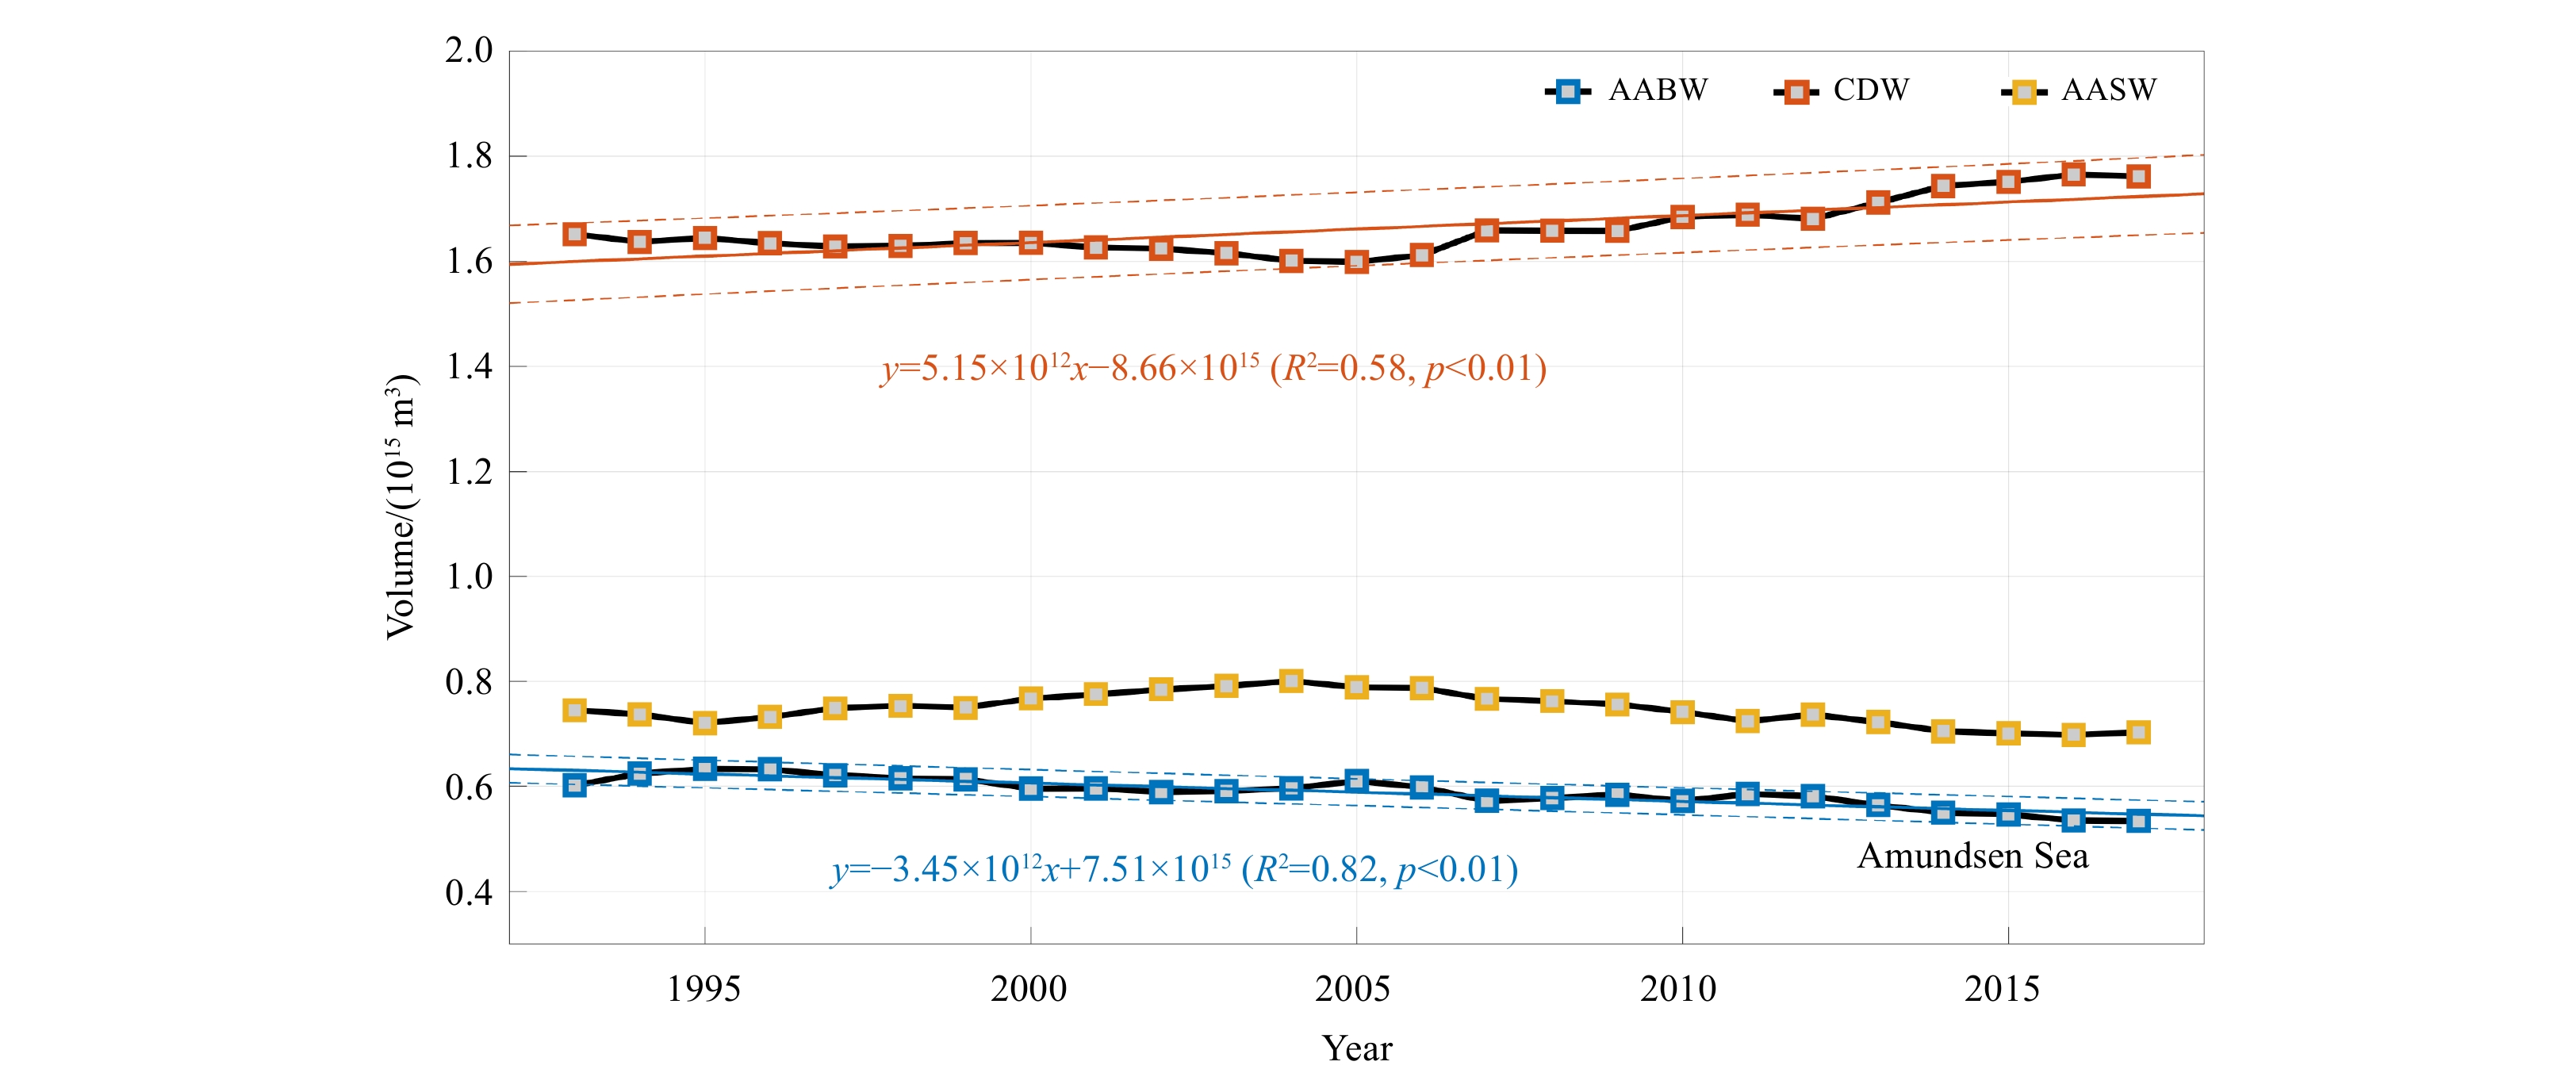
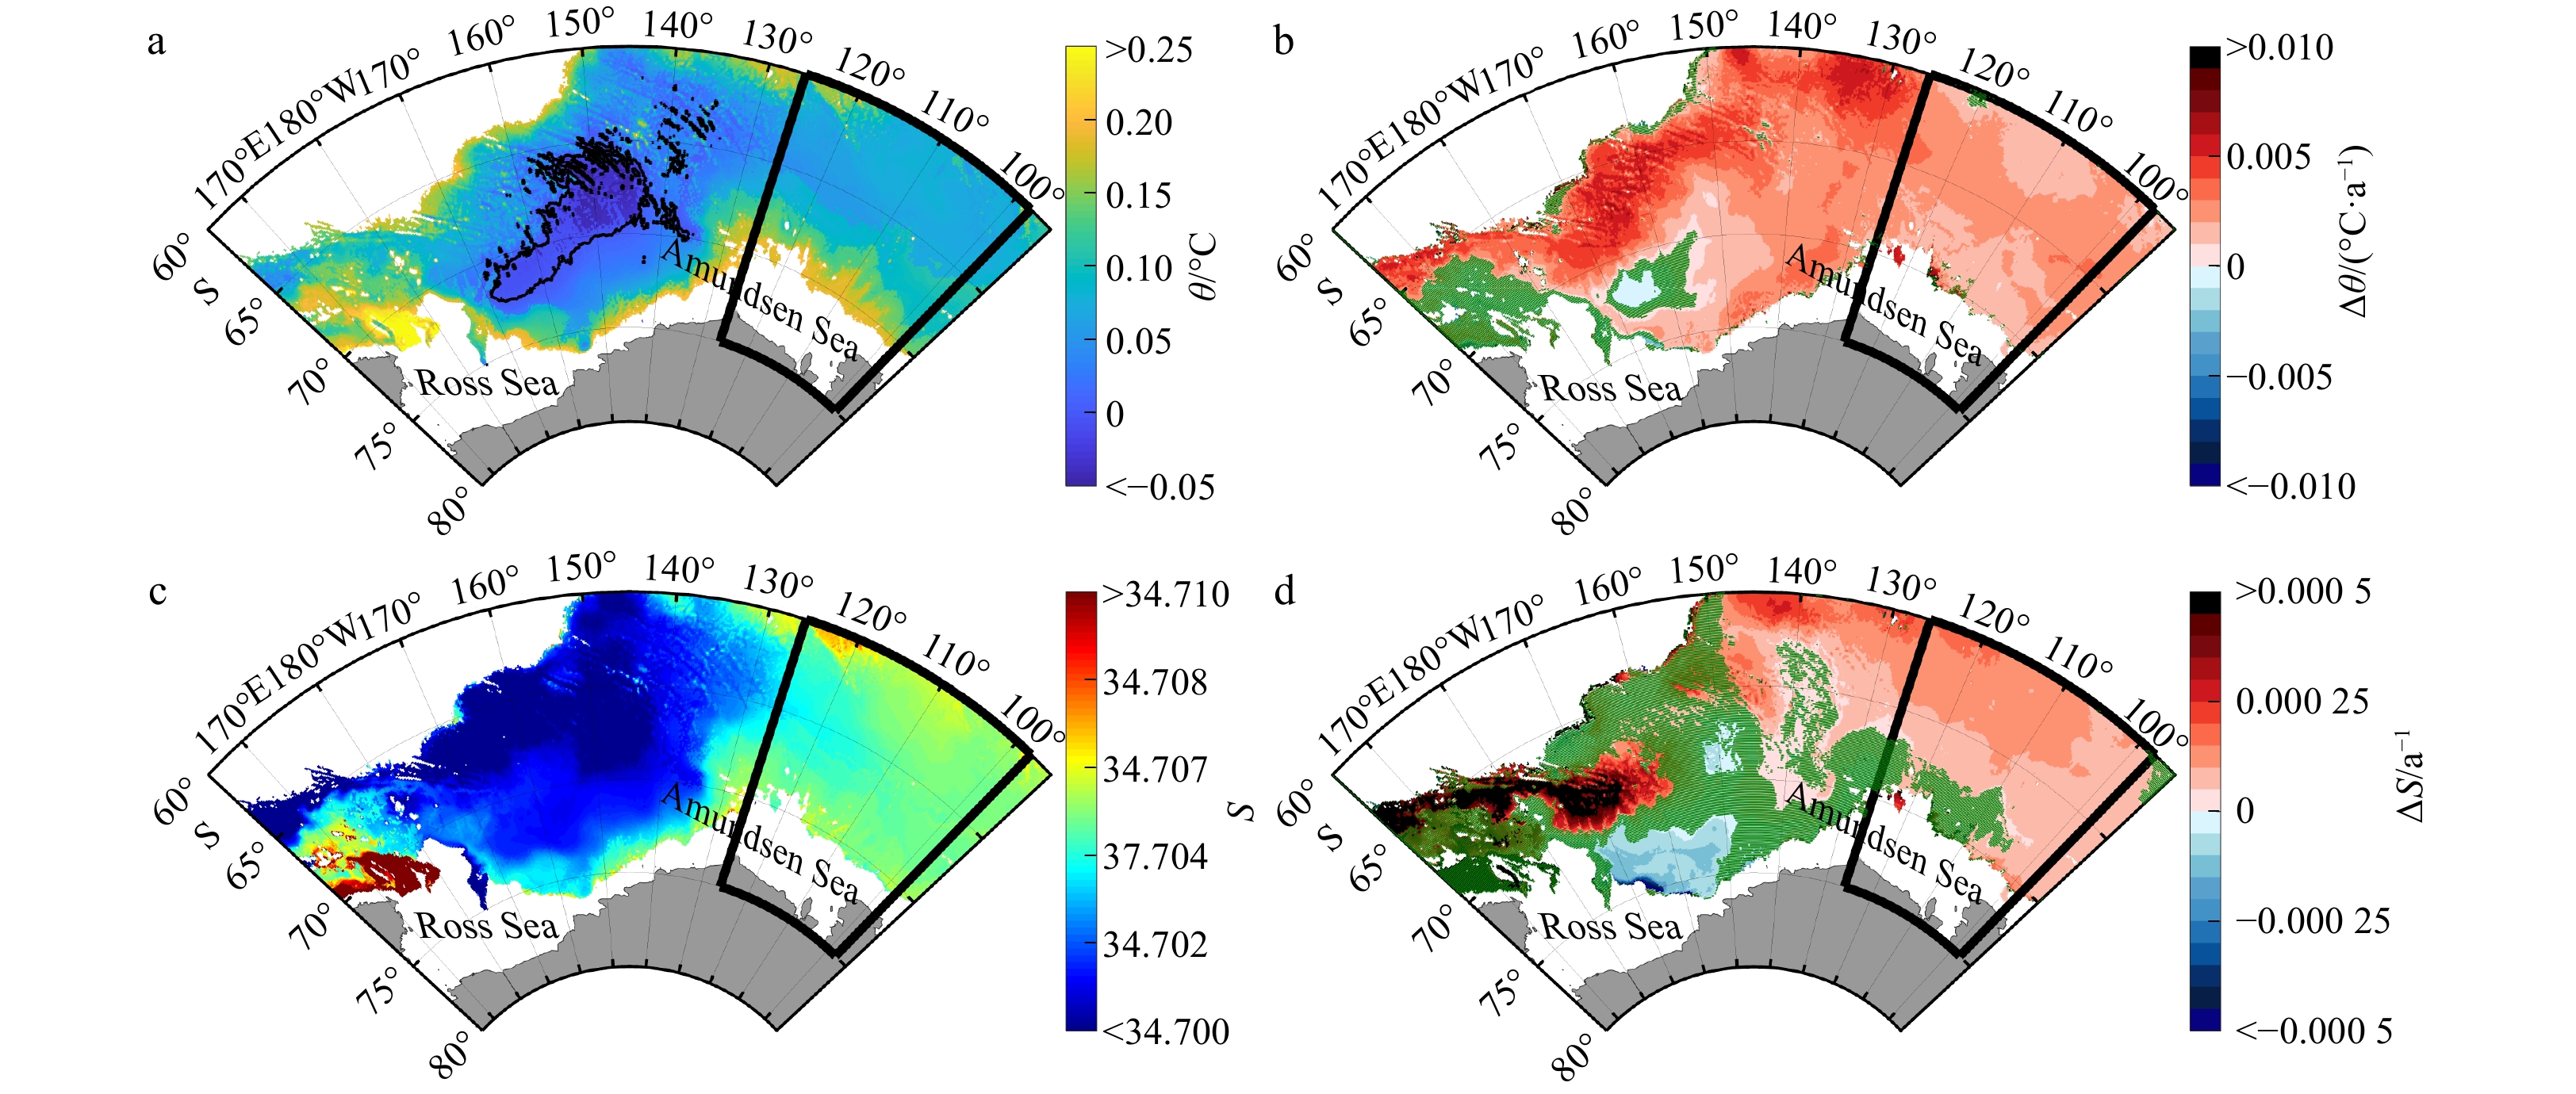
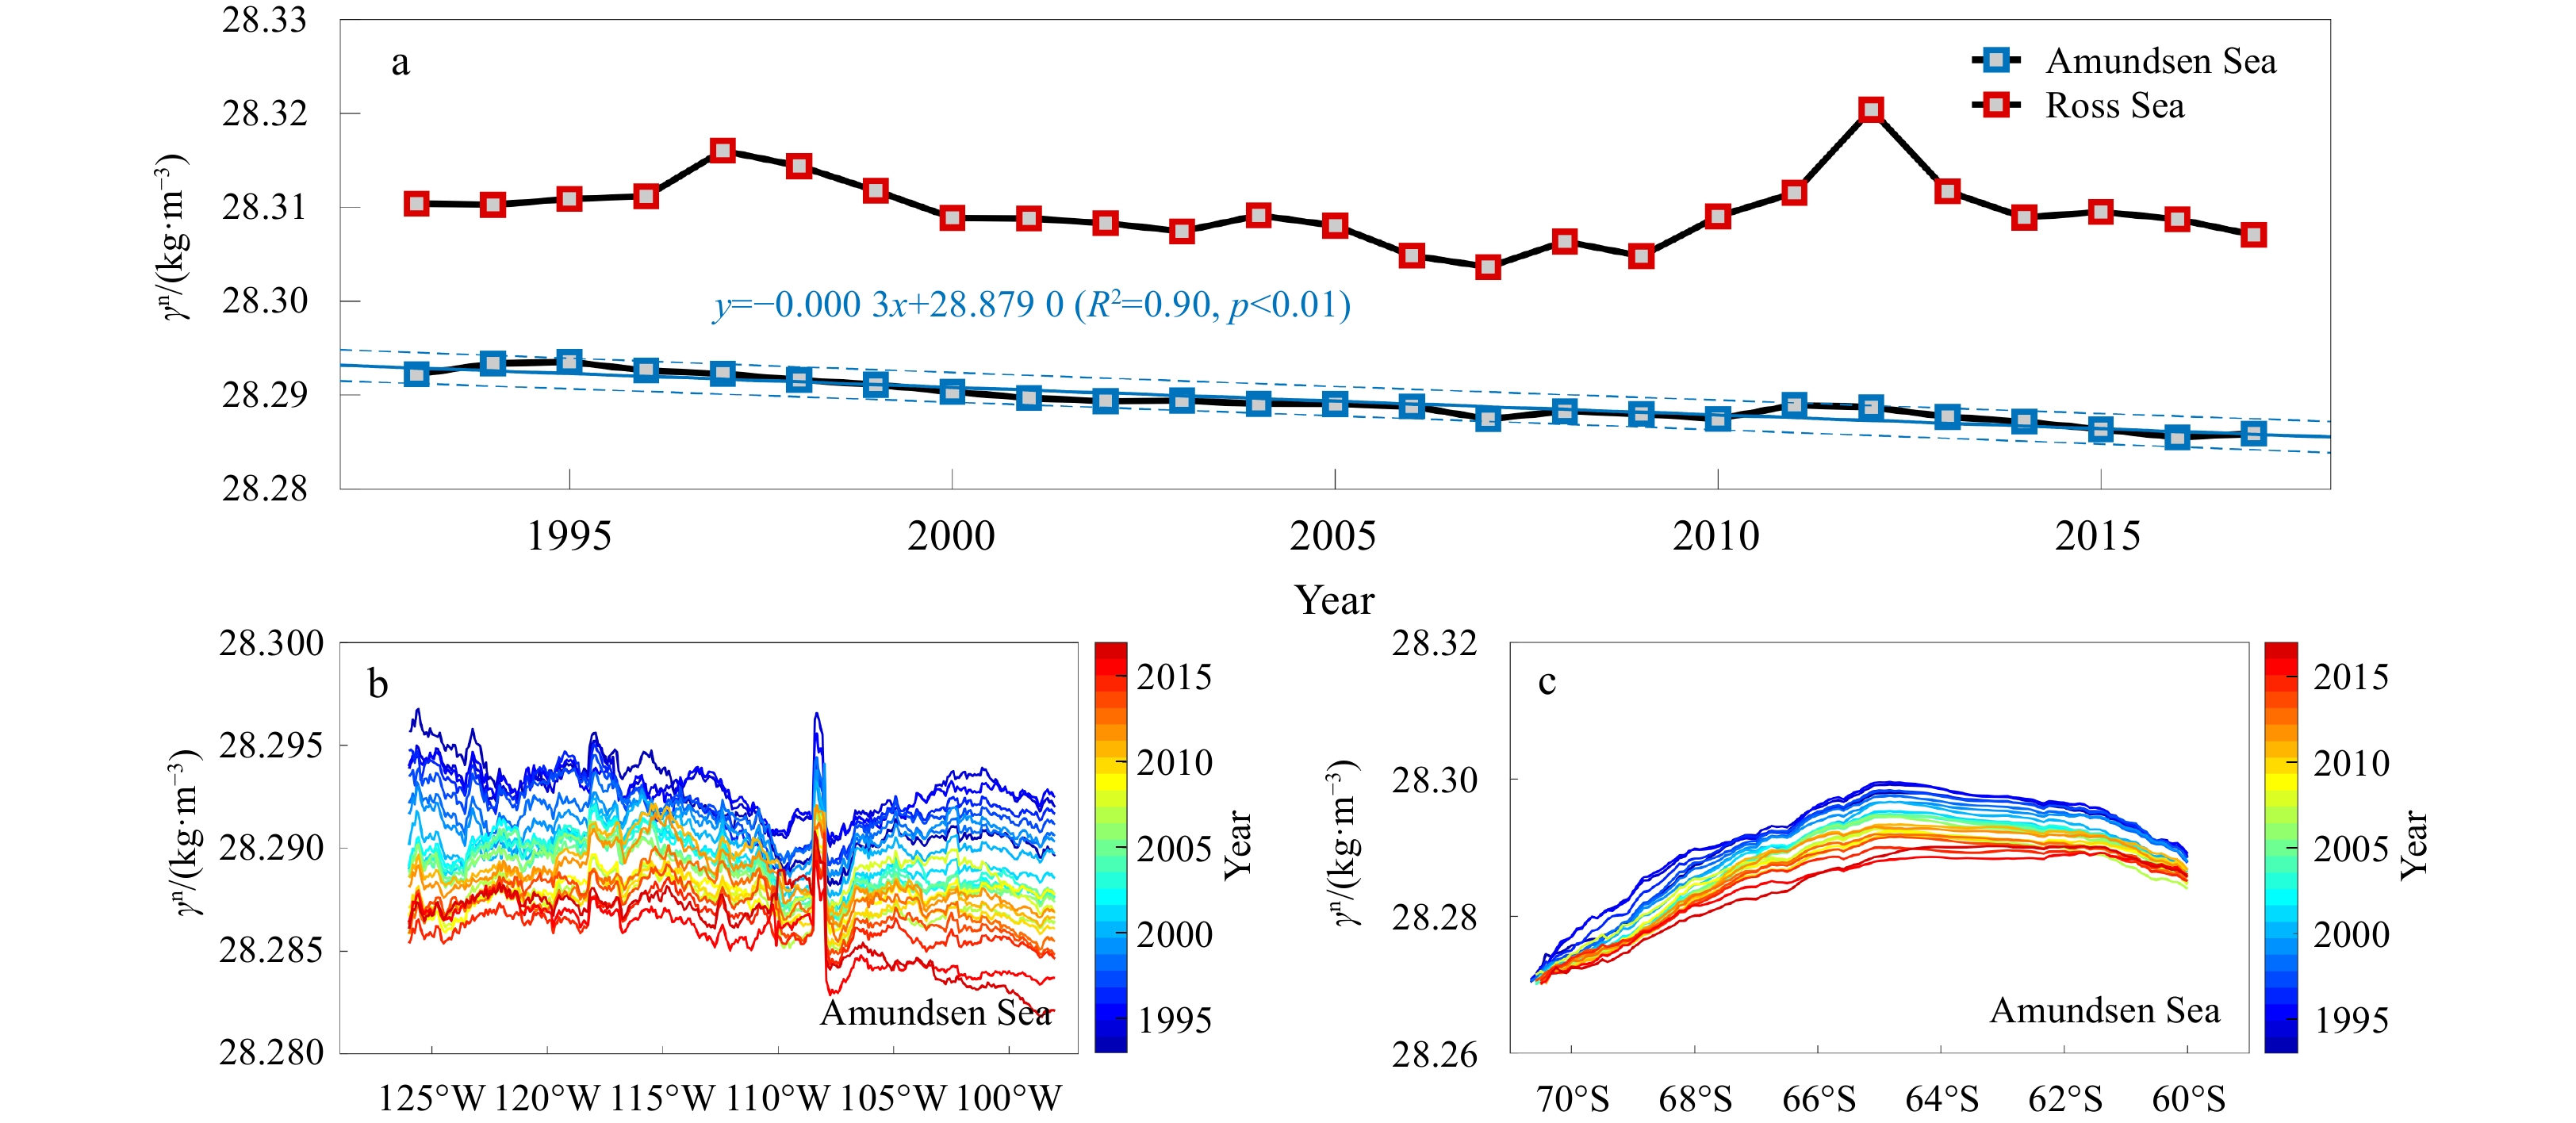
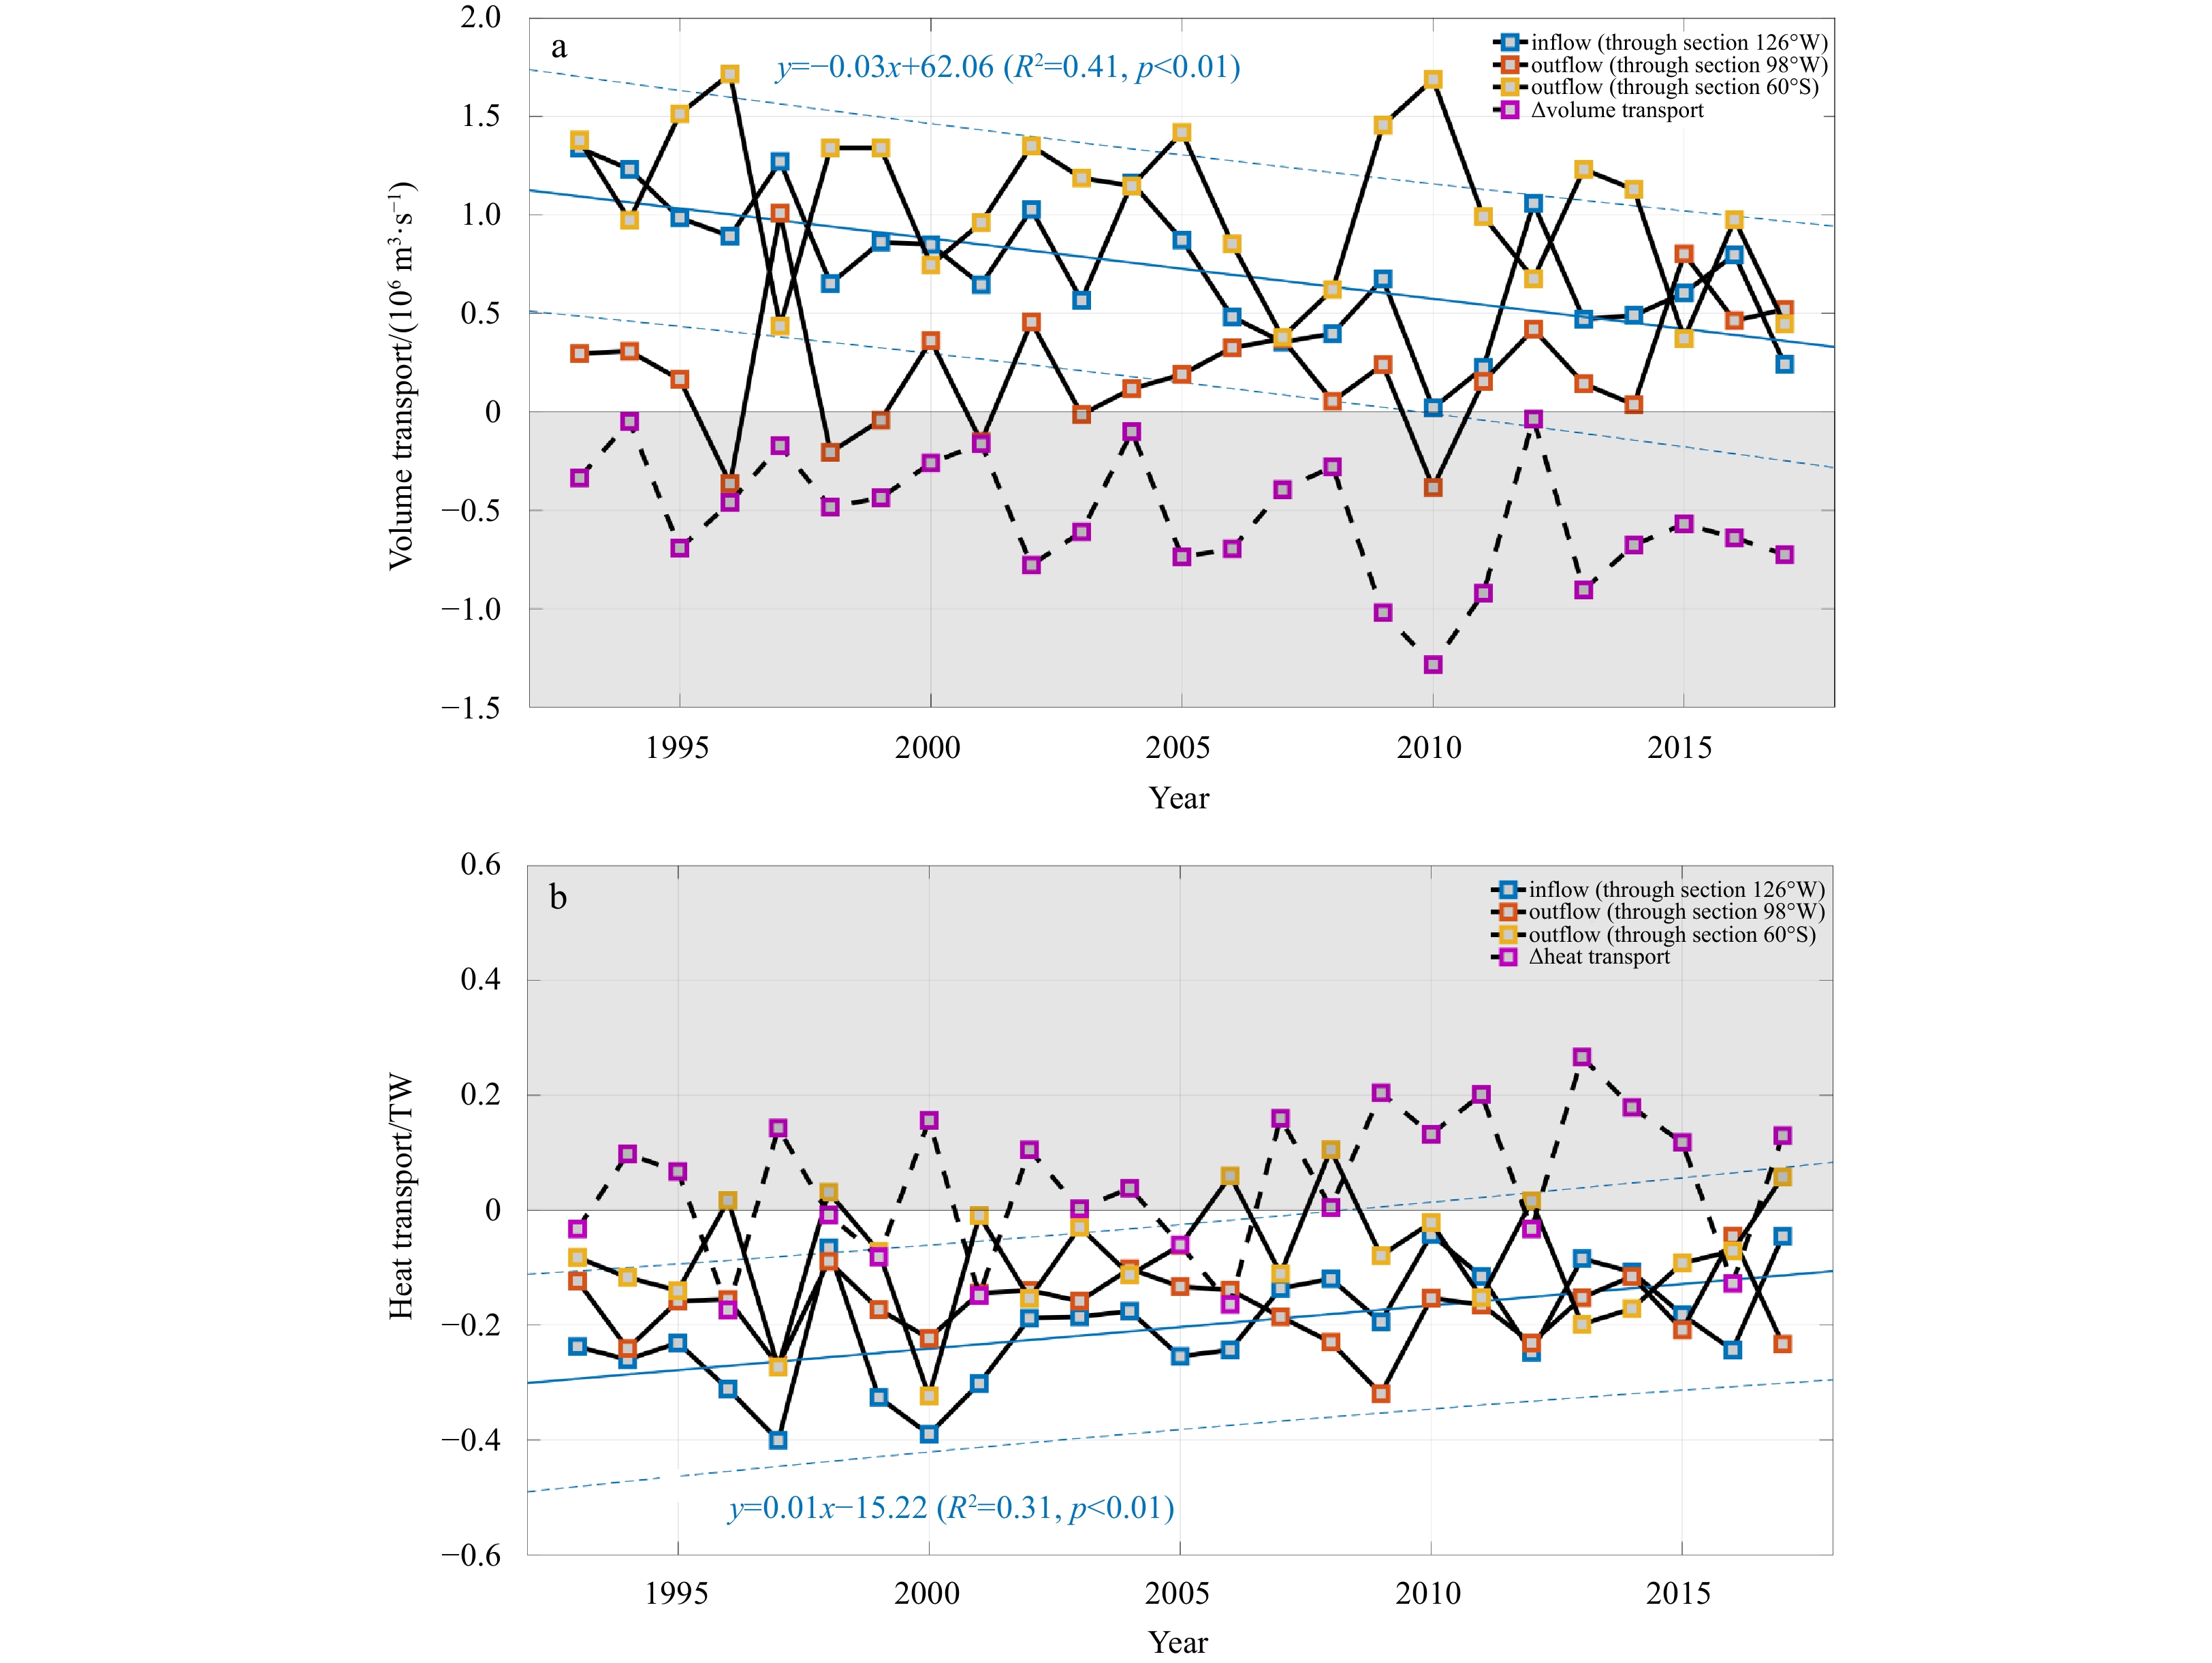
Antarctic Bottom Water (AABW) plays an important role in the meridional overturning circulation and contributes significantly to global heat transport and sea level rise (SLR). Based on the Global Ocean (1/12)° Physical Reanalysis (GLORYS12V1) products and conductivity-temperature-depth instrument data from the World Ocean Circulation Experiment hydrographic program, we analyzed the trends in the thickness, volume, temperature, salinity, and neutral density of the AABW in the Amundsen Sea from 1993 to 2017. Over the past 25 years, the volume has decreased by 3.45×10¹² m3/a, thinning at a rate of 5 m/a. In the vertical direction, the contraction of the AABW is compensated by the volume expansion of the Circumpolar Deep Water. As the volume of AABW decreases, the temperature of the AABW increases by about 0.002°C/a. This warming is equivalent to a heat flux of 0.27 W/m2. A local SLR is produced due to thermal expansion of 0.35 mm/a. During the study period, the neutral density decreased by 0.000 3 kg/(m3∙a) due to warming. In the horizontal direction, the volume of AABW flowing from the Ross Sea into the Amundsen Sea gradually decreases and the temperature of the AABW increases continuously. The horizontal transport loss of the AABW volume is 4.07×10¹⁴ m3 and the horizontal heat transport results in a 0.03°C increase in the temperature of the AABW.
Article$Marine Chemistry
Geochemical speciation and spatial distributions of phosphorus in surface sediments from the basin of the Marcus-Wake seamounts in the western Pacific Ocean
Chao Yuan, Fansheng Meng, Xuying Yao, Jianyu Ni
2022, 41(4): 80-90. doi: 10.1007/s13131-021-1942-8
Abstract:
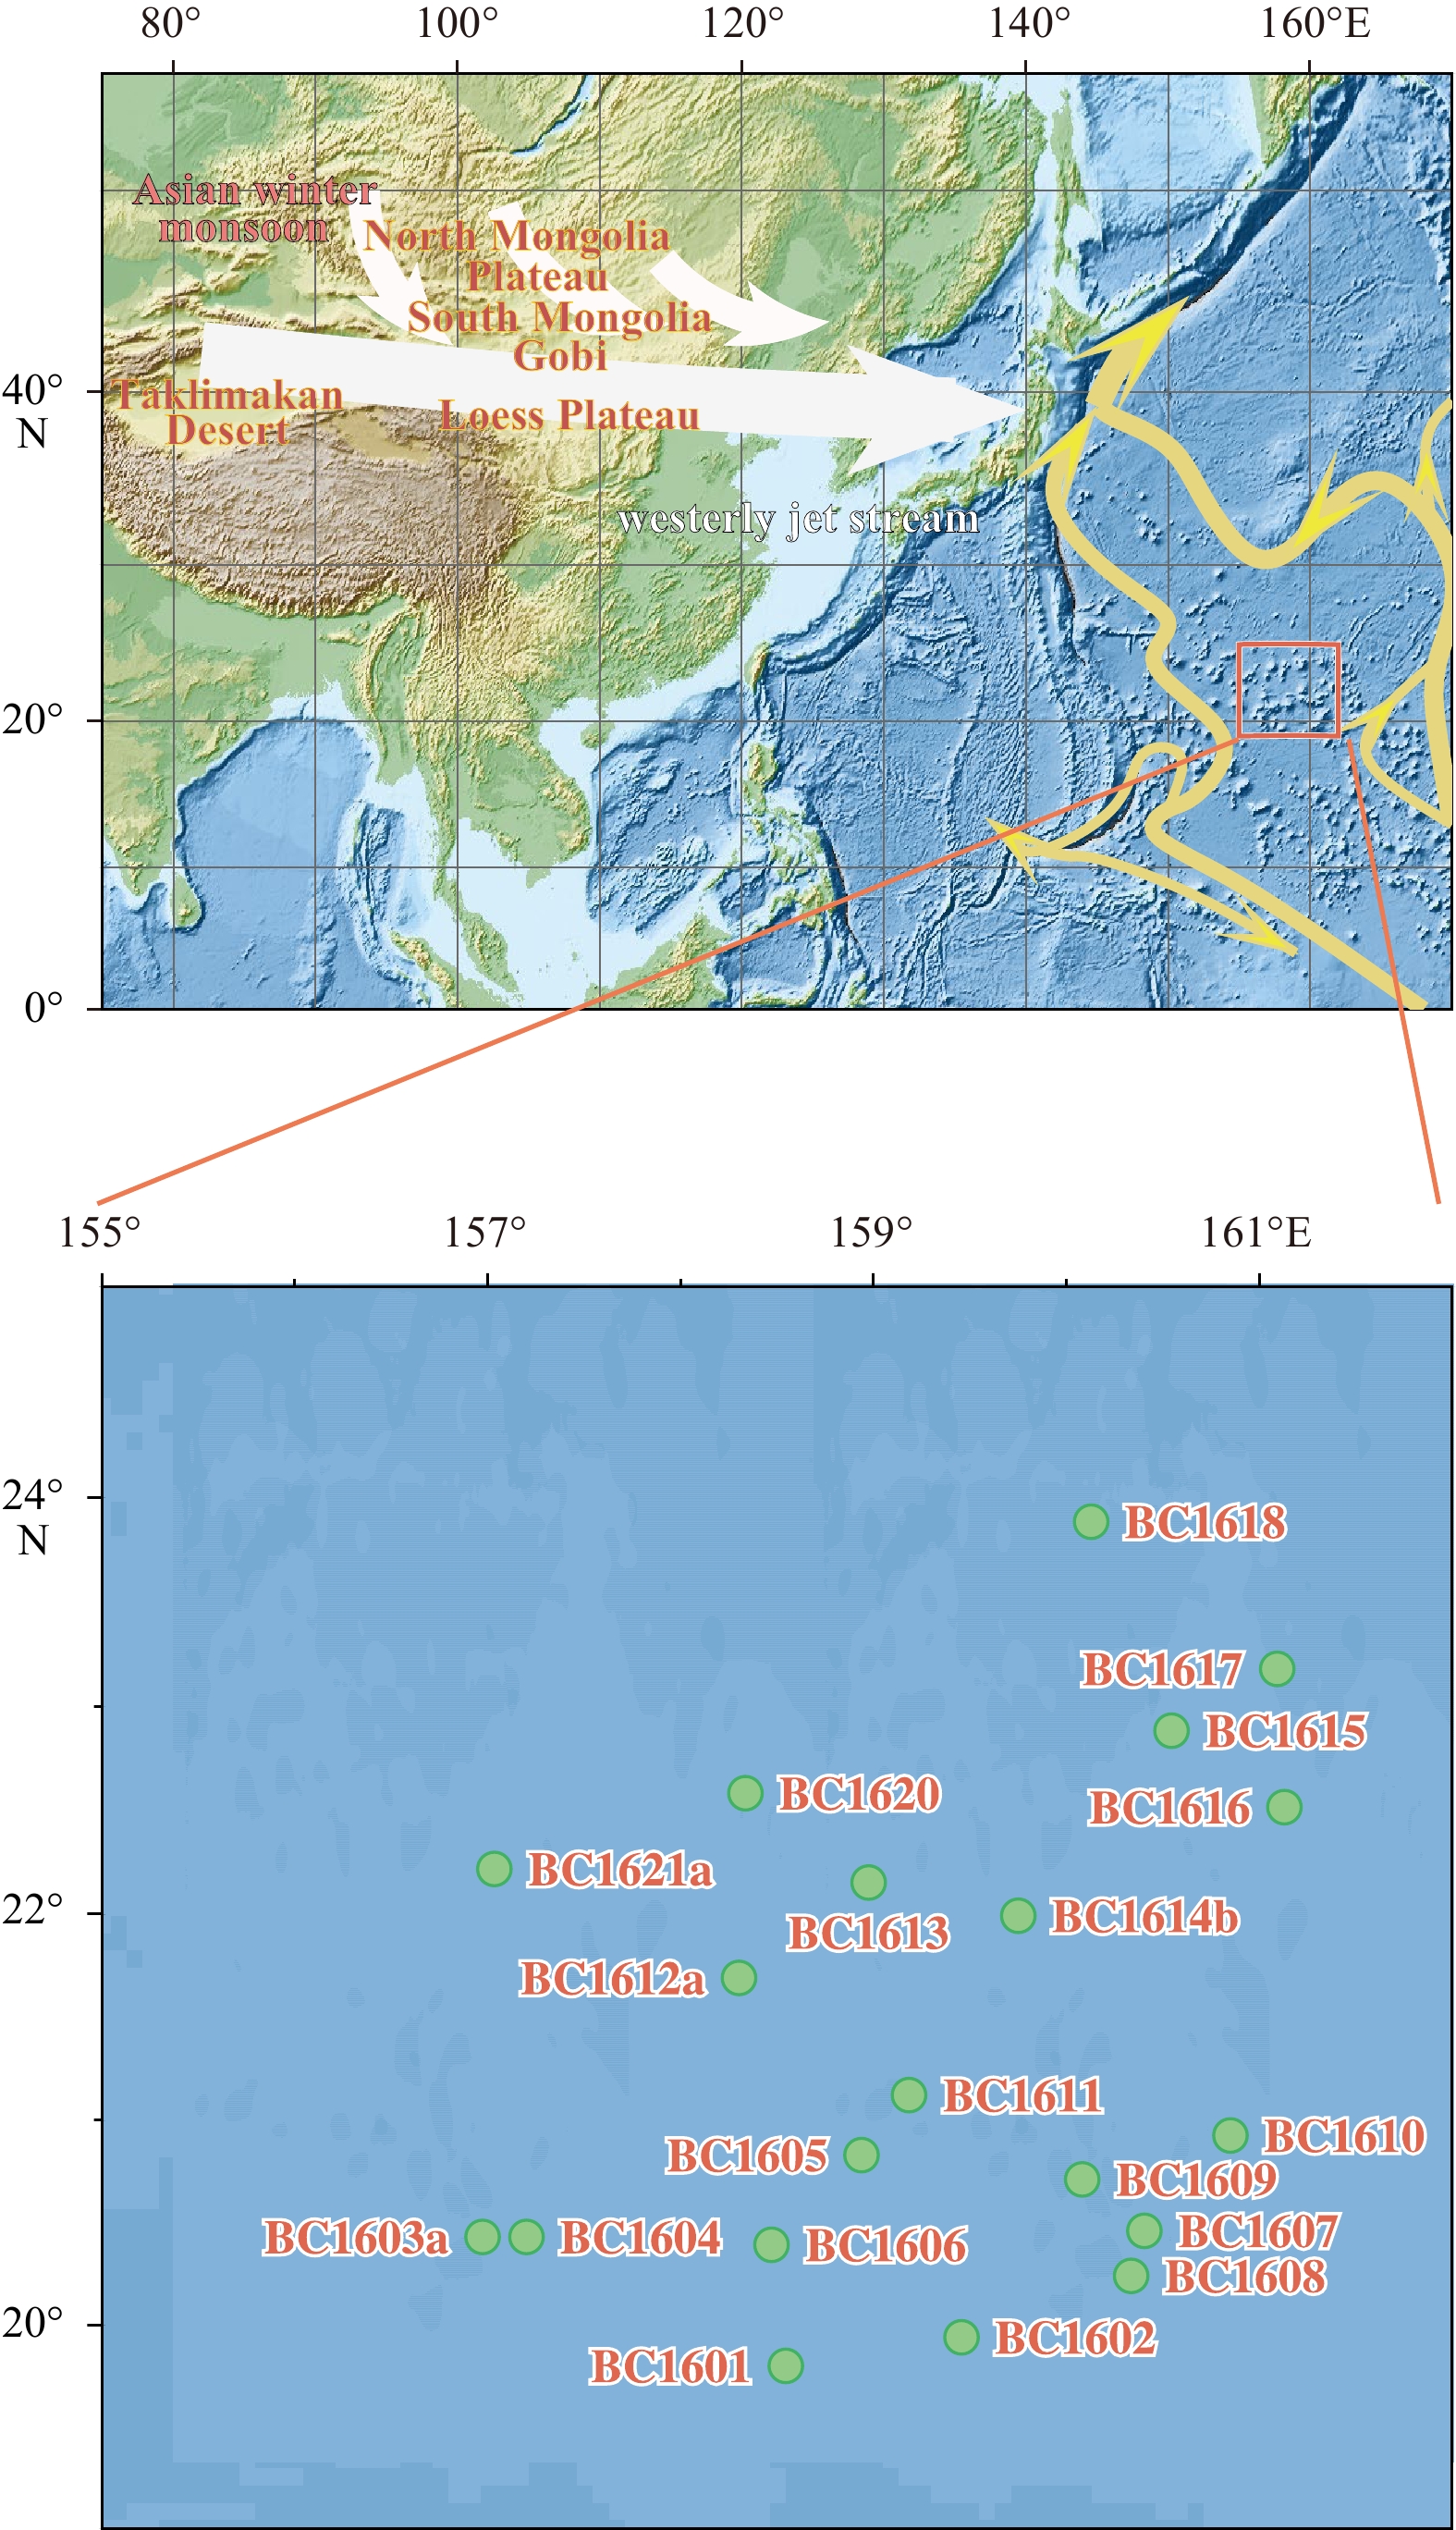
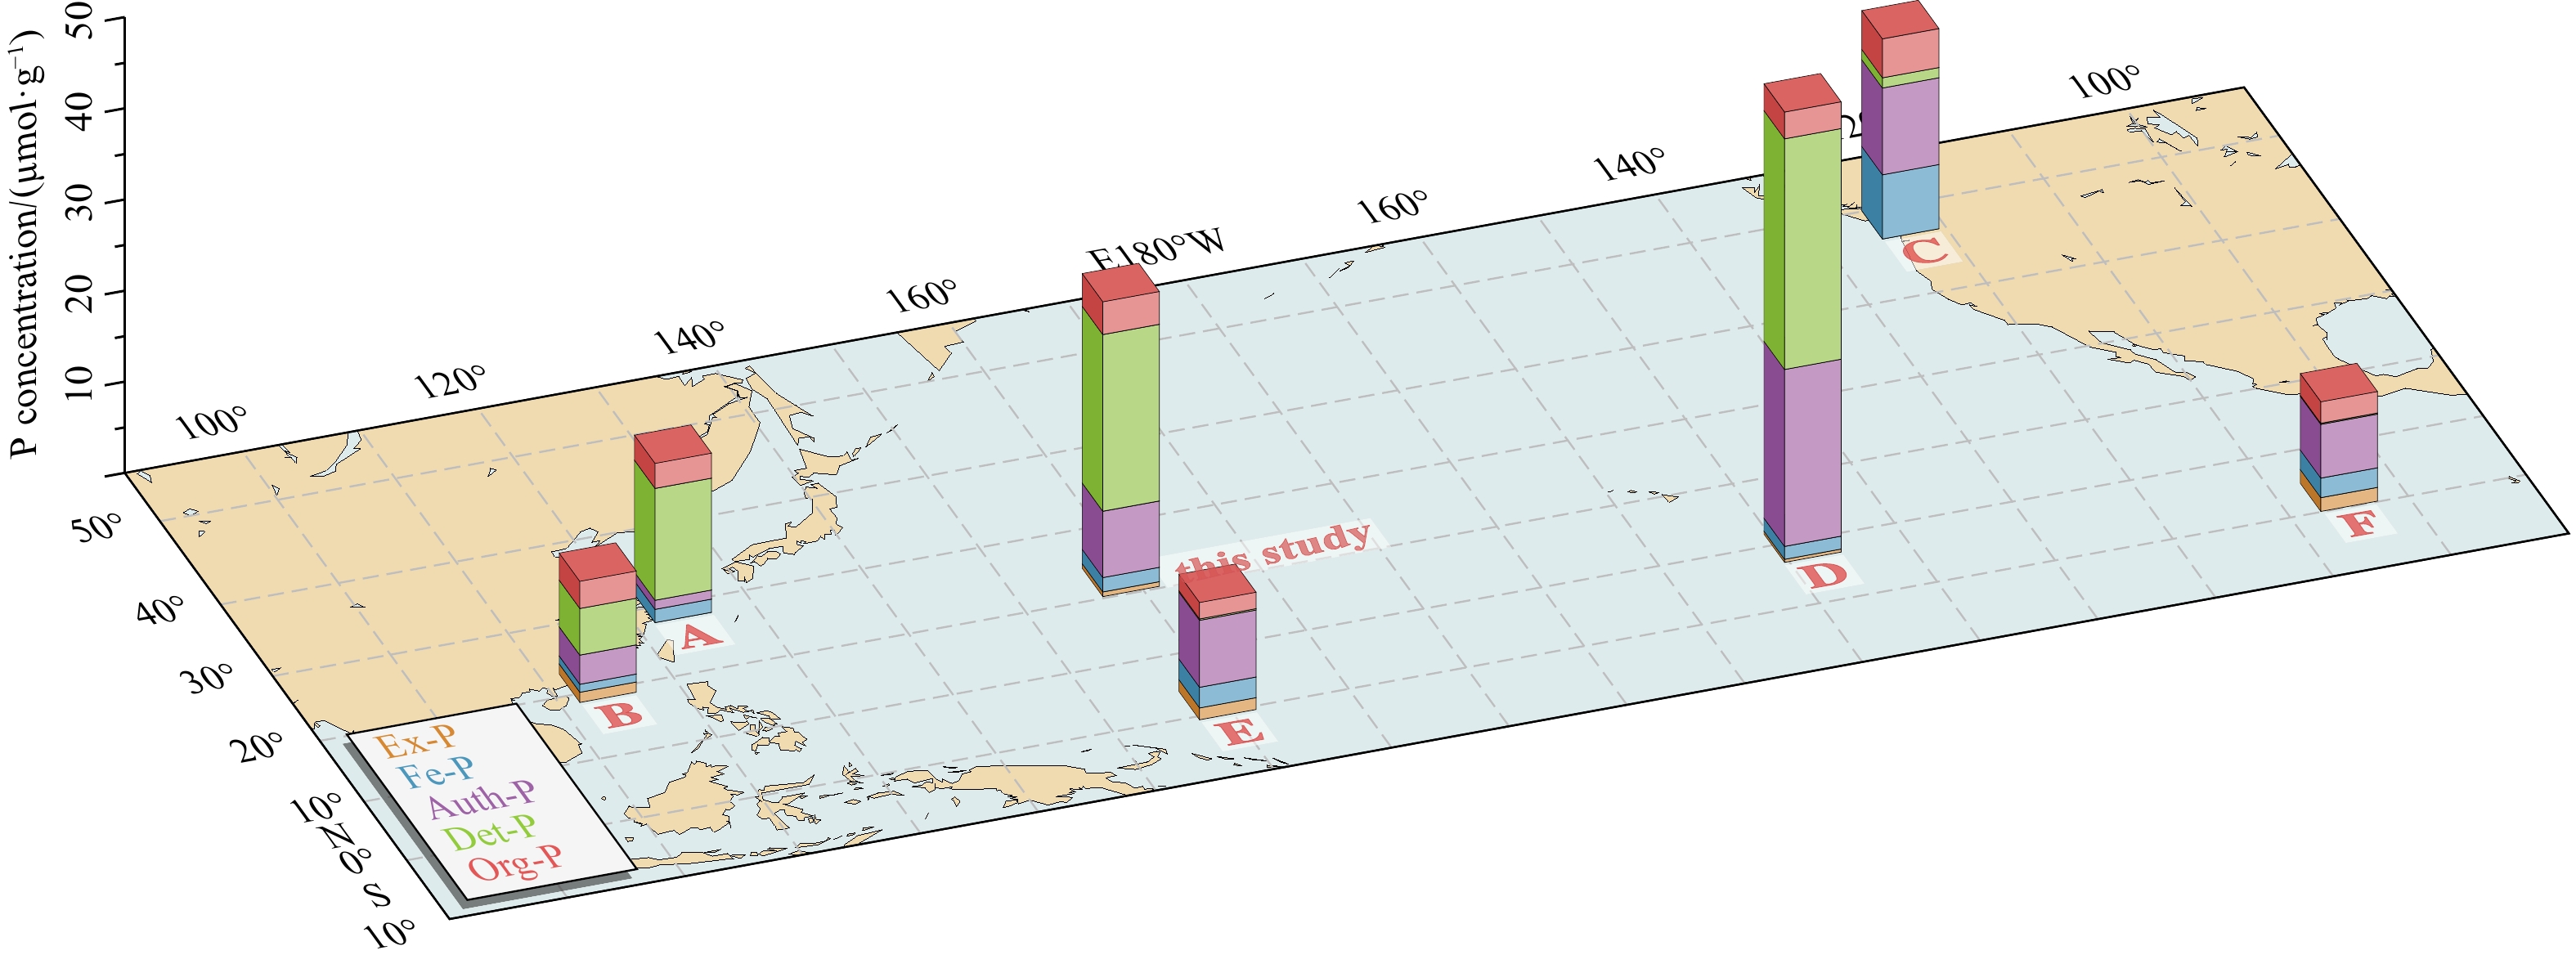
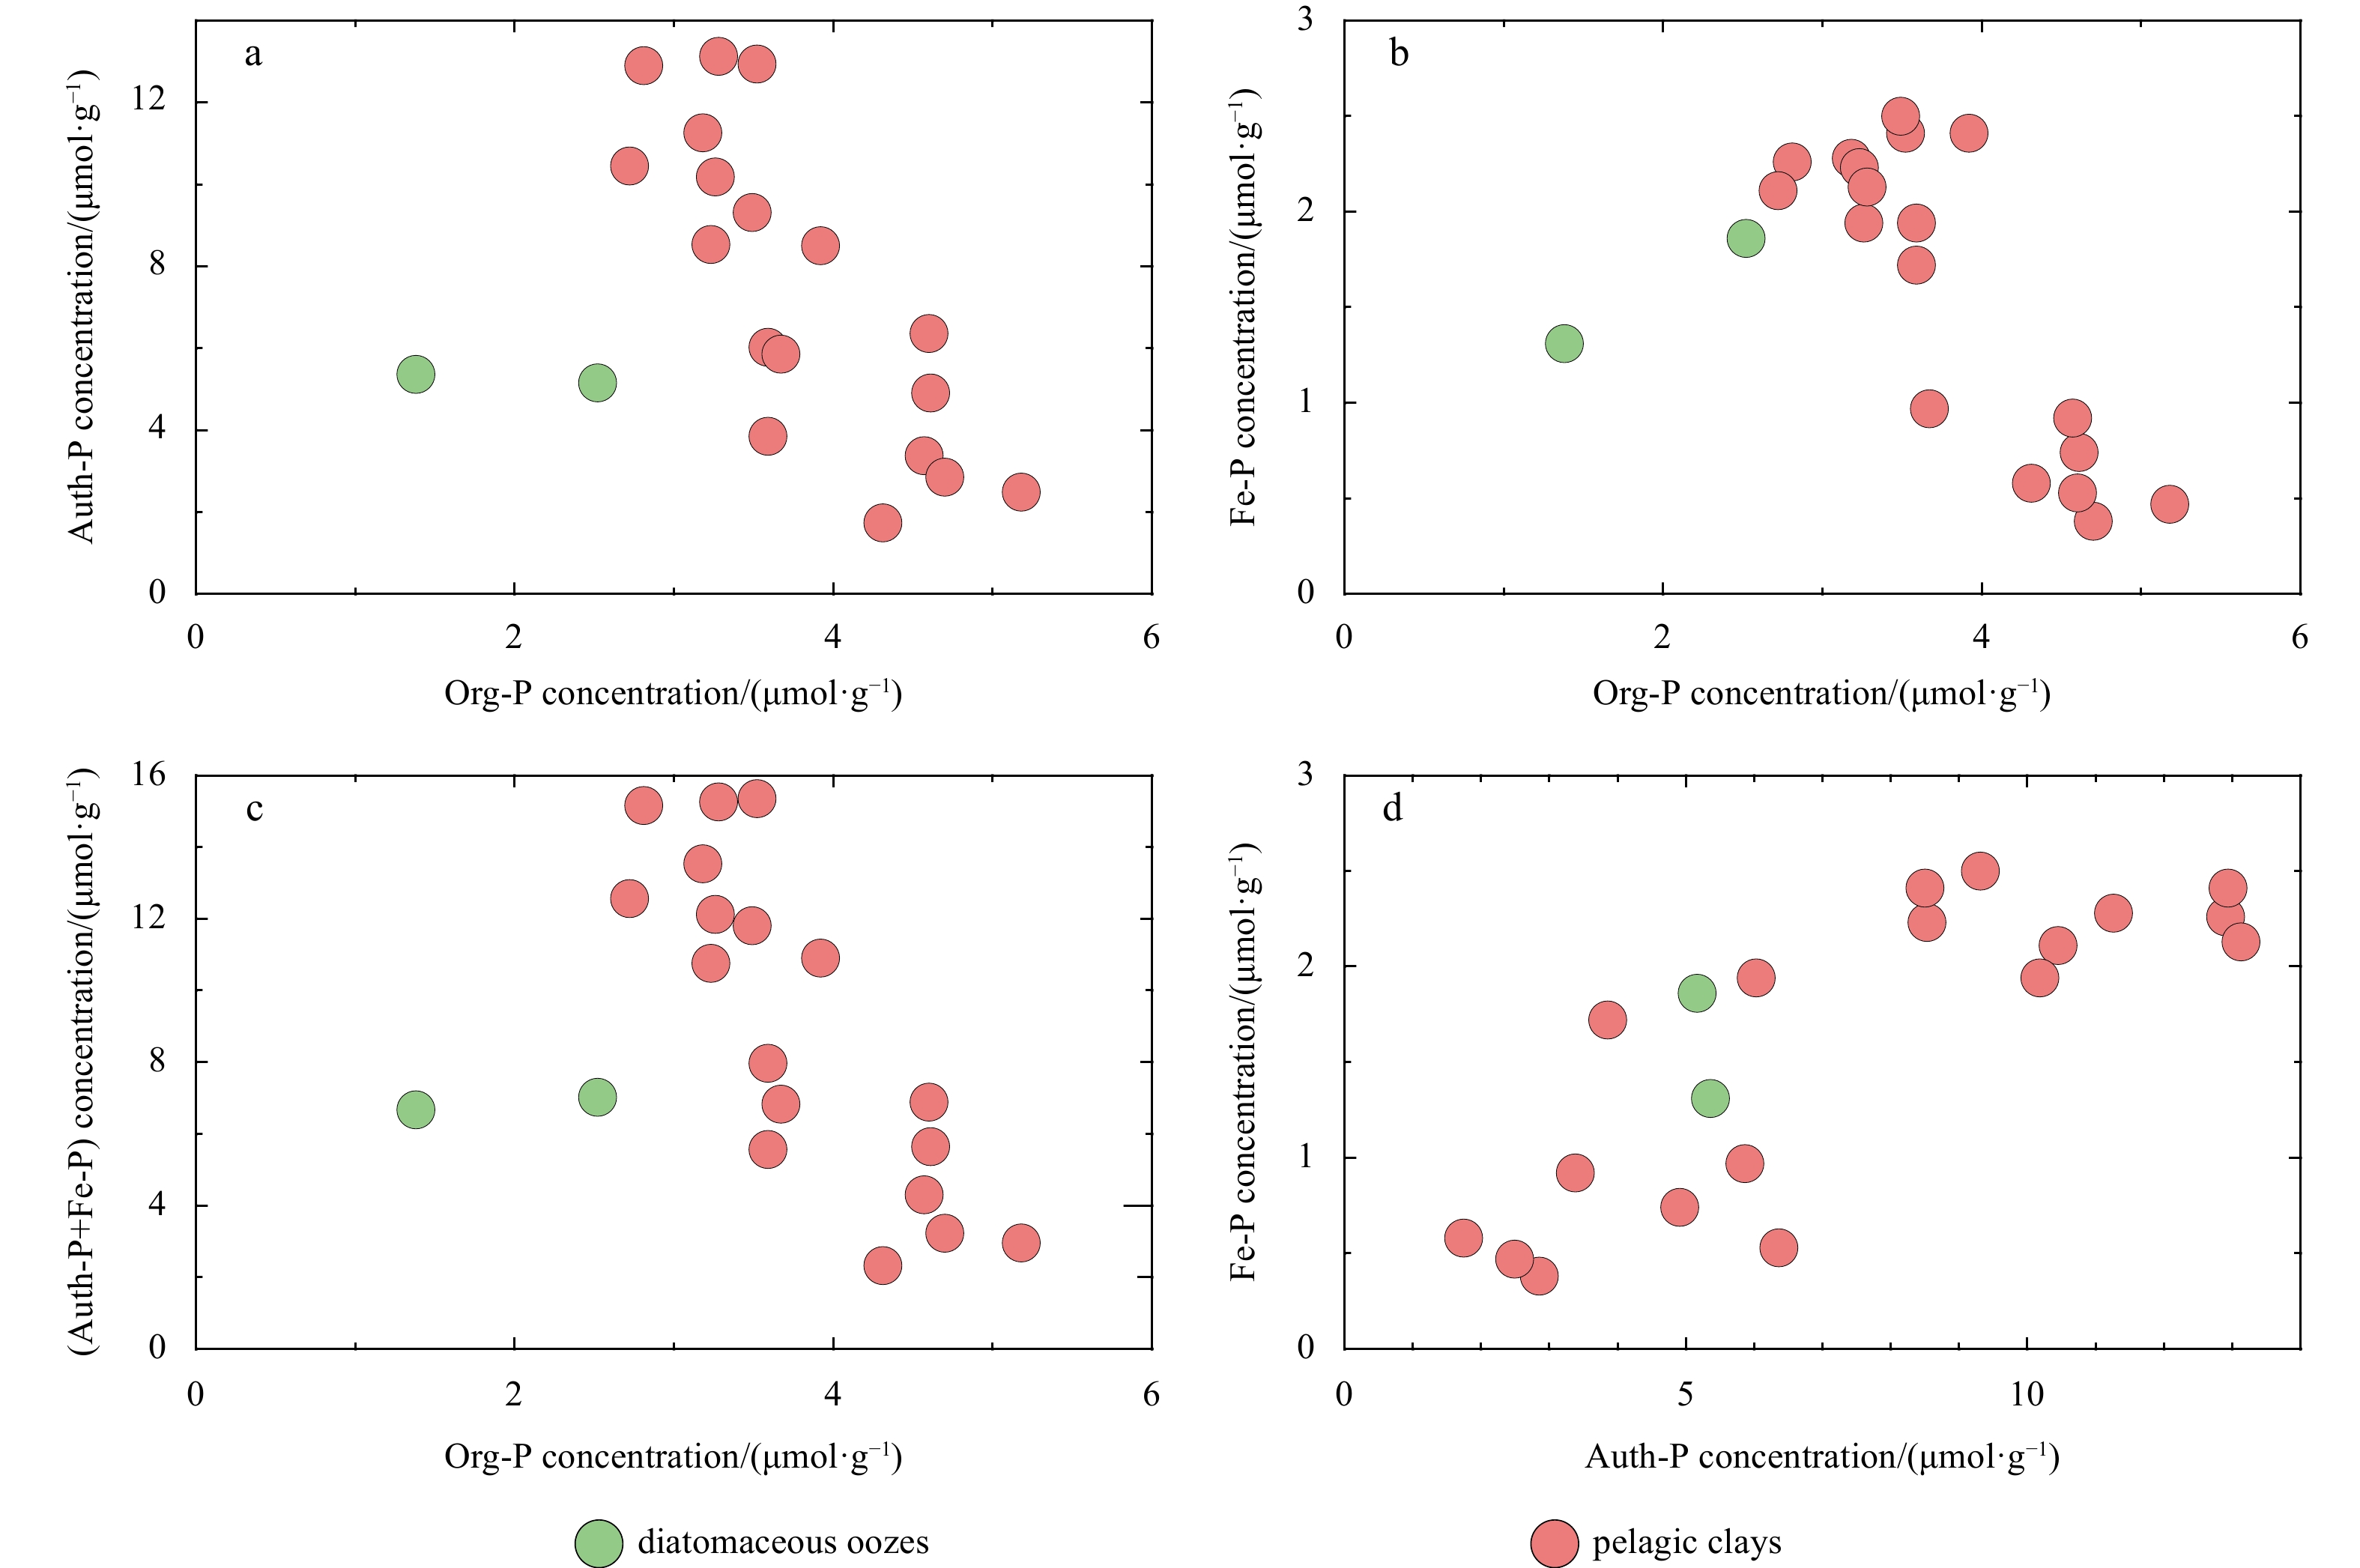
The concentrations of five forms of phosphorus (P) including exchangeable or loosely adsorbed P (Ex-P), Fe-bound P (Fe-P), authigenic P (Auth-P), detrital P (Det-P), and organic P (Org-P) from the basin among the Marcus-Wake seamounts (19.4°–24°N, 156.5°–161.5°E) in the western Pacific Ocean were quantified using a sequential extraction method (SEDEX) to investigate the distribution and sources of different P species. Concentrations of total P (TP) varied from 14.0 μmol/g to 44.1 μmol/g, with an average of (32.4±7.7) μmol/g. Inorganic phosphorus, which was the major chemical form of sedimentary P, ranged from 12.6 μmol/g to 40.6 μmol/g, while the concentration of Org-P varied between 1.38 μmol/g and 5.18 μmol/g, accounting for 83.4%–93.4% and 6.6%–16.6% of the TP, respectively. The relative proportions of the five P species followed the order of Det-P>Auth-P>Org-P>Fe-P>Ex-P. On average, Det-P was the major P sink resulted from the atmospheric input and accounted for approximately 58.9%±12.4% of the TP. Auth-P and Org-P comprised 22.8%±11.4% and 11.5%±3.0% of the TP, respectively, while Fe-P accounted for 5.1%±2.6%. Lastly, Ex-P comprised 1.6%±0.3% of the TP. Org-P exhibited a negative correlation with Fe-P and Auth-P, while Fe-P showed a positive correlation with Auth-P. This indicated that the formation of Fe-P and Auth-P was at the expense of the regeneration or remineralization of Org-P during early diagenesis. High concentrations of Det-P and Auth-P as well as a low ratio of total organic C to reactive P (TOC/Rea-P) suggested that the aeolian input may play a significant role in sedimentary P budget in the study area. Additionally, well-oxygenated bottom water and low sedimentation rate could be responsible for the low TOC/Org-P ratio in the sediment.
Article$Marine Geology
Experiment and analysis of the formation, expansion and dissipation of gasbag in fine sediments based on pore water pressure survey
Shiyun Lei, Xiujun Guo, Haoru Tang
2022, 41(4): 91-100. doi: 10.1007/s13131-021-1851-x
Abstract:
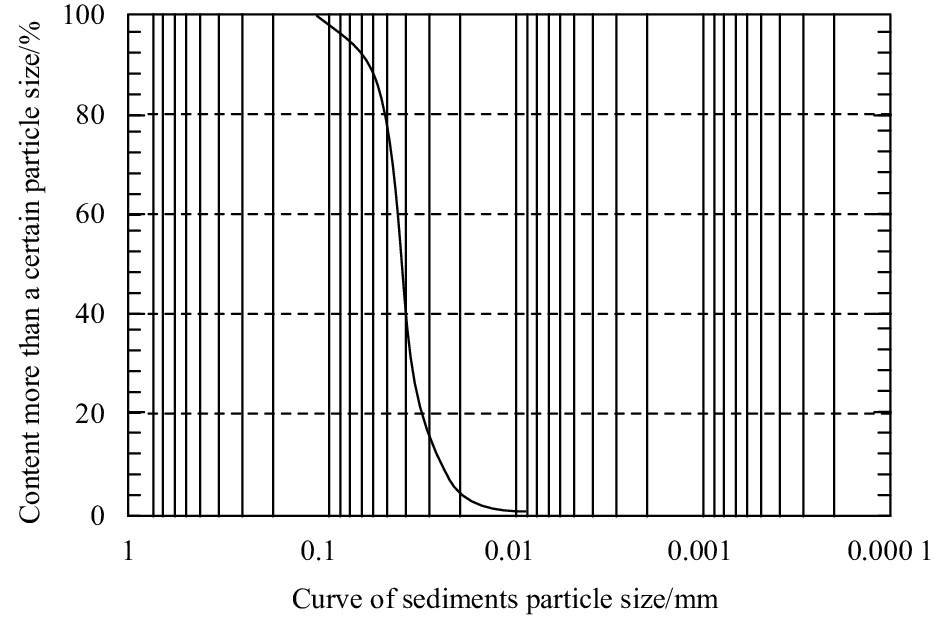
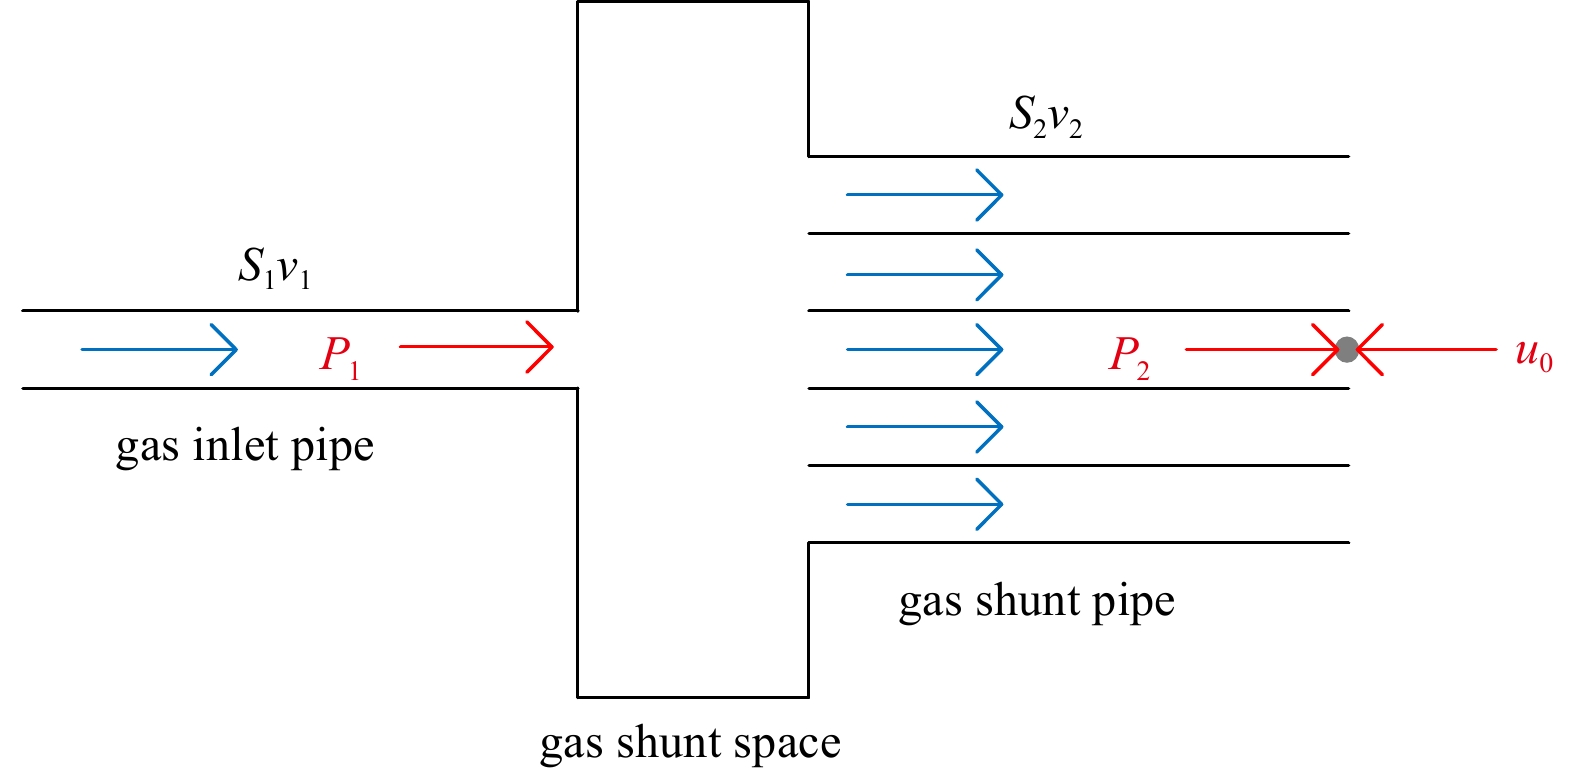
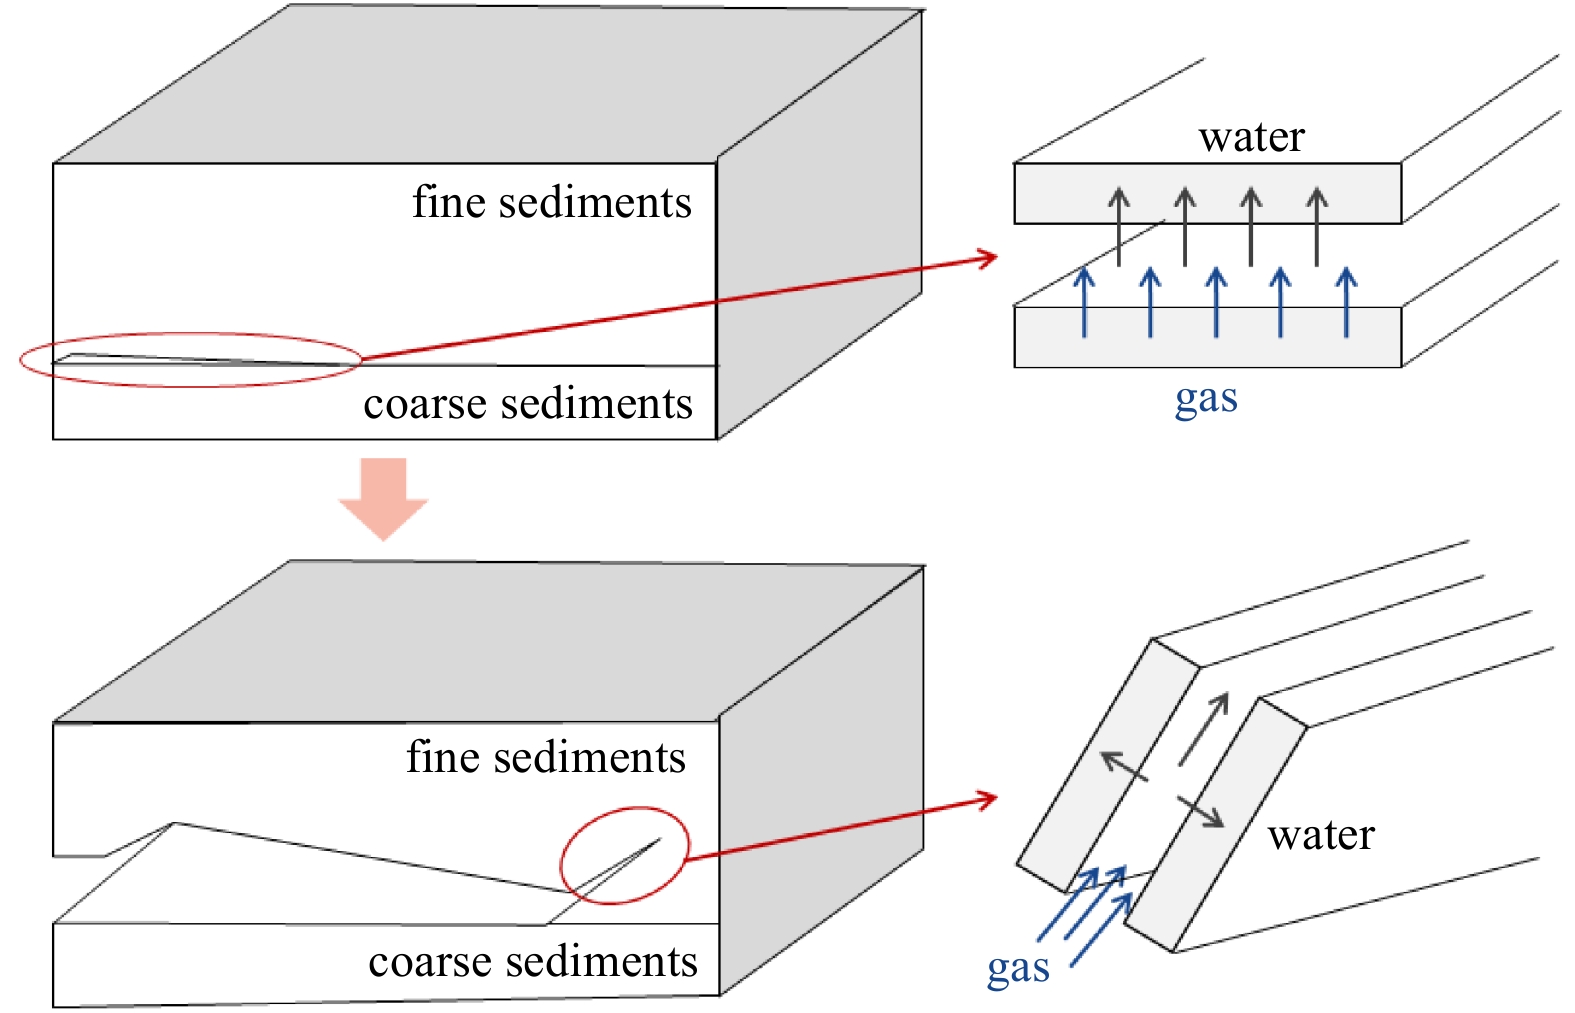
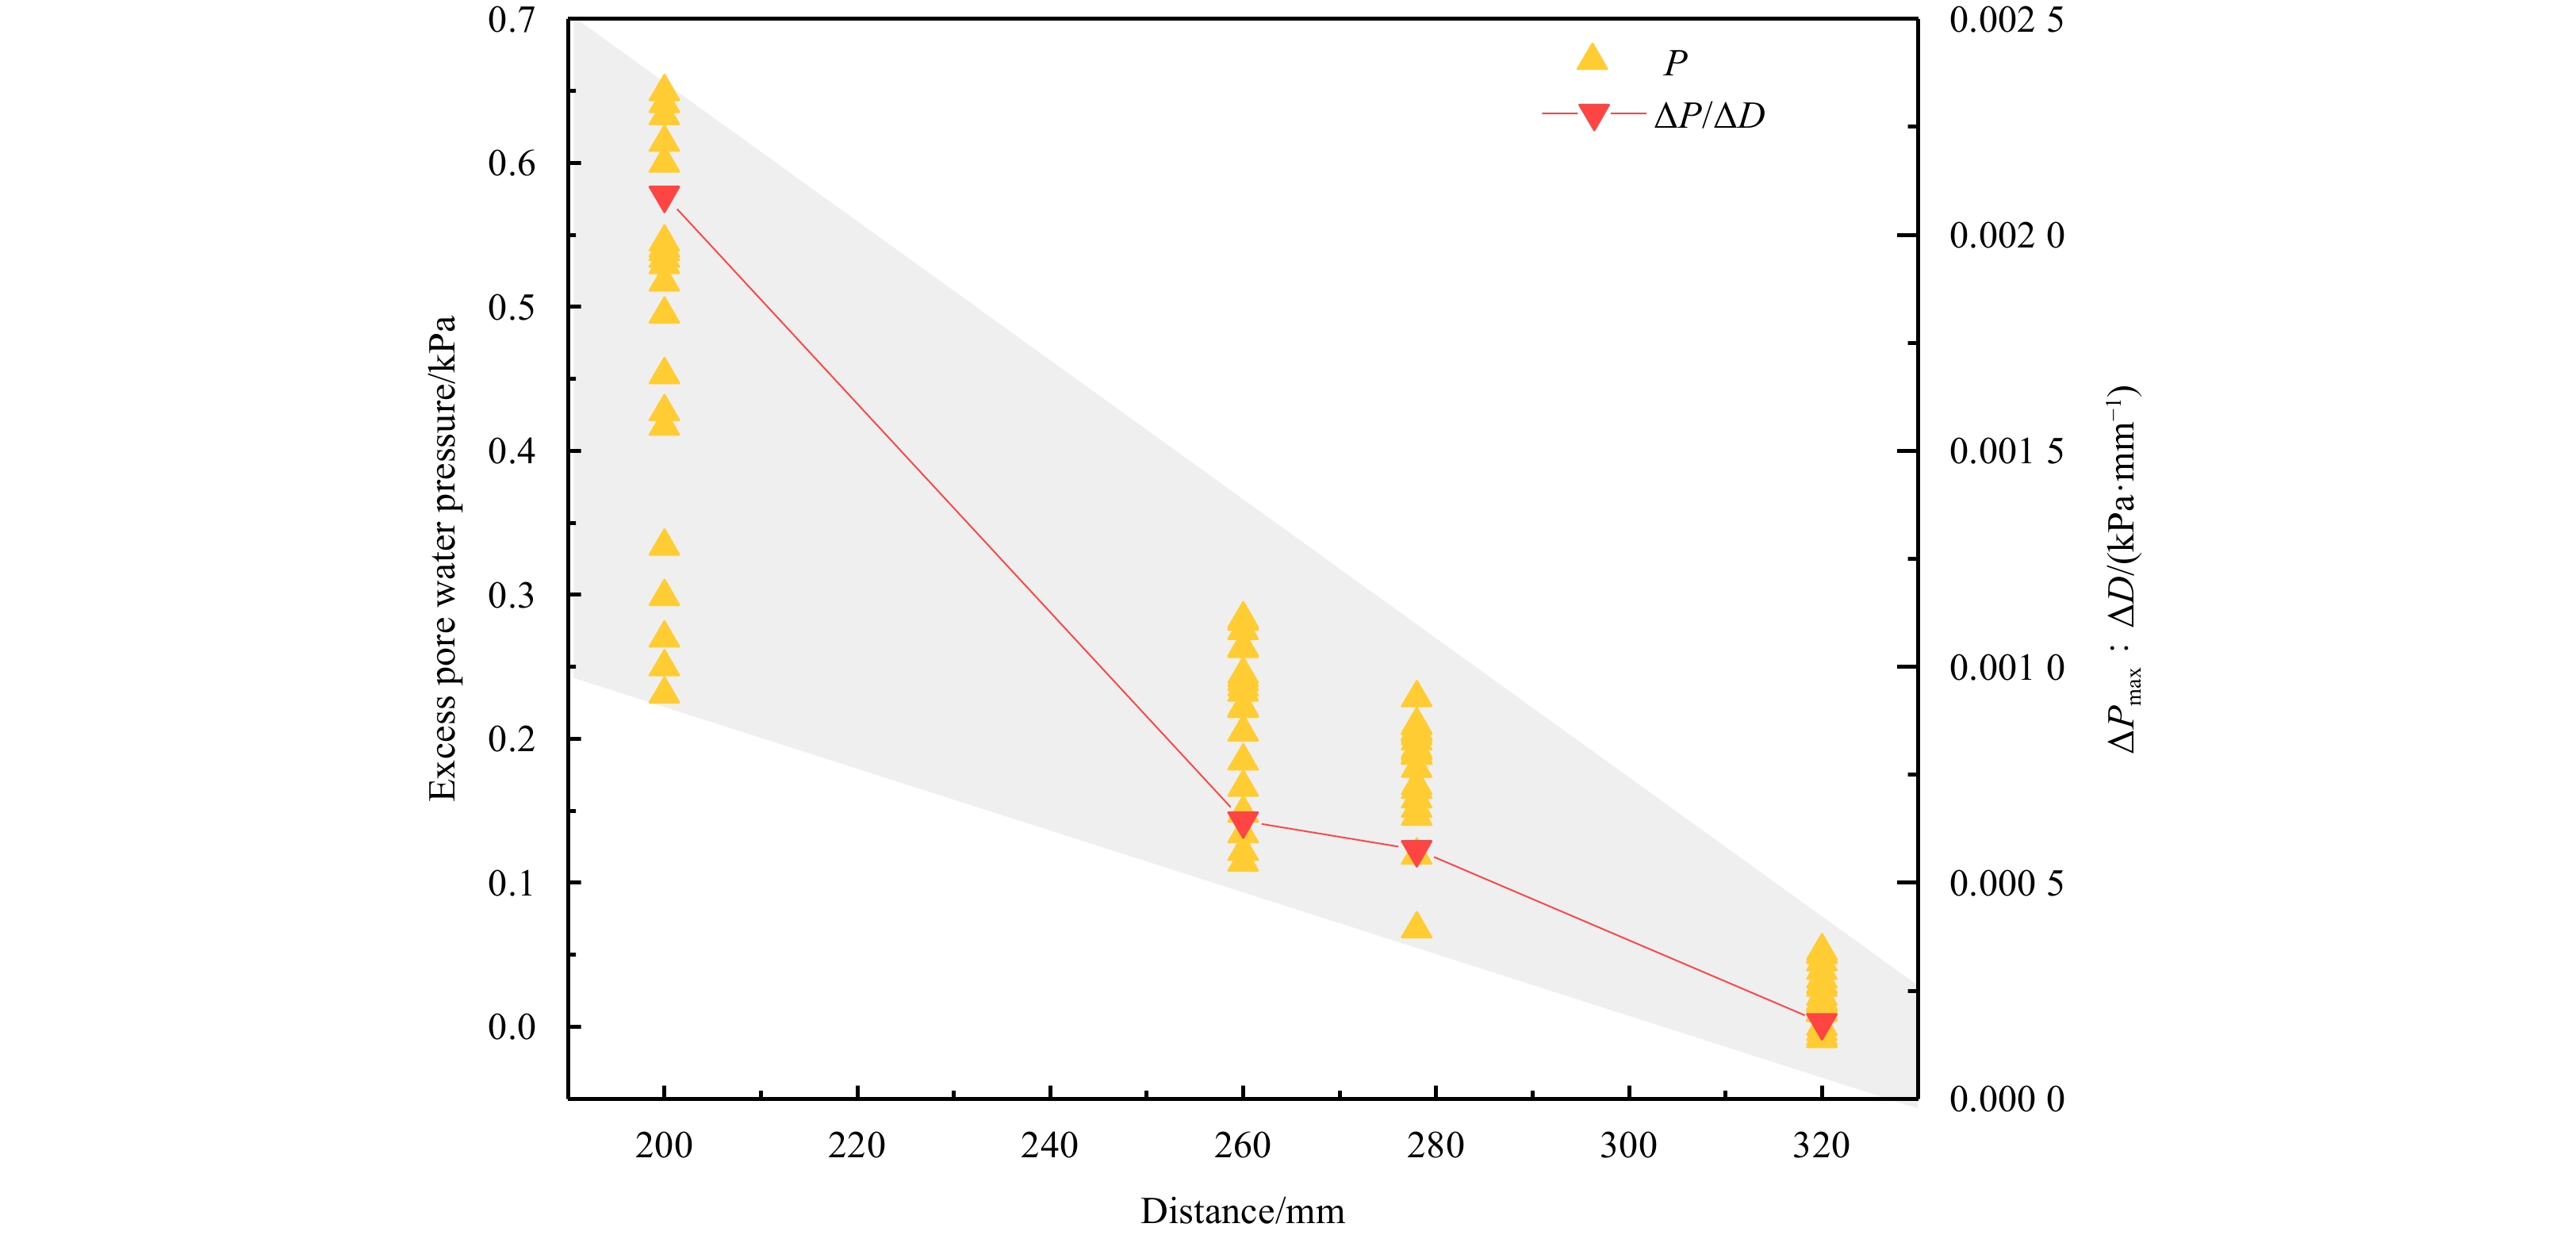
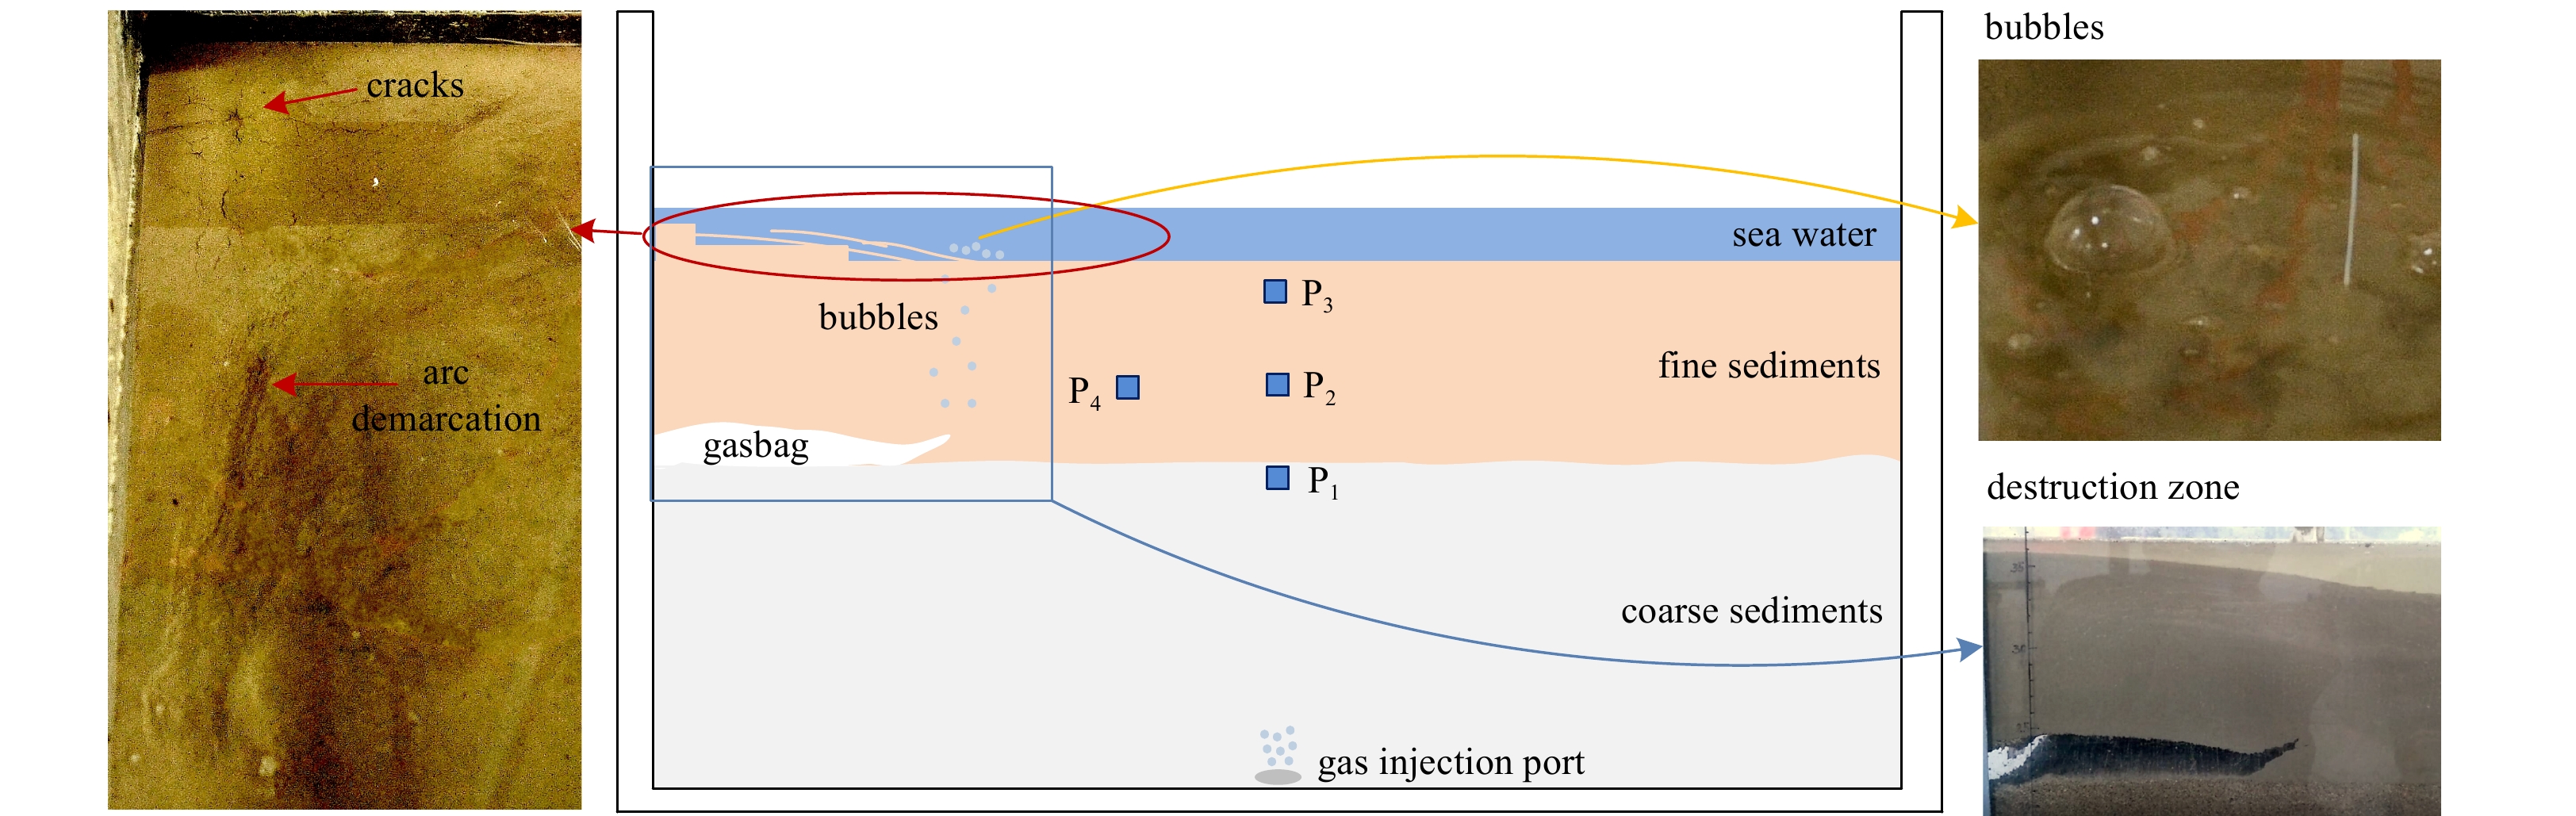
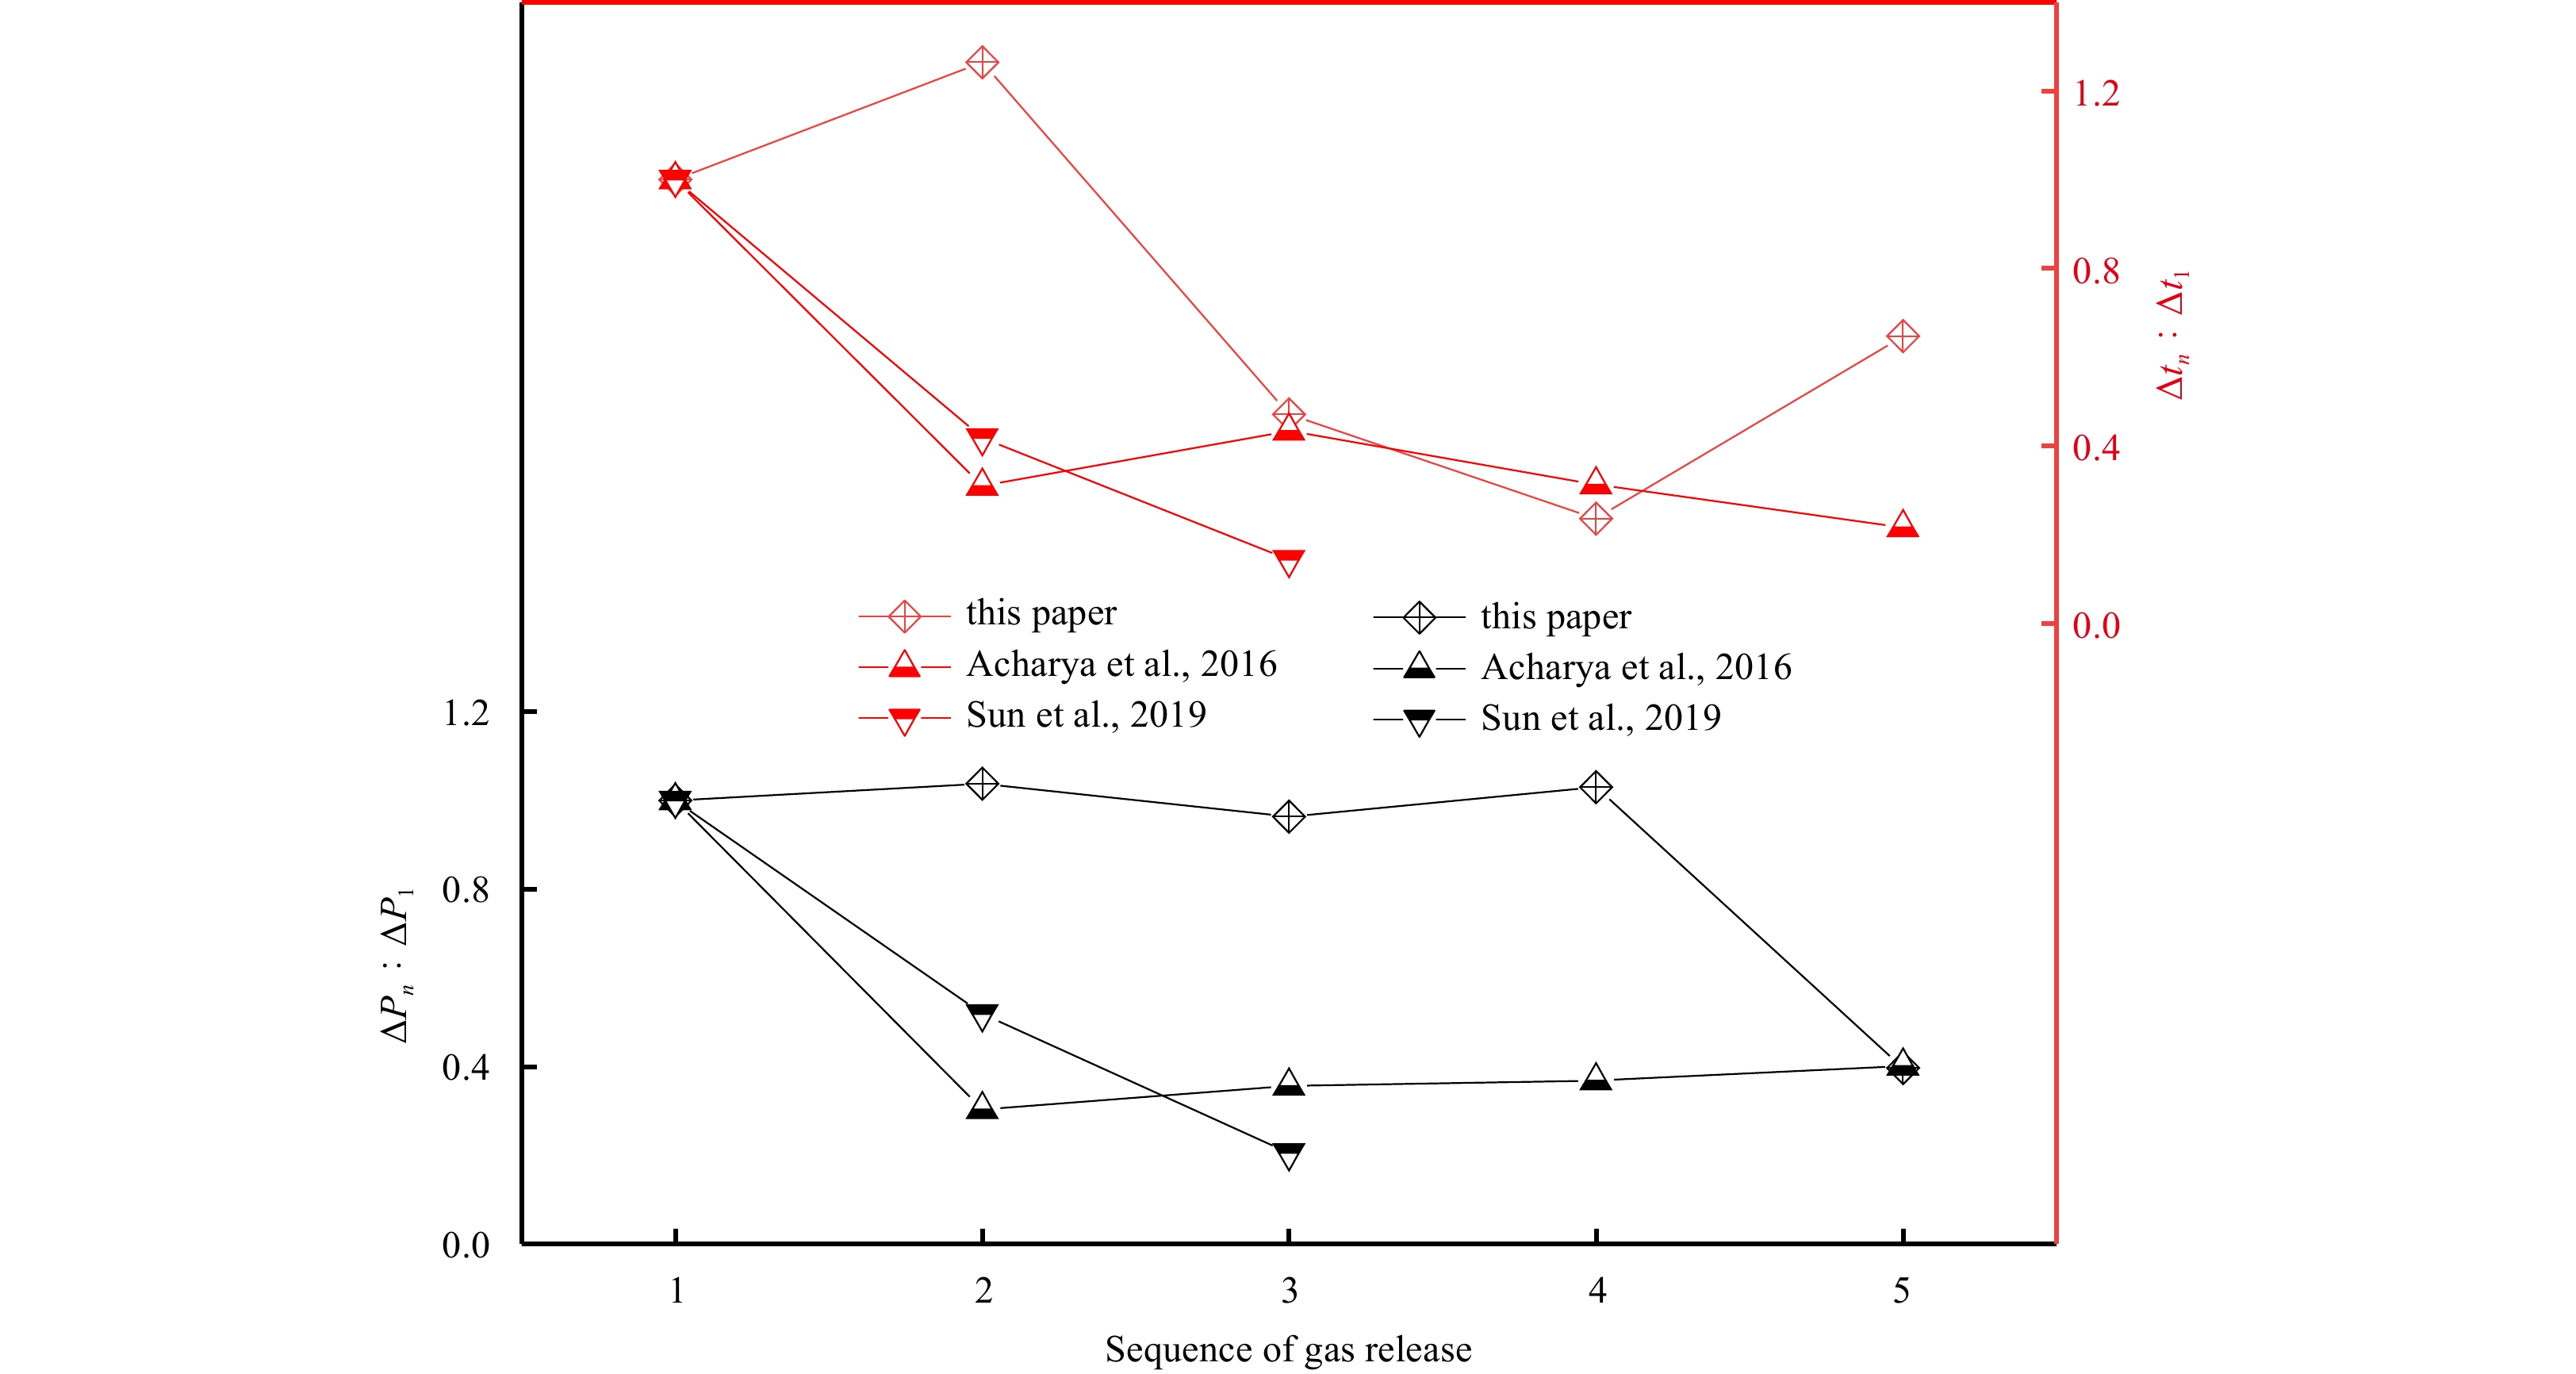
Deep-seated gas in seabed sediments migrates upwards from effect of external factors, which easily accumulates to form gasbags at interface of shallow coarse-fine sediments. Real-time monitoring of this process is important to predict disaster. However, there is still a lack of effective monitoring methods, so we attempt to apply multi-points pore water pressure monitoring technology when simulating forming and dissipation of gasbags in sediments through laboratory experiment. This study focuses on discussion of sensitivity of pore water pressure monitoring data, as well as typical changing characteristics and mechanisms of excess pore water pressure corresponding to crack generation, gasbag formation and gas release. It was found that the value of excess pore water pressure in sediments is negatively correlated with vertical distance between sensors and gas source, and the evolution of gasbag forming and dissipation has a good corresponding relationship with the change of excess pore water pressure. Gasbag formation process is divided into three stages: transverse crack development, longitudinal cavity expansion, and oblique crack development. Formation of gasbag begins with the transverse crack at the interface of coarse-fine sediments while excess pore water pressure attenuates rapidly and then drops, pressure remains almost unchanged when cavity expanses longitudinally, oblique crack appeared in final stage of gasbag evolution while excess pore water pressure accumulated and dissipated again. The variation curve of excess pore water pressure in gas release stage has saw-tooth fluctuation characteristics, and the value and time of pressure accumulation are also fluctuating, indicating the uncertainty and non-uniqueness of gas migration channels in sediments.
Article$Ocean Engineering
Forecasting the western Pacific subtropical high index during typhoon activity using a hybrid deep learning model
Jianyin Zhou, Mingyang Sun, Jie Xiang, Jiping Guan, Huadong Du, Lei Zhou
2022, 41(4): 101-108. doi: 10.1007/s13131-021-1965-1
Abstract:
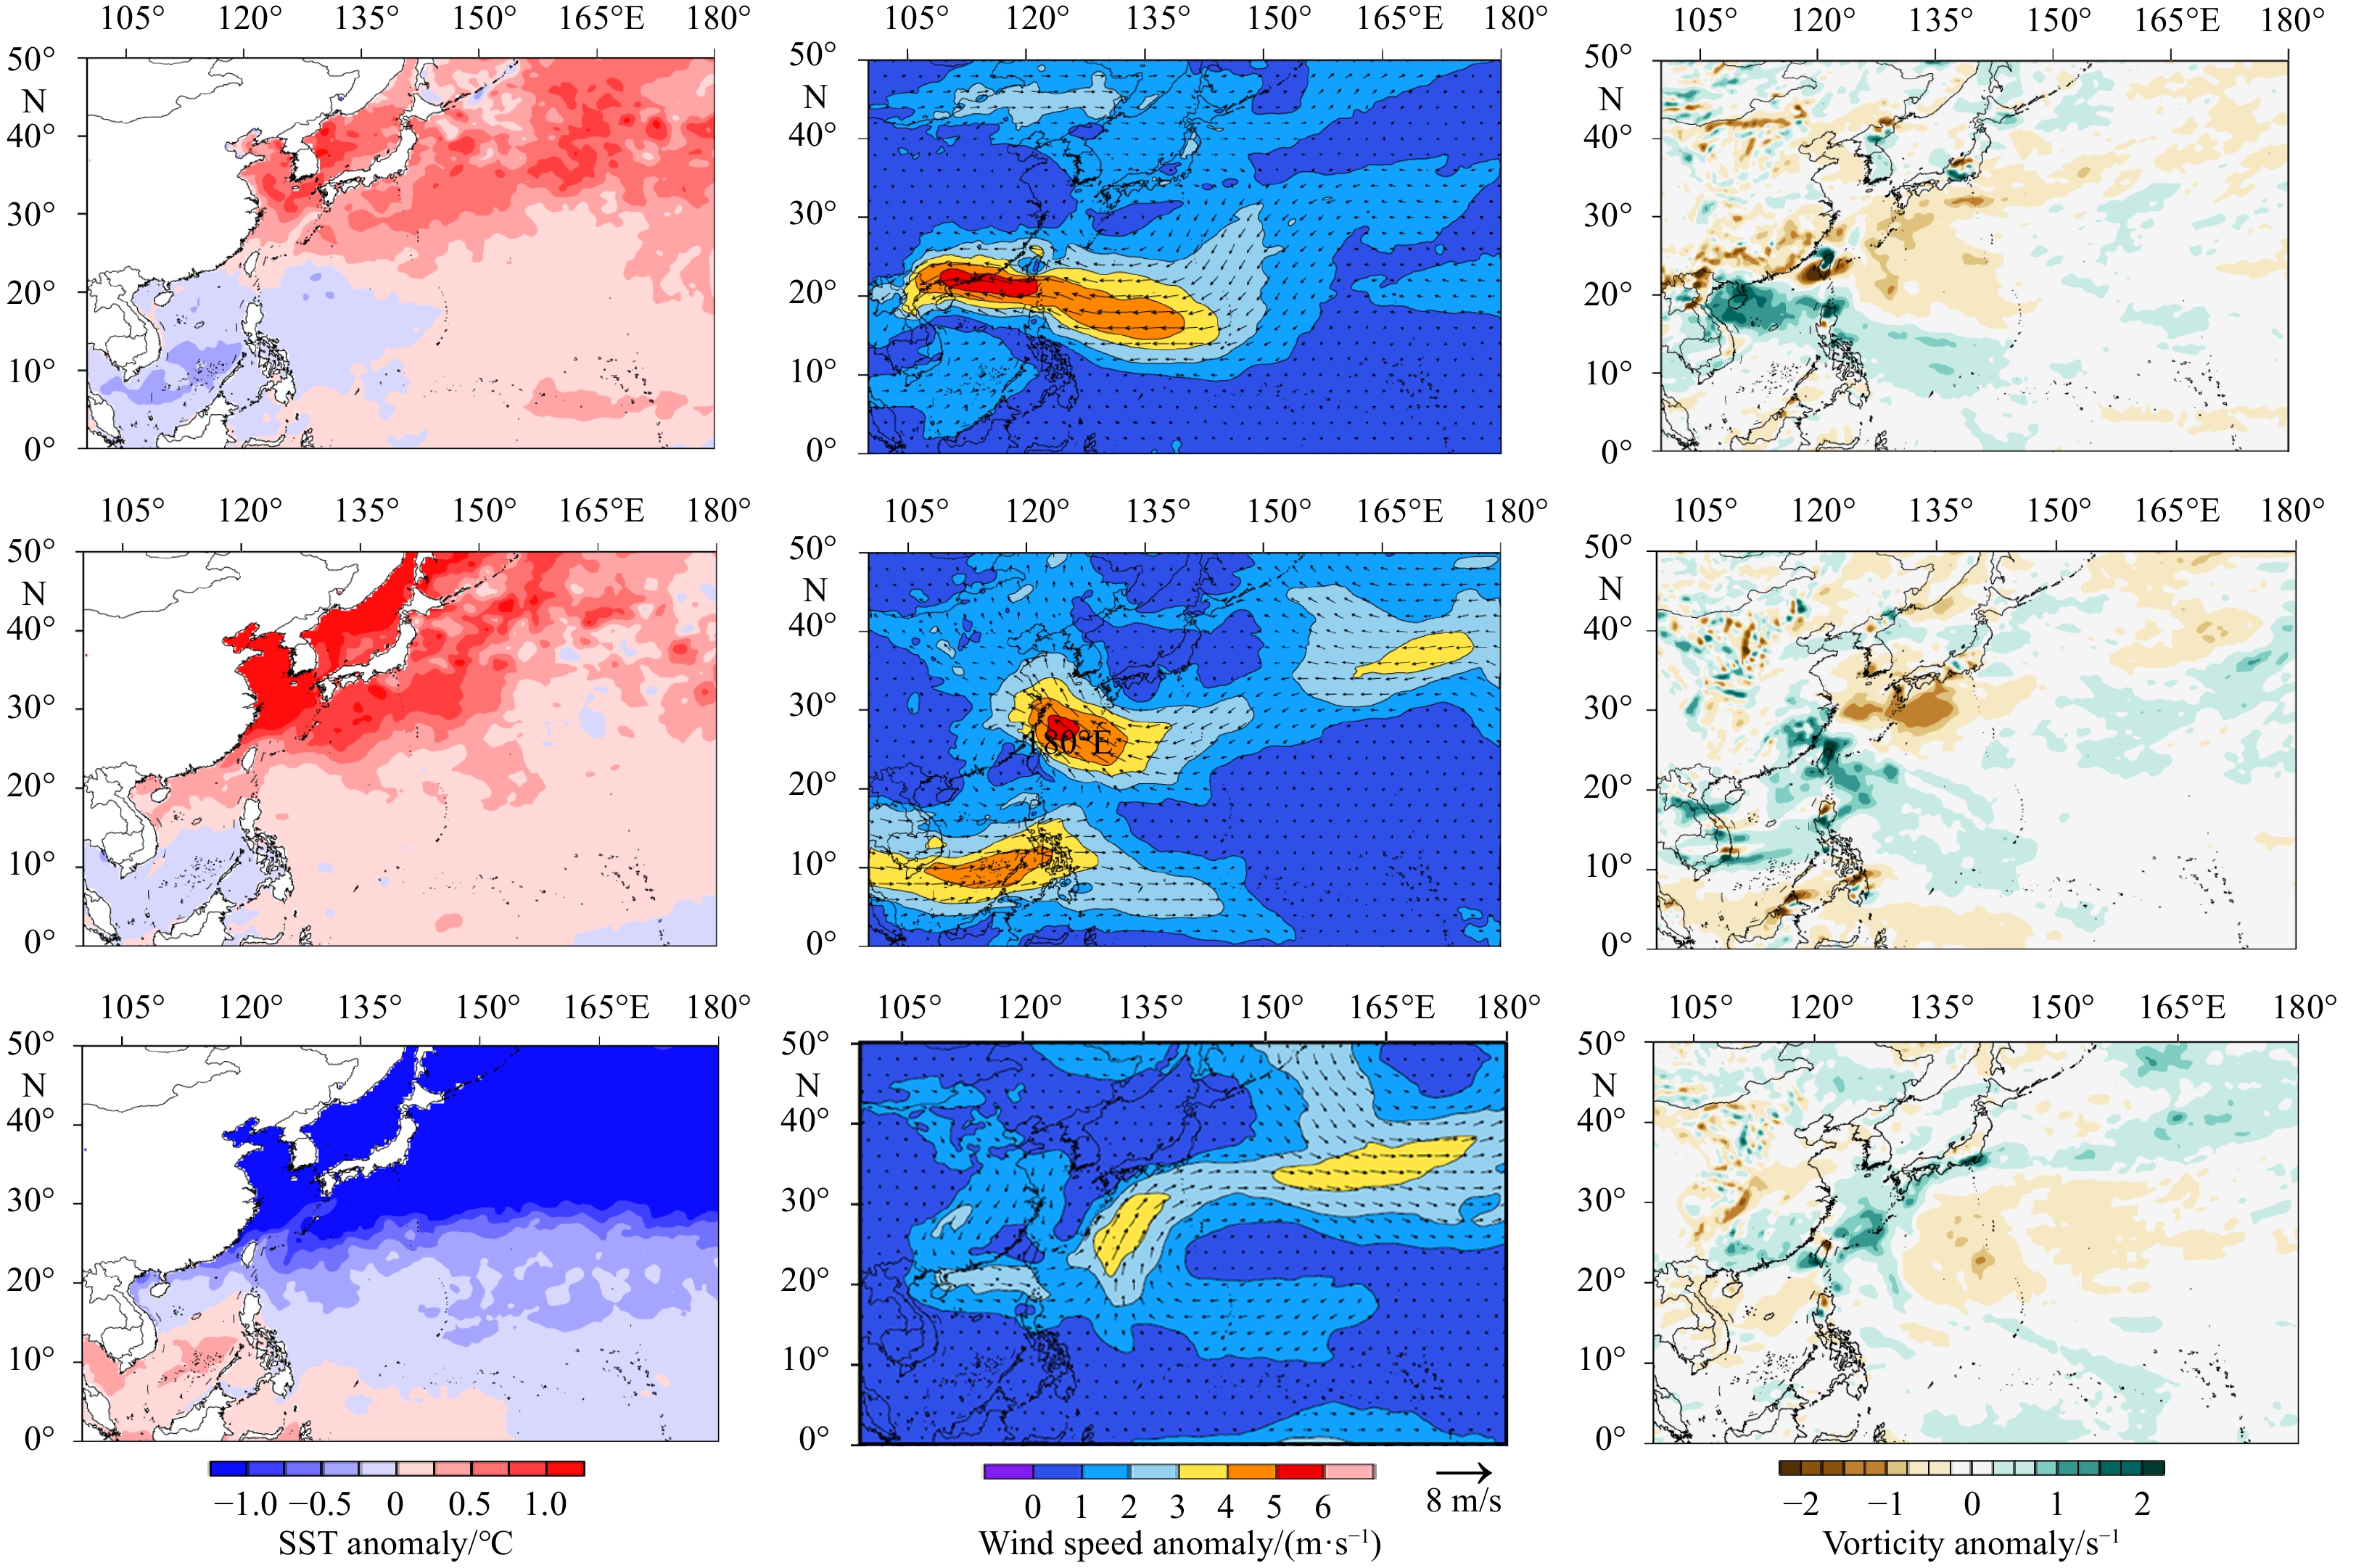
Seasonal location and intensity changes in the western Pacific subtropical high (WPSH) are important factors dominating the synoptic weather and the distribution and magnitude of precipitation in the rain belt over East Asia. Therefore, this article delves into the forecast of the western Pacific subtropical high index during typhoon activity by adopting a hybrid deep learning model. Firstly, the predictors, which are the inputs of the model, are analysed based on three characteristics: the first is the statistical discipline of the WPSH index anomalies corresponding to the three types of typhoon paths; the second is the correspondence of distributions between sea surface temperature, 850 hPa zonal wind (u), meridional wind (v), and 500 hPa potential height field; and the third is the numerical sensitivity experiment, which reflects the evident impact of variations in the physical field around the typhoon to the WPSH index. Secondly, the model is repeatedly trained through the backward propagation algorithm to predict the WPSH index using 2011–2018 atmospheric variables as the input of the training set. The model predicts the WPSH index after 6 h, 24 h, 48 h, and 72 h. The validation set using independent data in 2019 is utilized to illustrate the performance. Finally, the model is improved by changing the CNN2D module to the DeCNN module to enhance its ability to predict images. Taking the 2019 typhoon “Lekima” as an example, it shows the promising performance of this model to predict the 500 hPa potential height field.
The model of tracing drift targets and its application in the South China Sea
Yang Chen, Shouxian Zhu, Wenjing Zhang, Zirui Zhu, Muxi Bao
2022, 41(4): 109-118. doi: 10.1007/s13131-021-1943-7
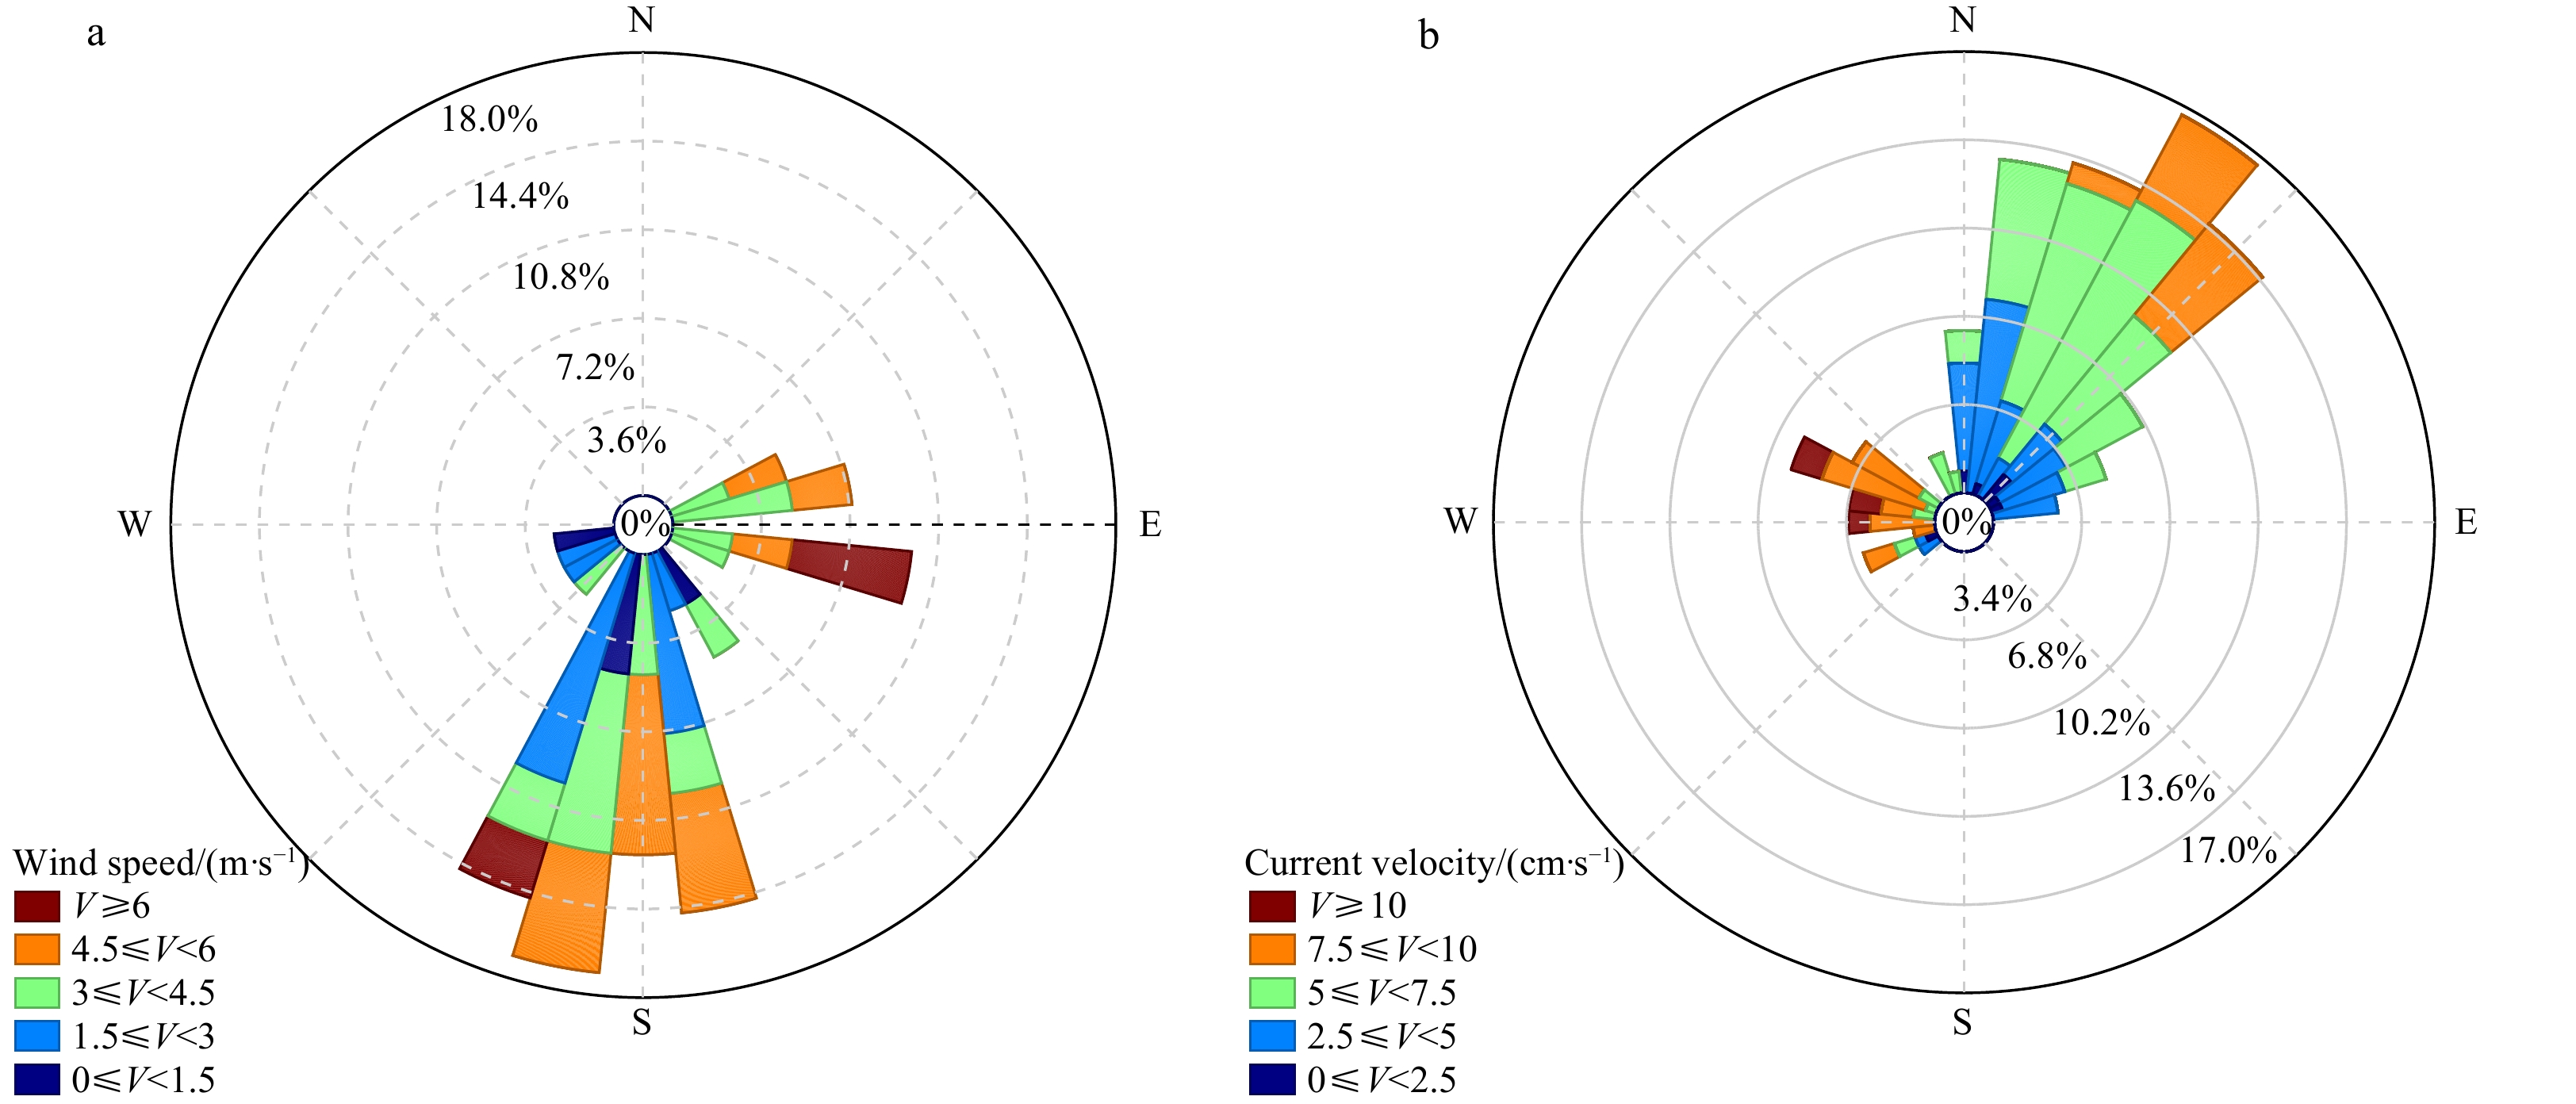
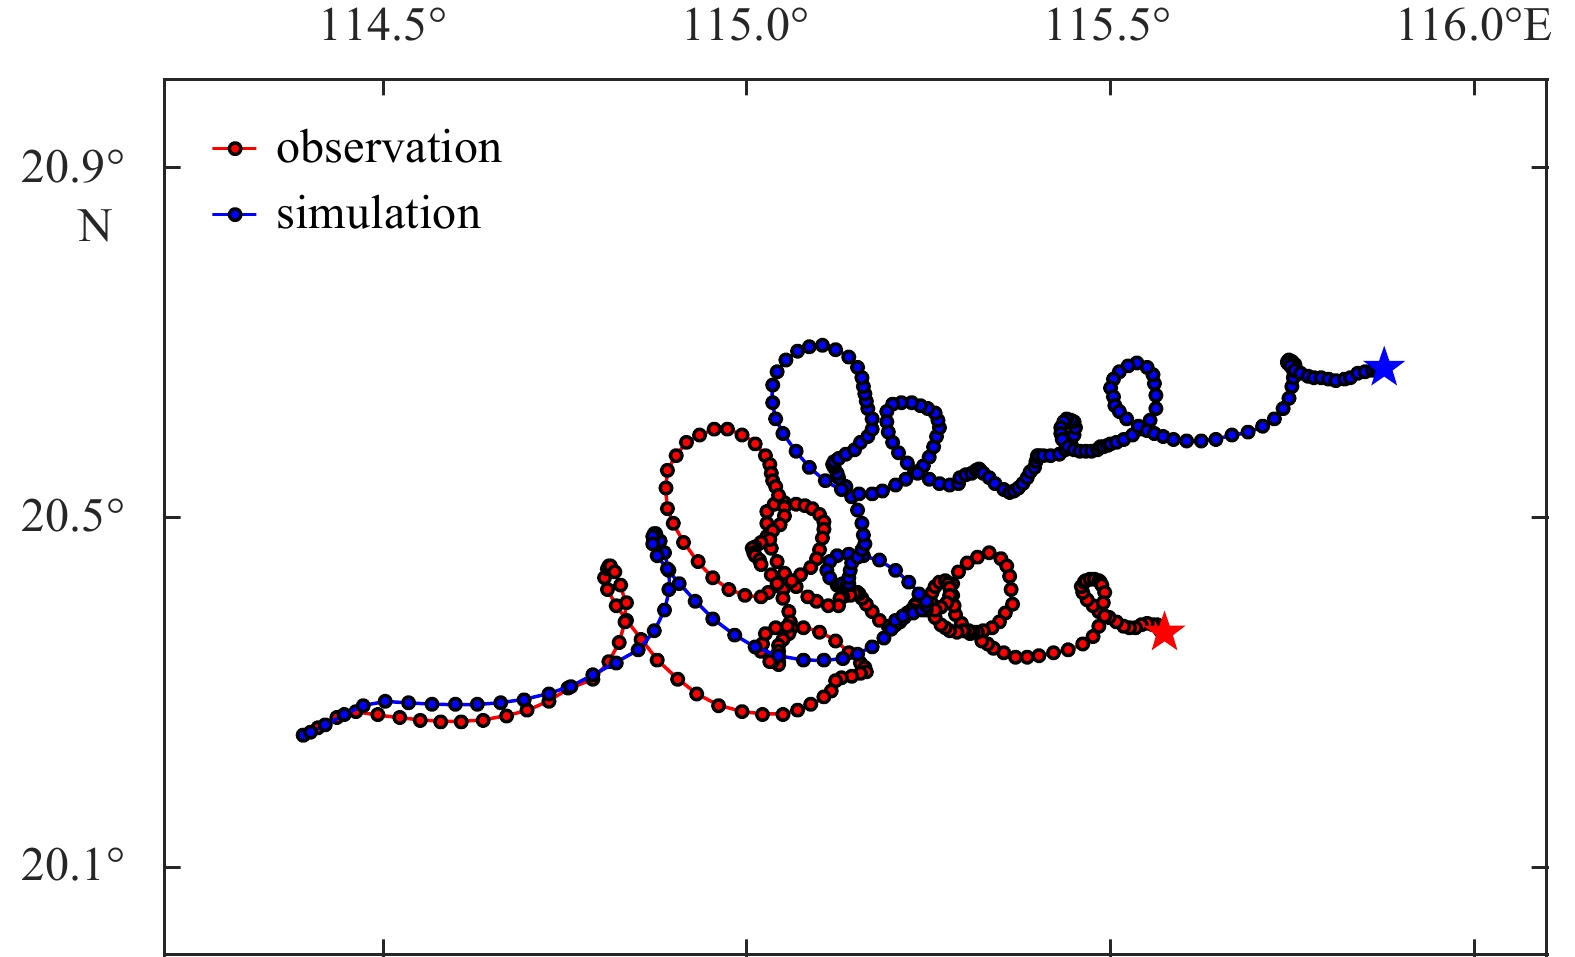
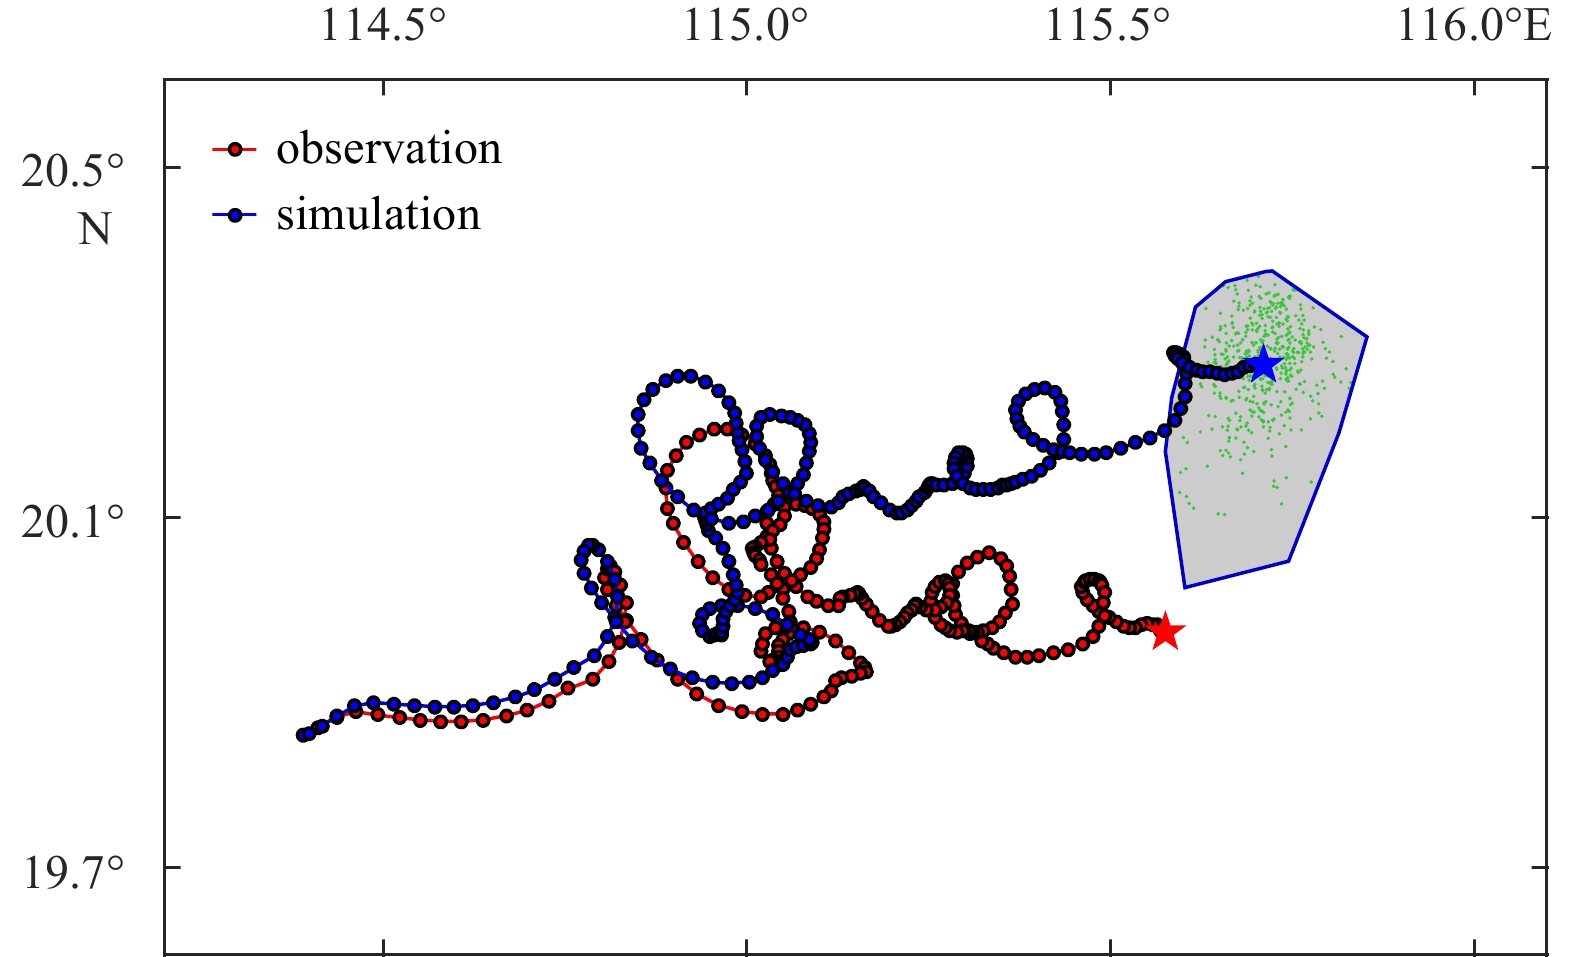
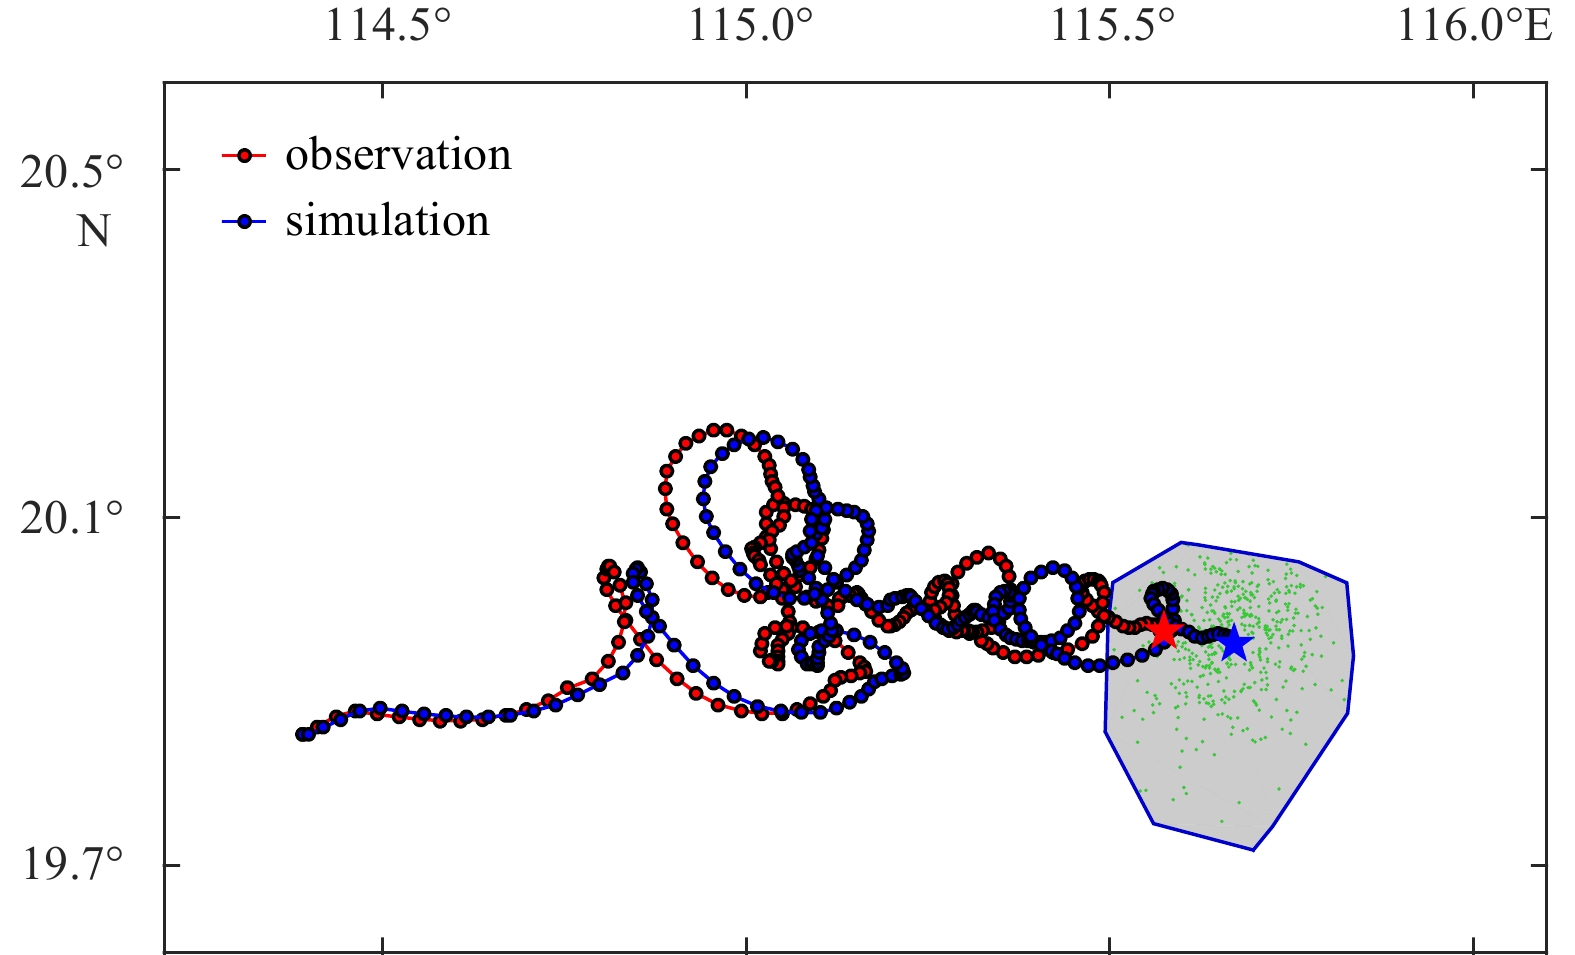
Abstract:
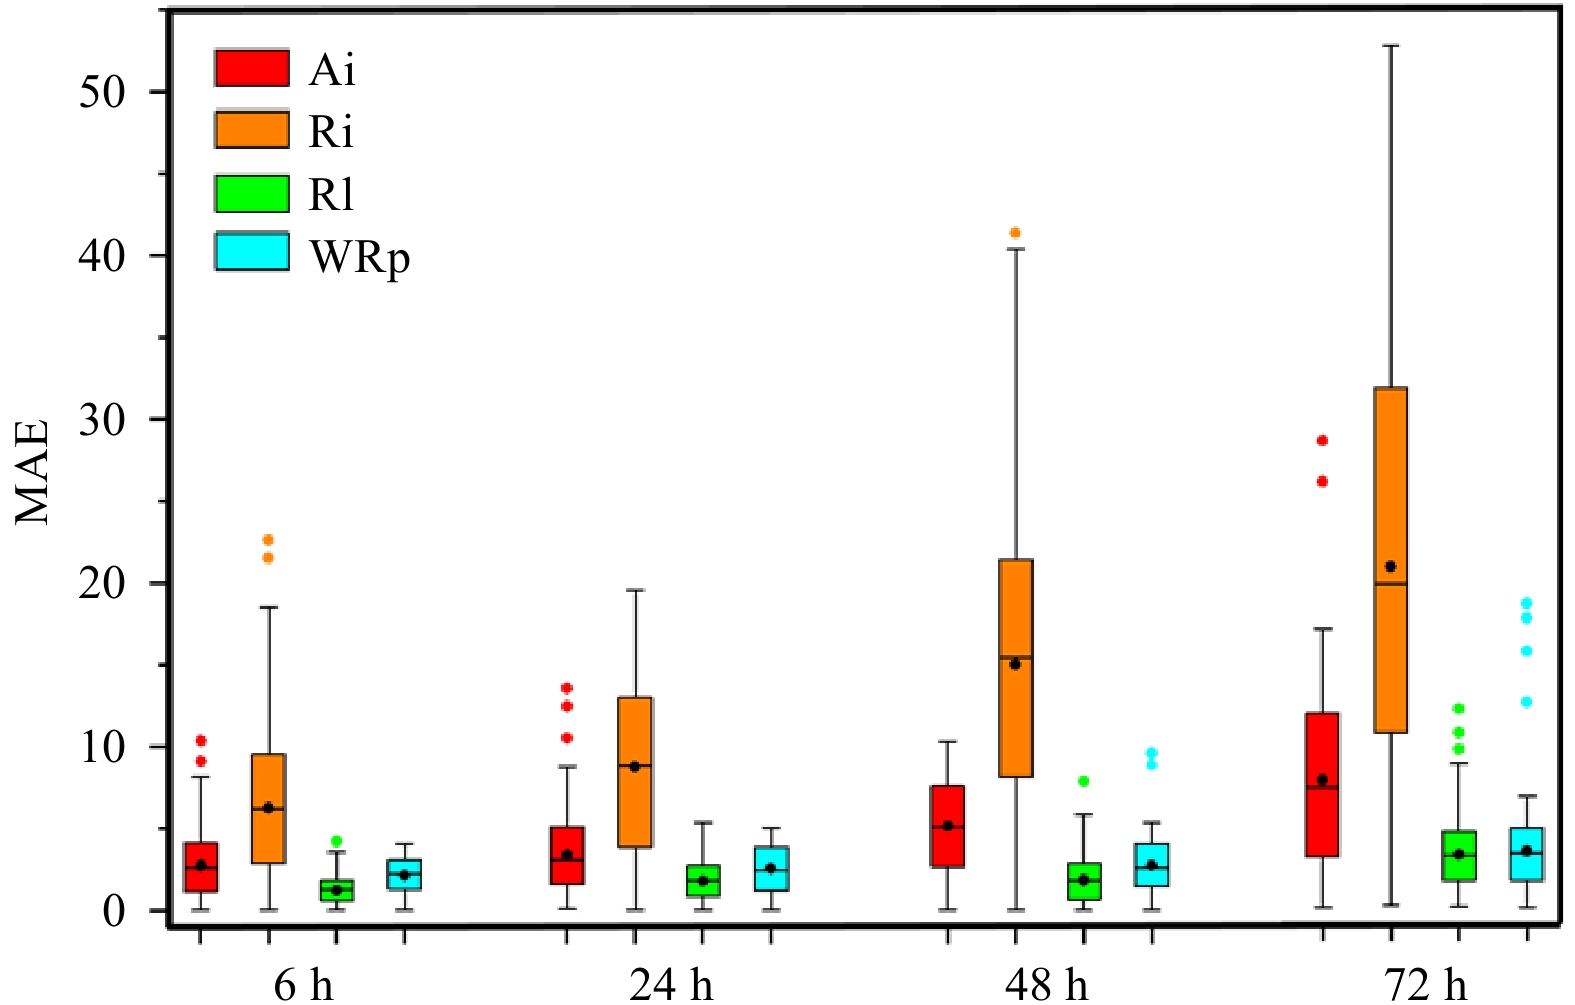
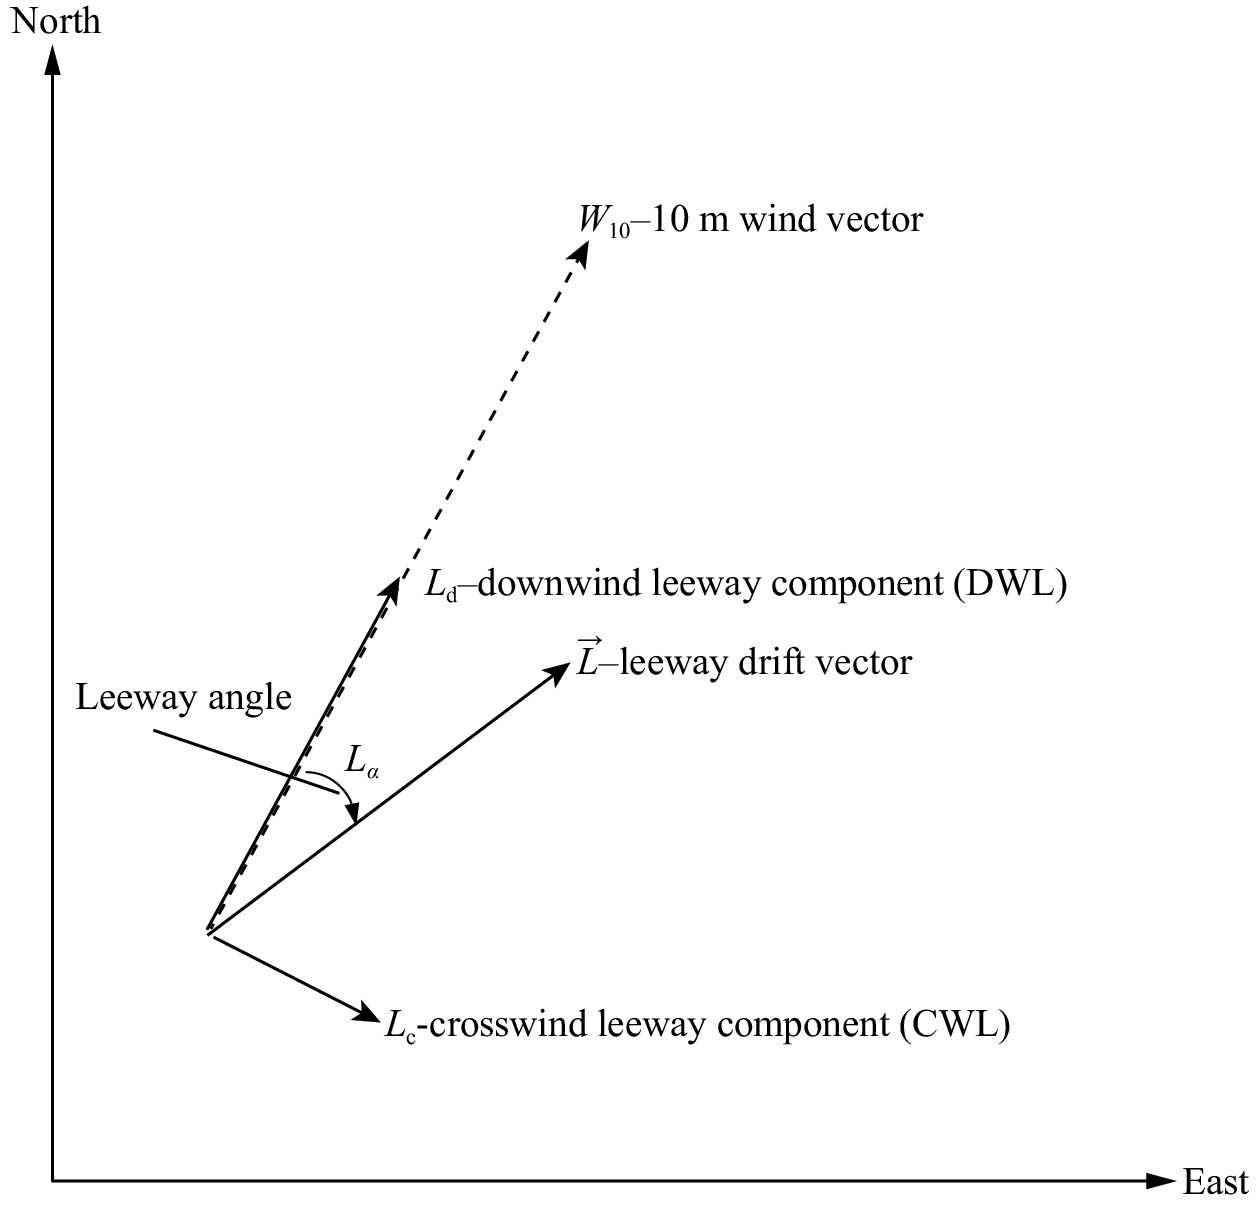
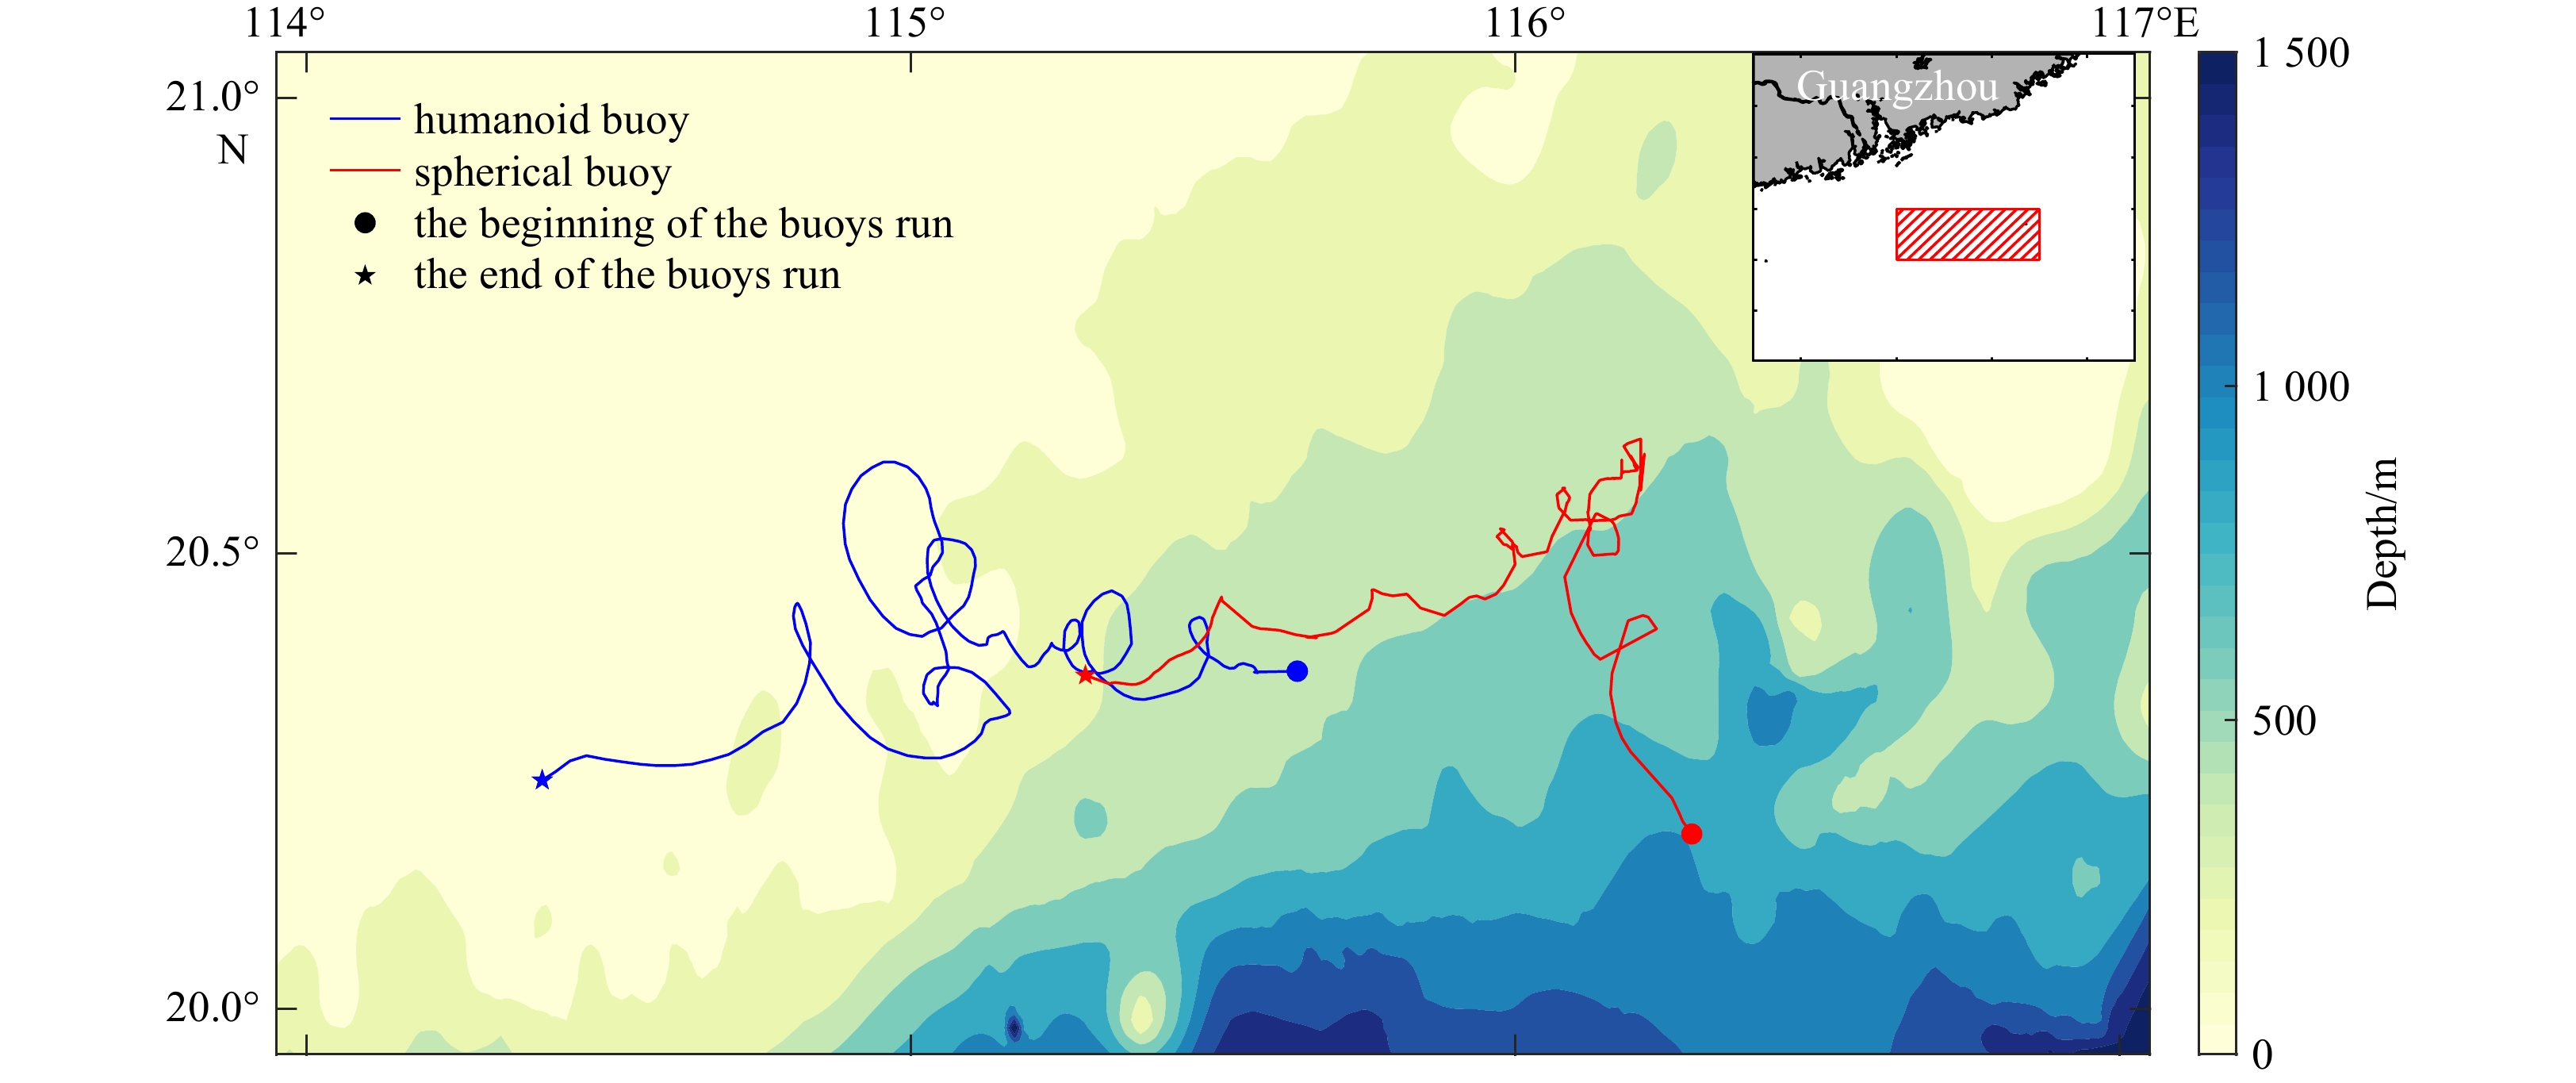
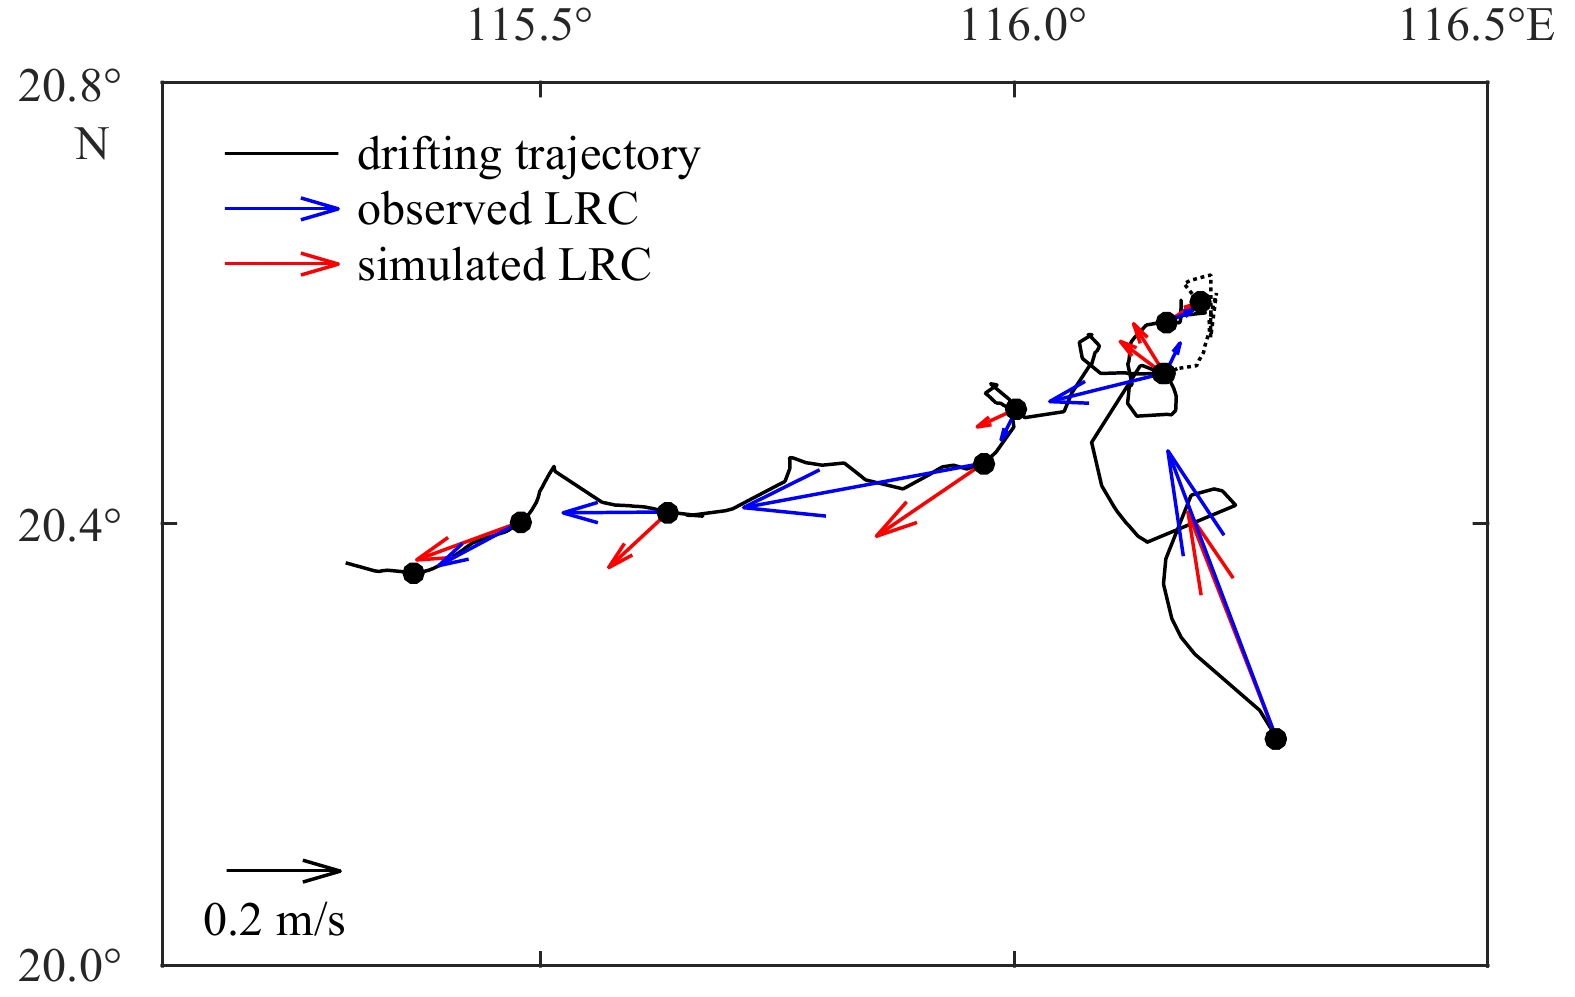
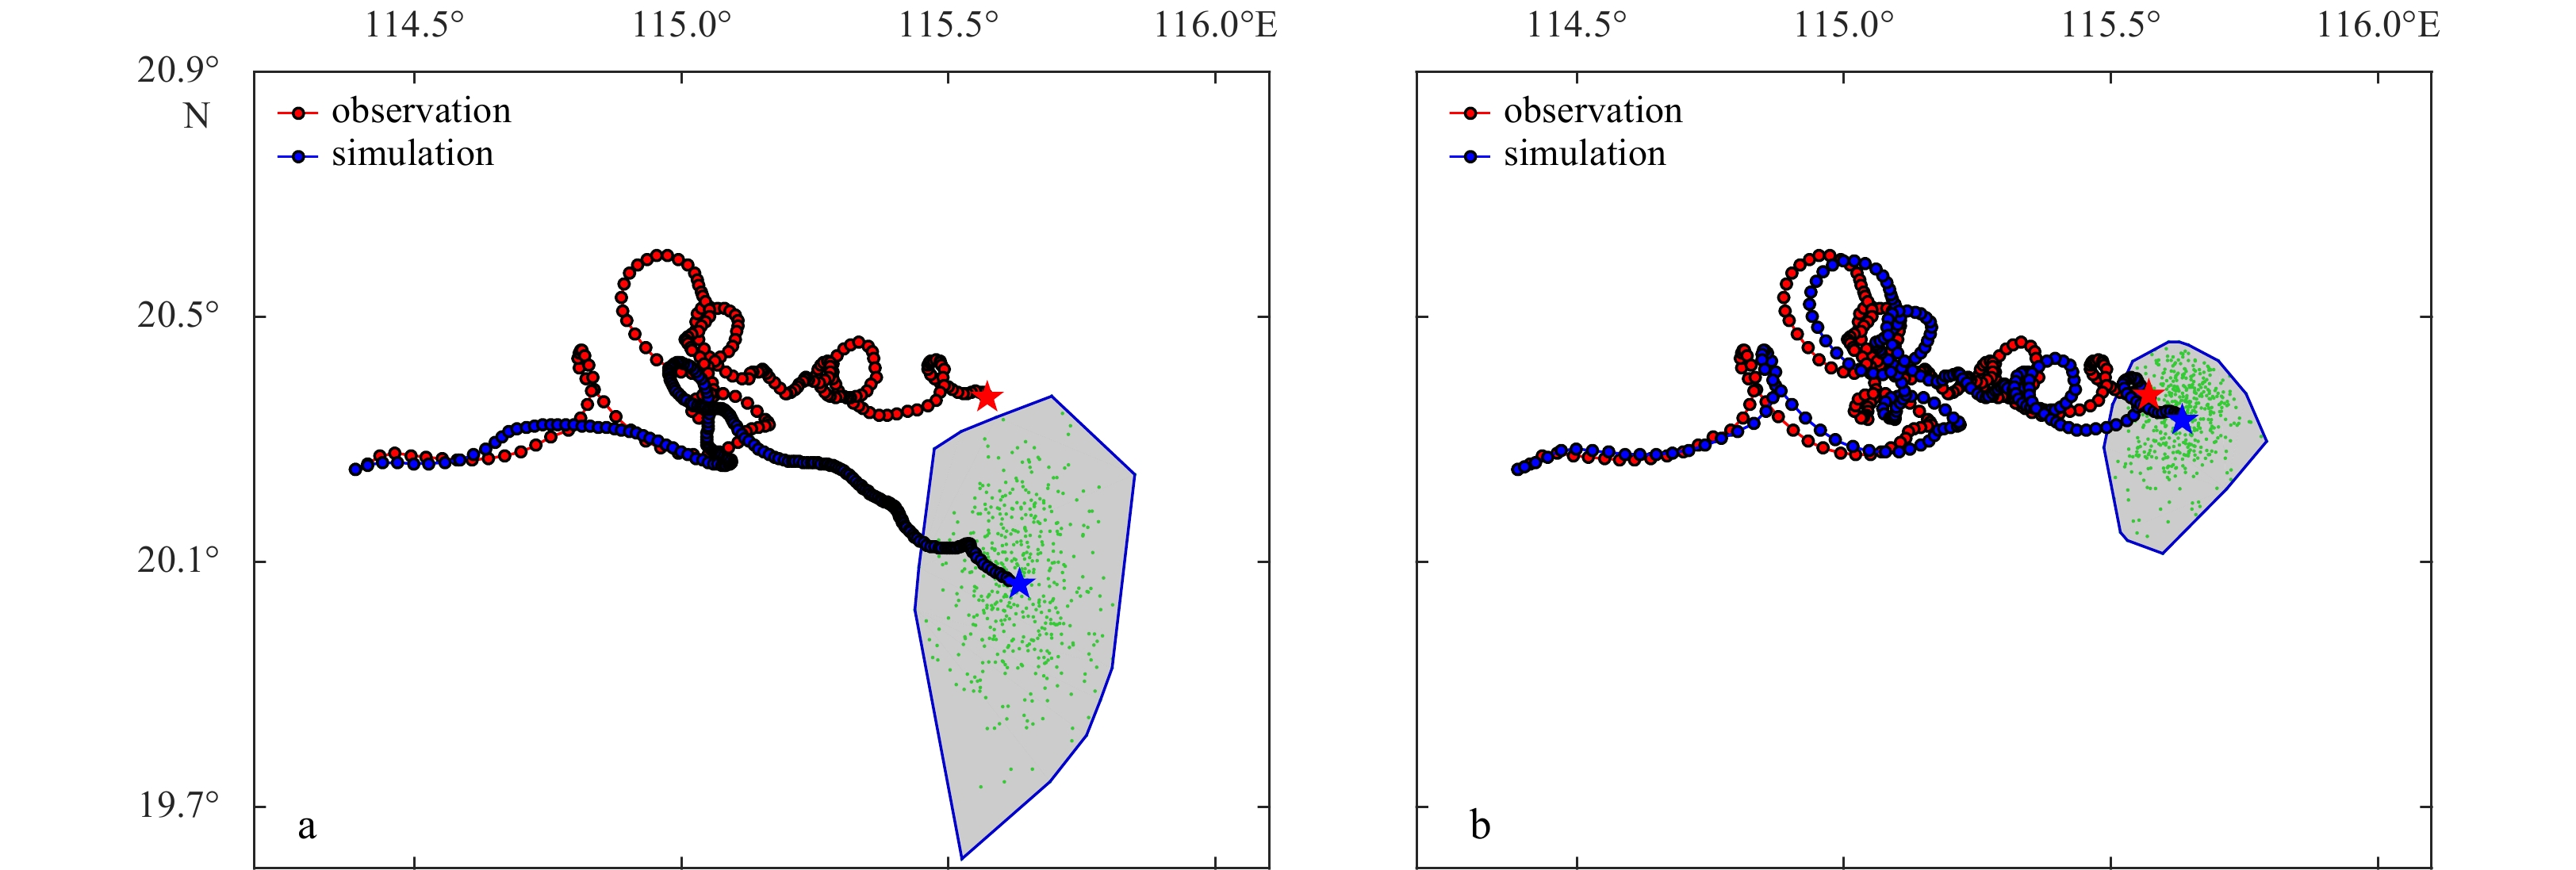
A Leeway-Trace model was established for the traceability analysis of drifting objects at sea. The model was based on the Leeway model which is a Monte Carlo-based ensemble trajectory model, and a method of realistic traceability analysis was proposed in this study by using virtual spatiotemporal drift trajectory prediction. Here, measured data from a drifting buoy observation experiment in the northern South China Sea in April 2019, combined with surface current data obtained from the finite volume community ocean model (FVCOM), were used for the traceability analysis of humanoid buoys. The results were basically consistent with the observations, and the assimilation of measured current data can significantly improve the accuracy of the traceability analysis. Several sensitive experiments were designed to discuss the effects of wind and tide on the traceability analysis, and their results showed that the wind-driven current and the wind-induced leeway drift are both important to the traceability analysis. The effect of tidal currents on traceability could not be ignored even though they were much weaker than the residual currents in the experimental area of the northern South China Sea.
A case study on the soil classification of the Yellow River Delta based on piezocone penetration test
Jiarui Zhang, Qingsheng Meng, Lei Guo, Yan Zhang, Guanli Wei, Tao Liu
2022, 41(4): 119-128. doi: 10.1007/s13131-021-1944-6
Abstract:
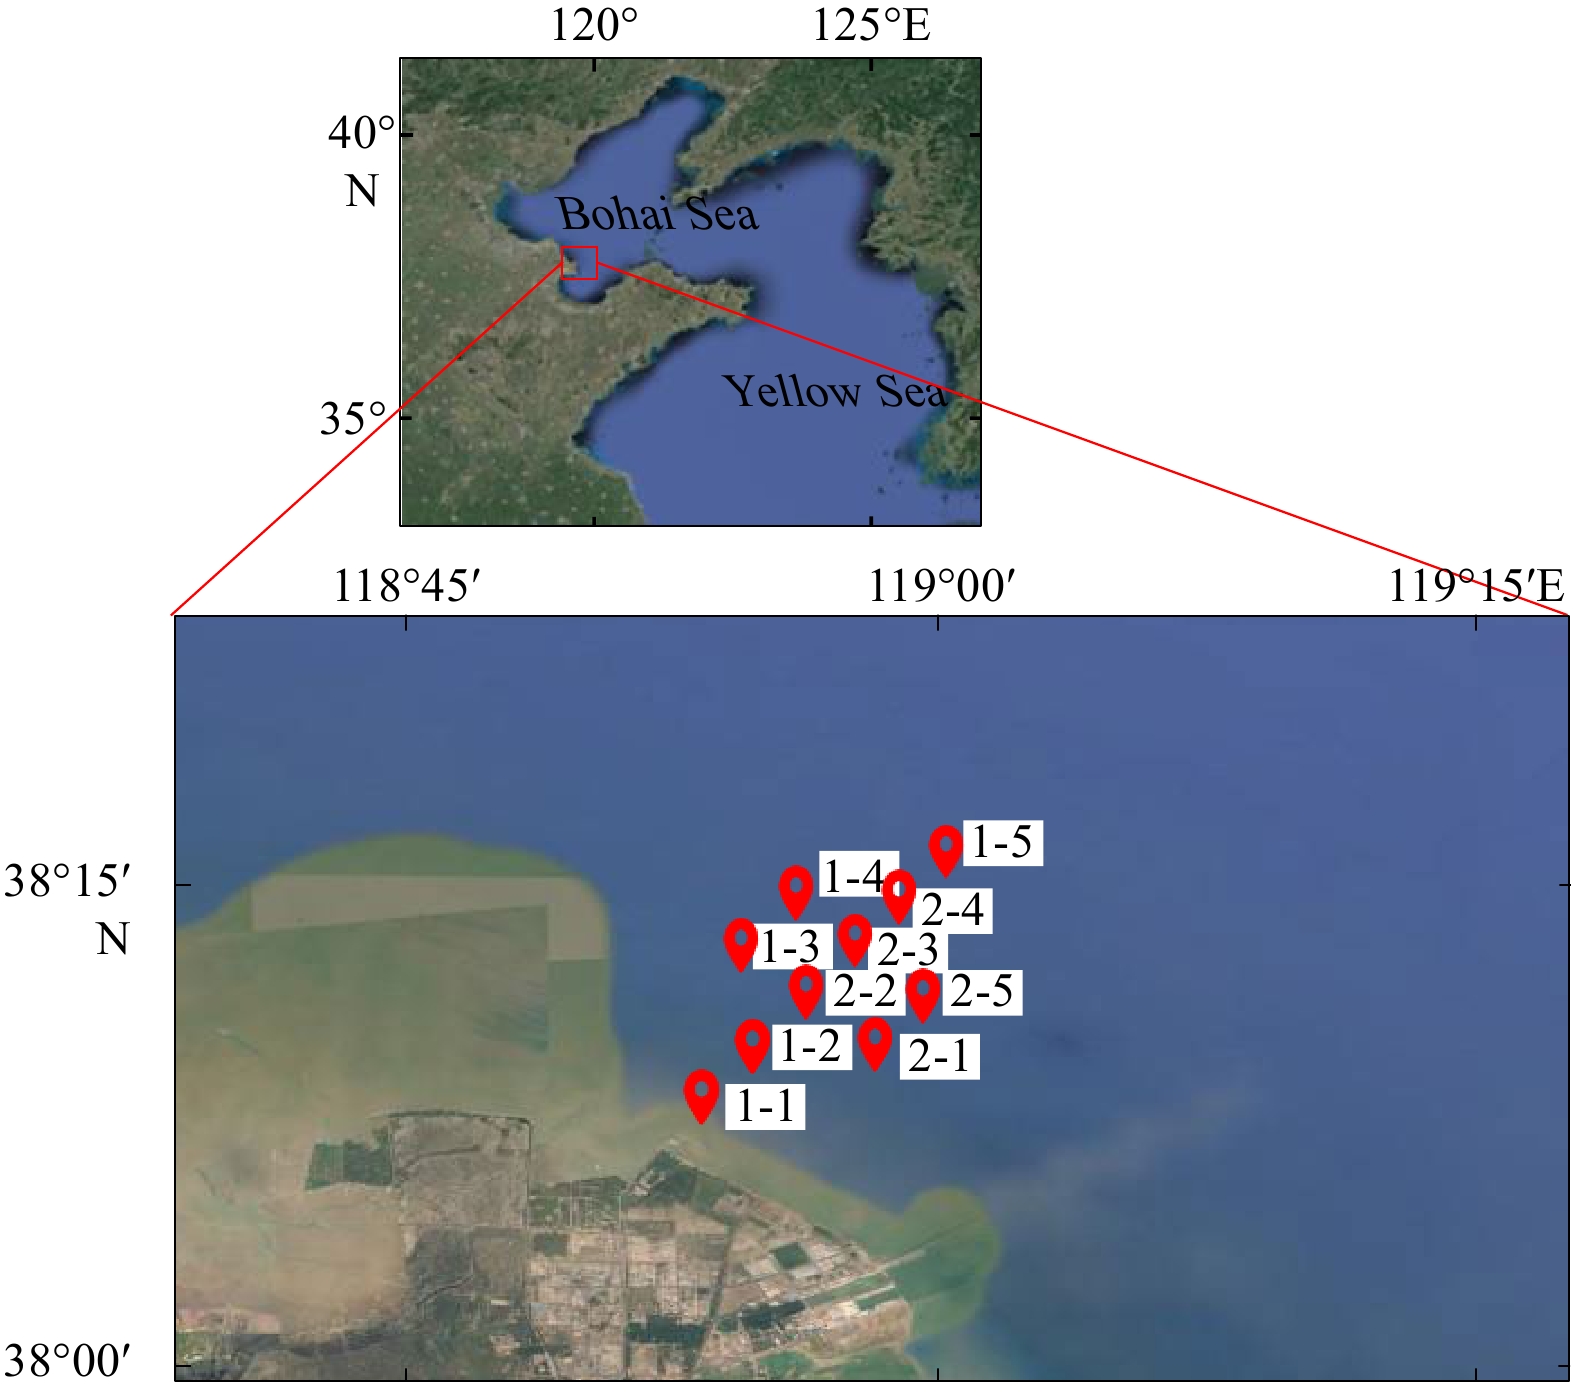
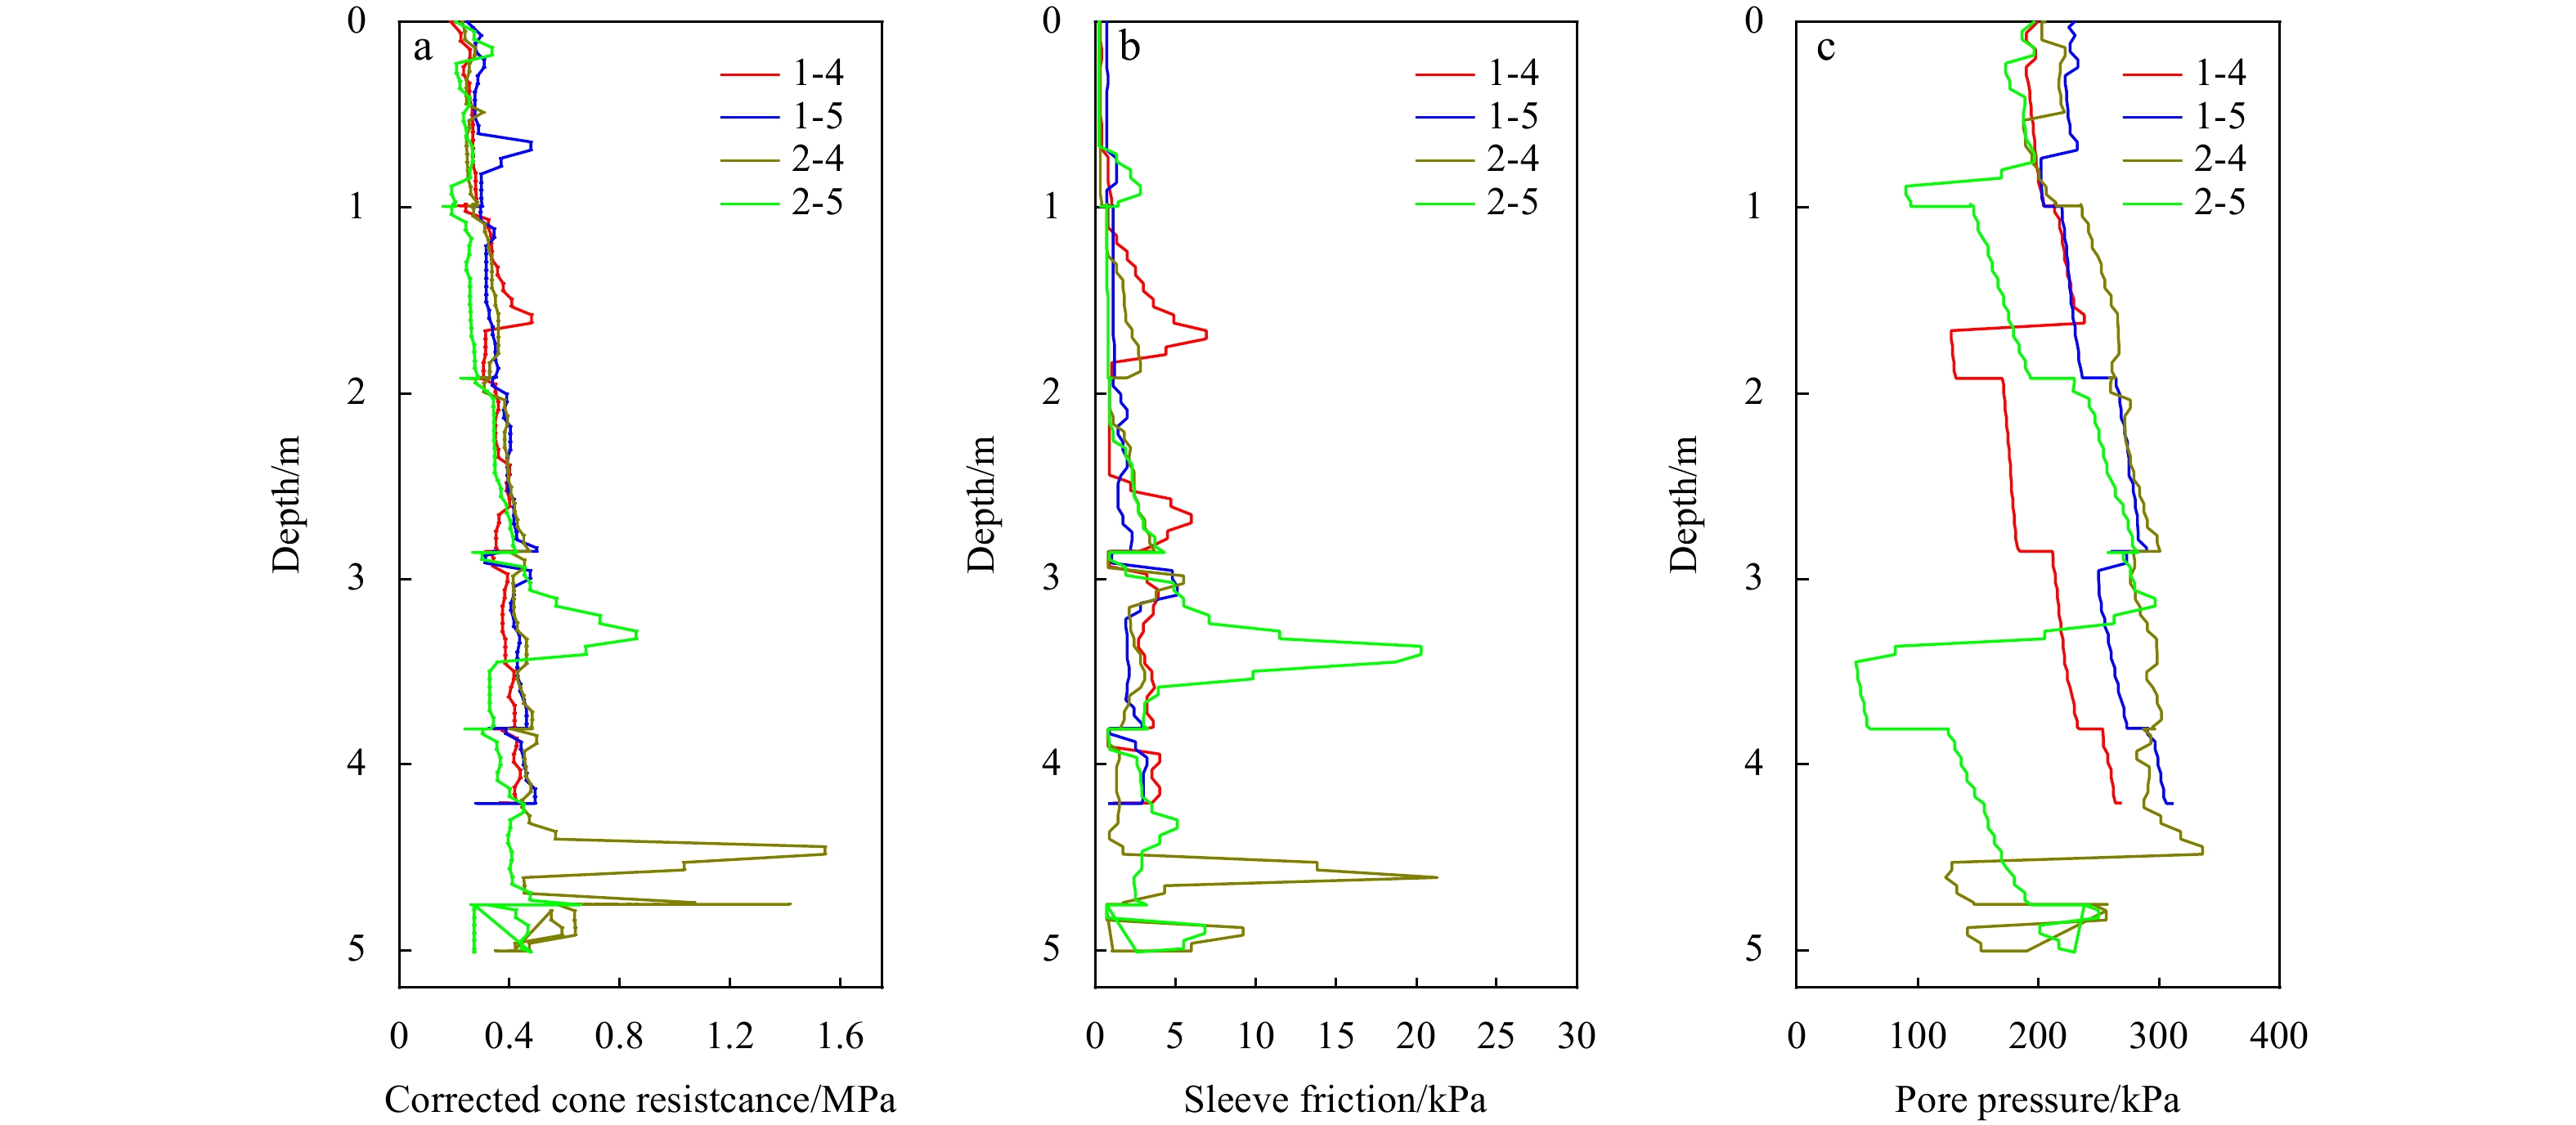
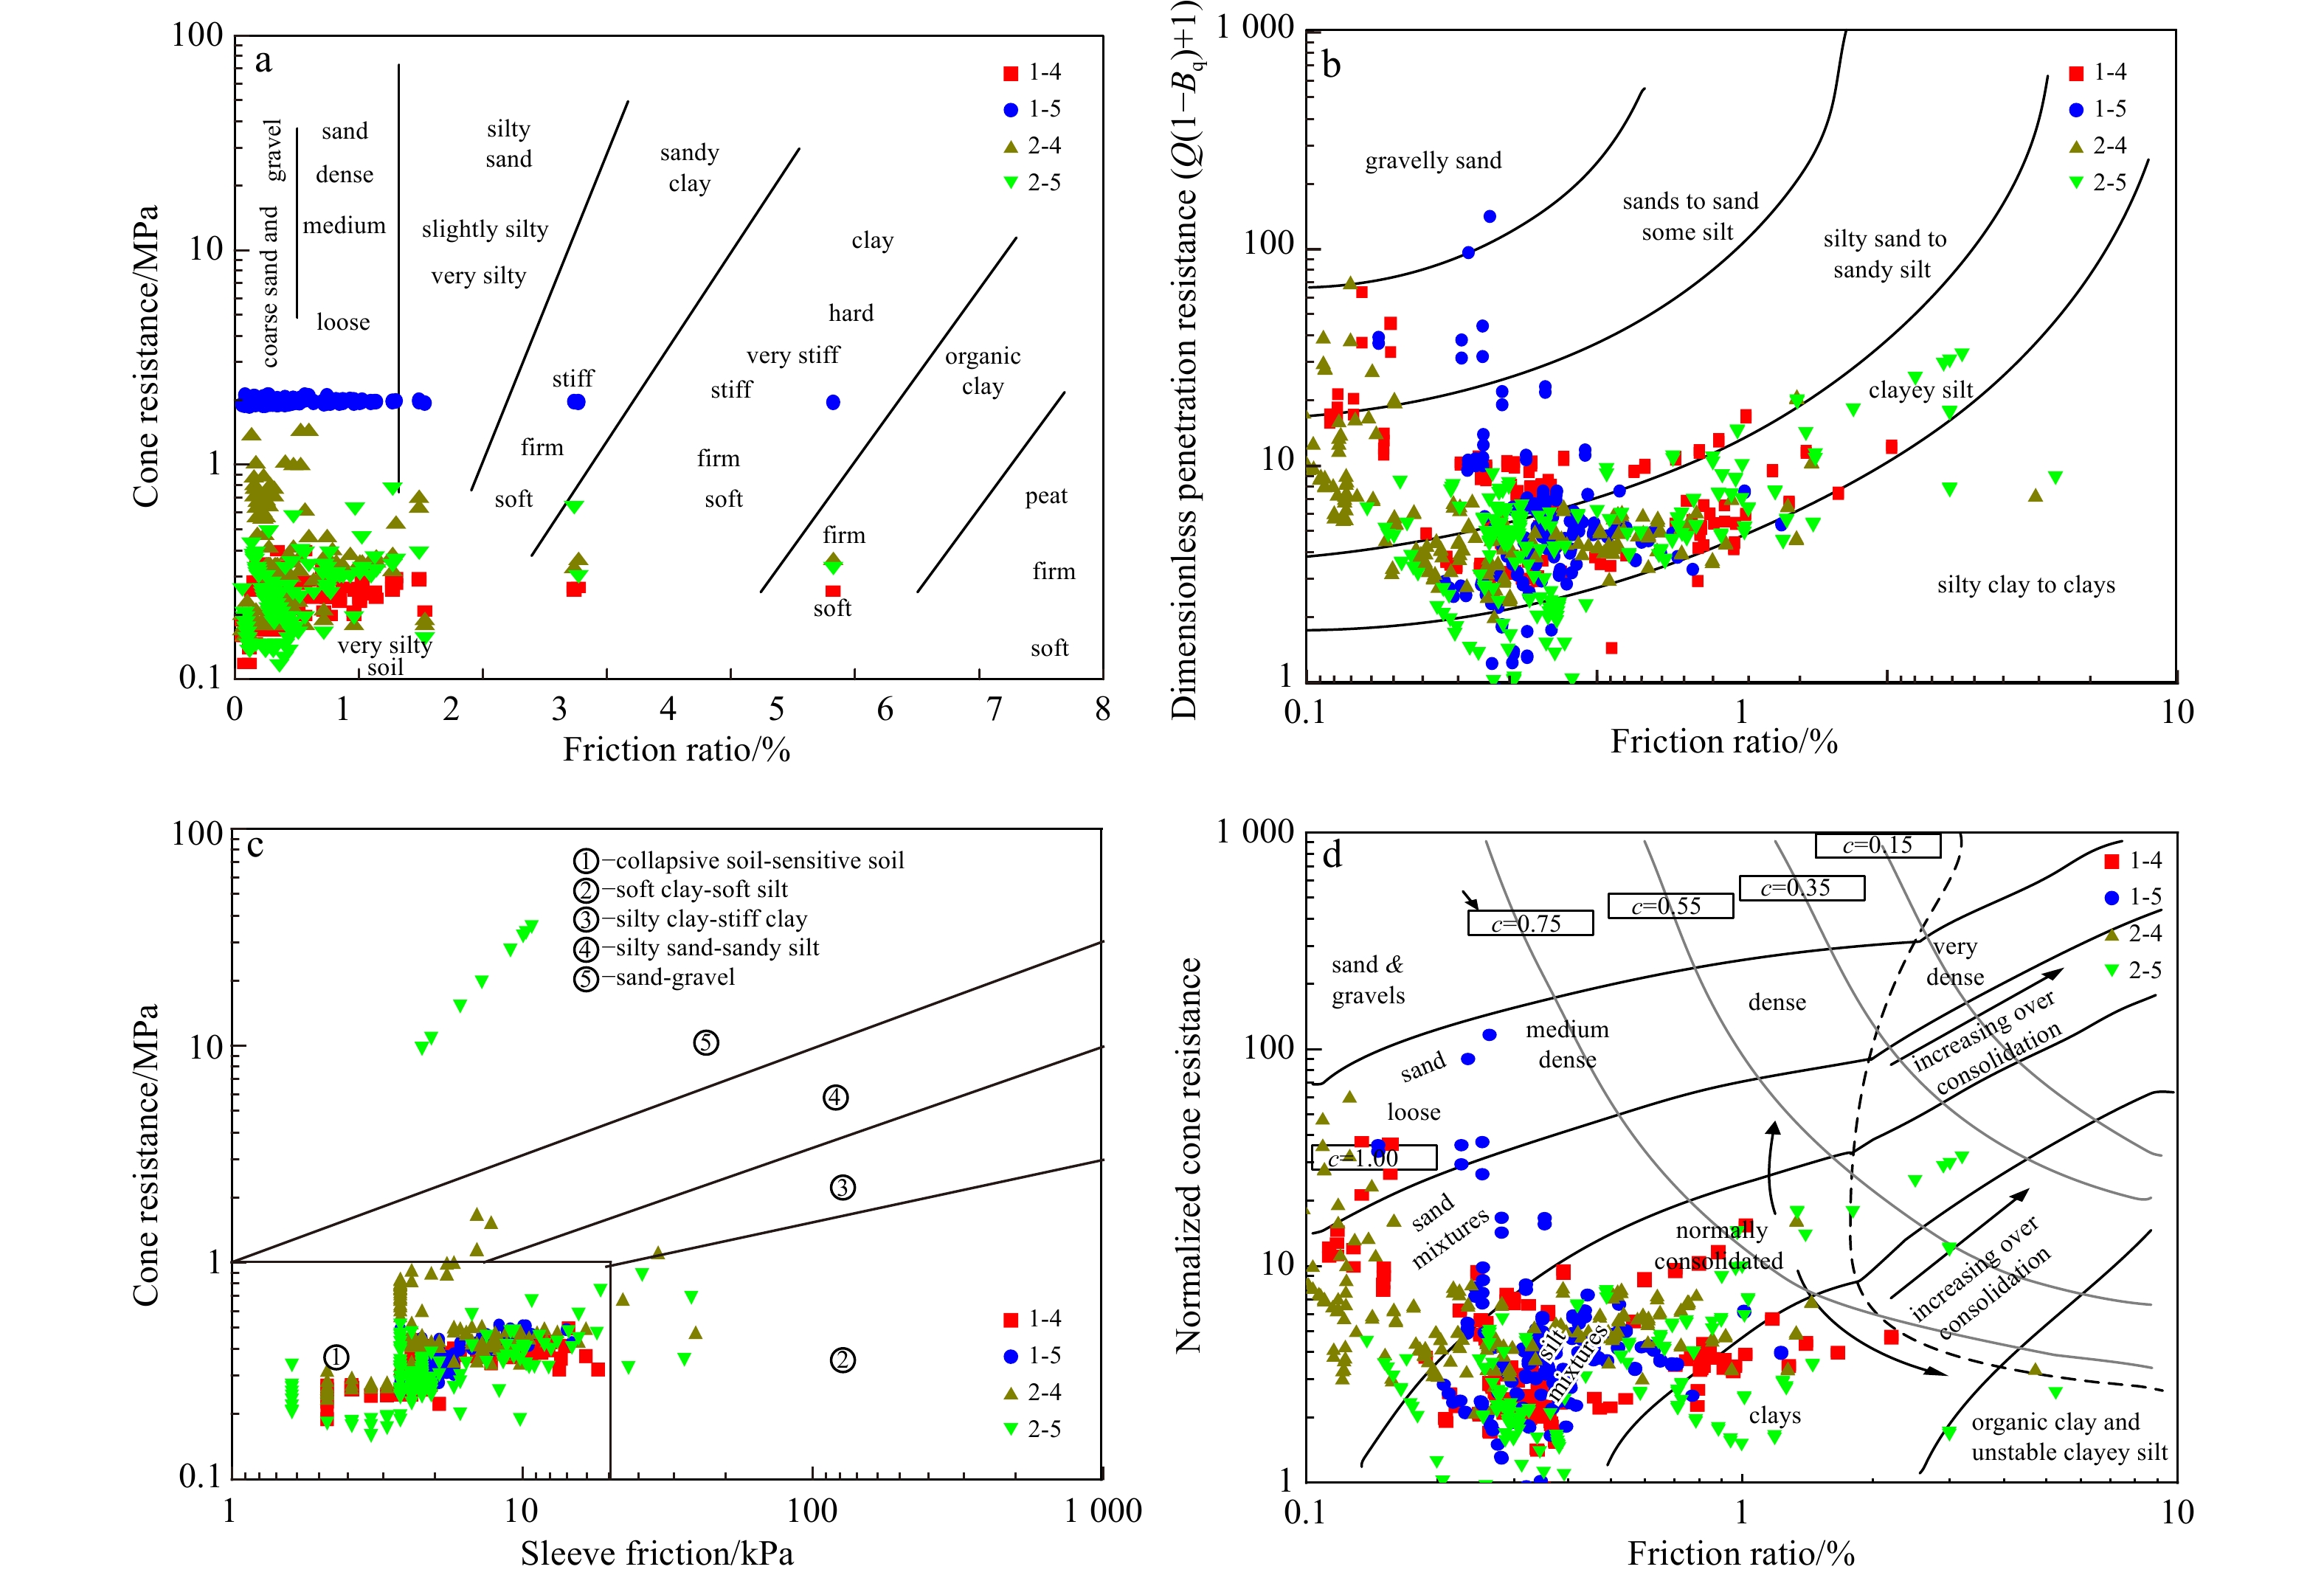
Piezocone penetration test (CPTu), the preferred in-situ tool for submarine investigation, is significant for soil classification and soil depth profile prediction, which can be used to predict soil types and states. However, the accuracy of these methods needs to be validated for local conditions. To distinguish and evaluate the properties of the shallow surface sediments in Chengdao area of the Yellow River Delta, seabed CPTu tests were carried out at ten stations in this area. Nine soil classification methods based on CPTu data are applied for soil classification. The results of classification are compared with the in-situ sampling to determine whether the method can provide sufficient resolution. The methods presented by Robertson (based on soil behavior type index Ic), Olsen and Mitchell are the more consistent and compatible ones compared with other methods. Considering that silt soils have potential to liquefy under storm tide or other adverse conditions, this paper is able to screen soil classification methods suitable for the Chengdao area and help identify the areas where liquefaction or submarine landslide may occur through CPTu investigation.
Article$Marine Technology
Ocean wave parameters retrieved directly from compact polarimetric SAR data
Yu Liu, Yijun He, Biao Zhang
2022, 41(4): 129-137. doi: 10.1007/s13131-021-1855-6
Abstract:
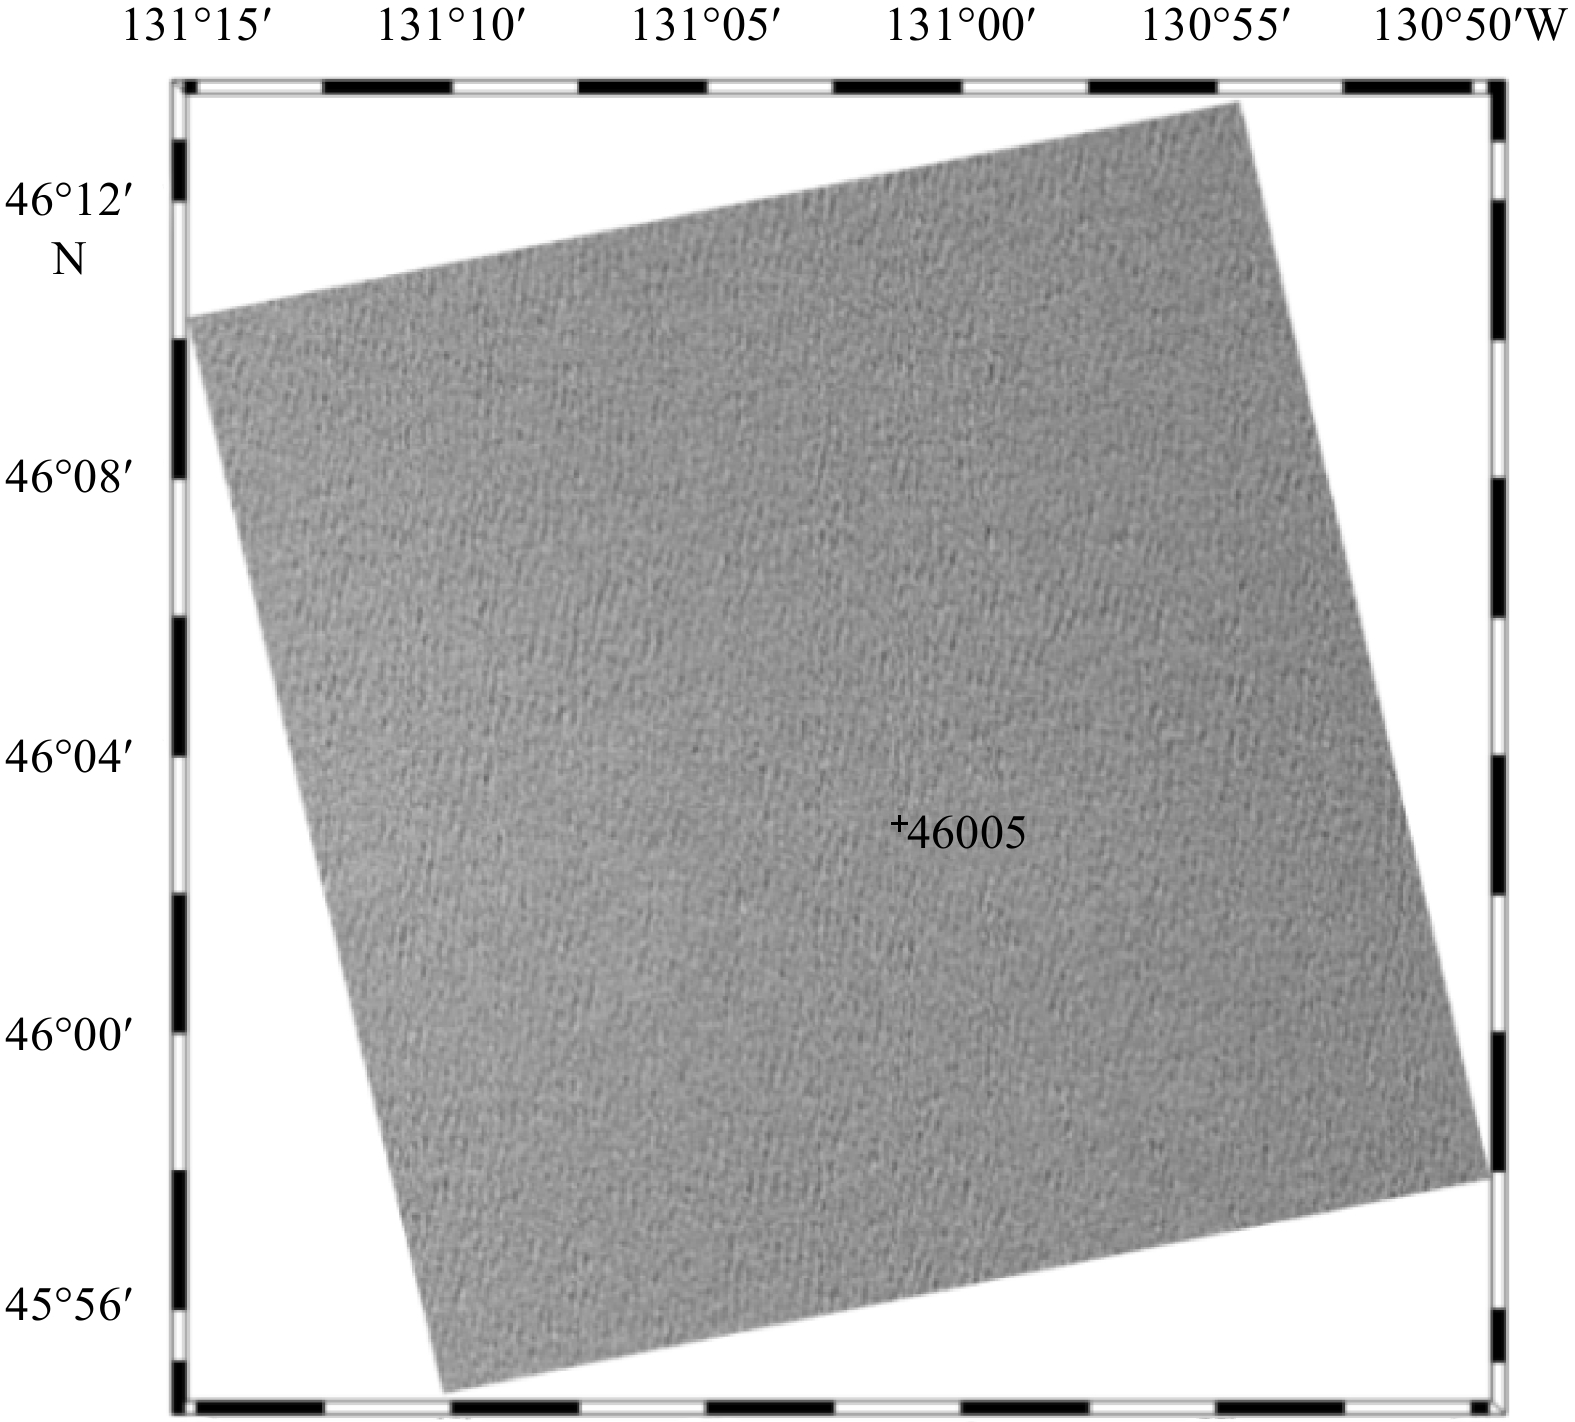
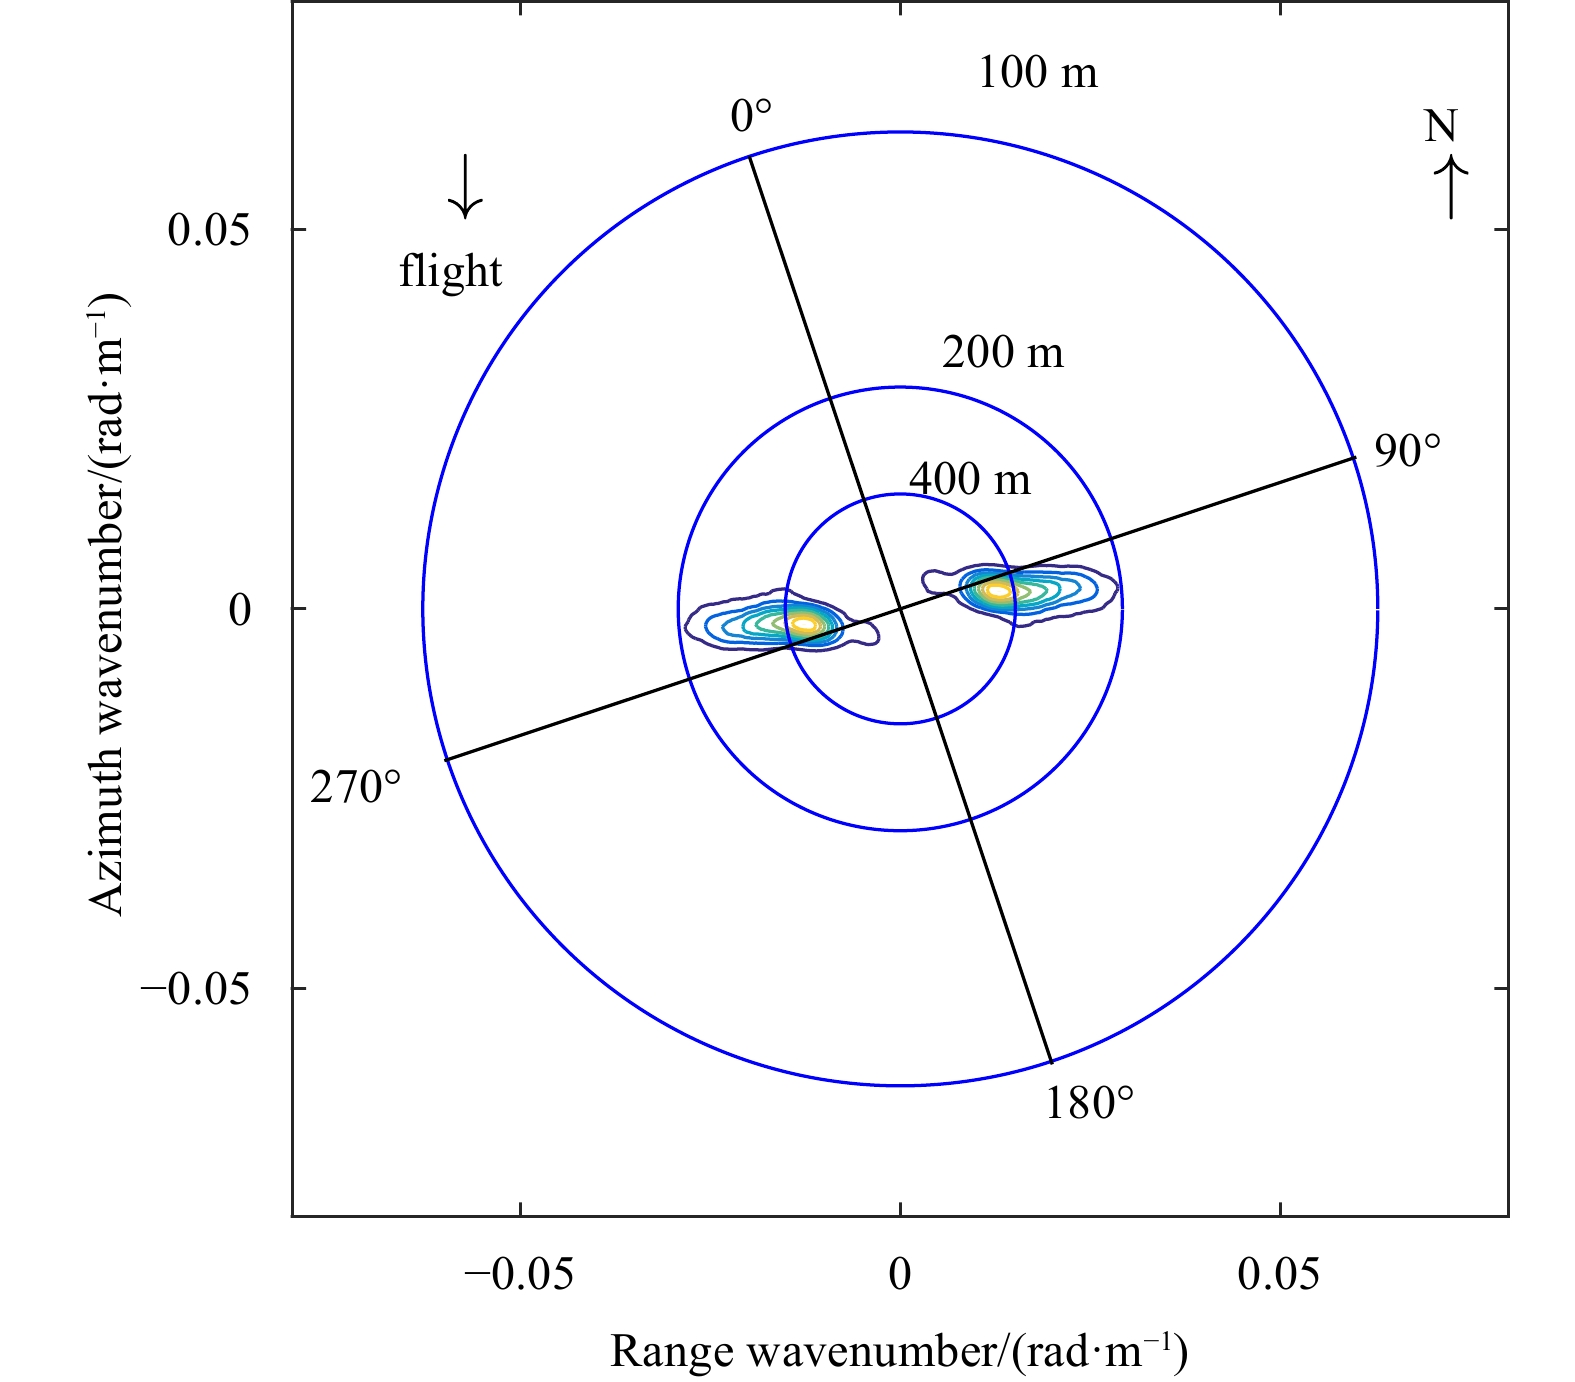
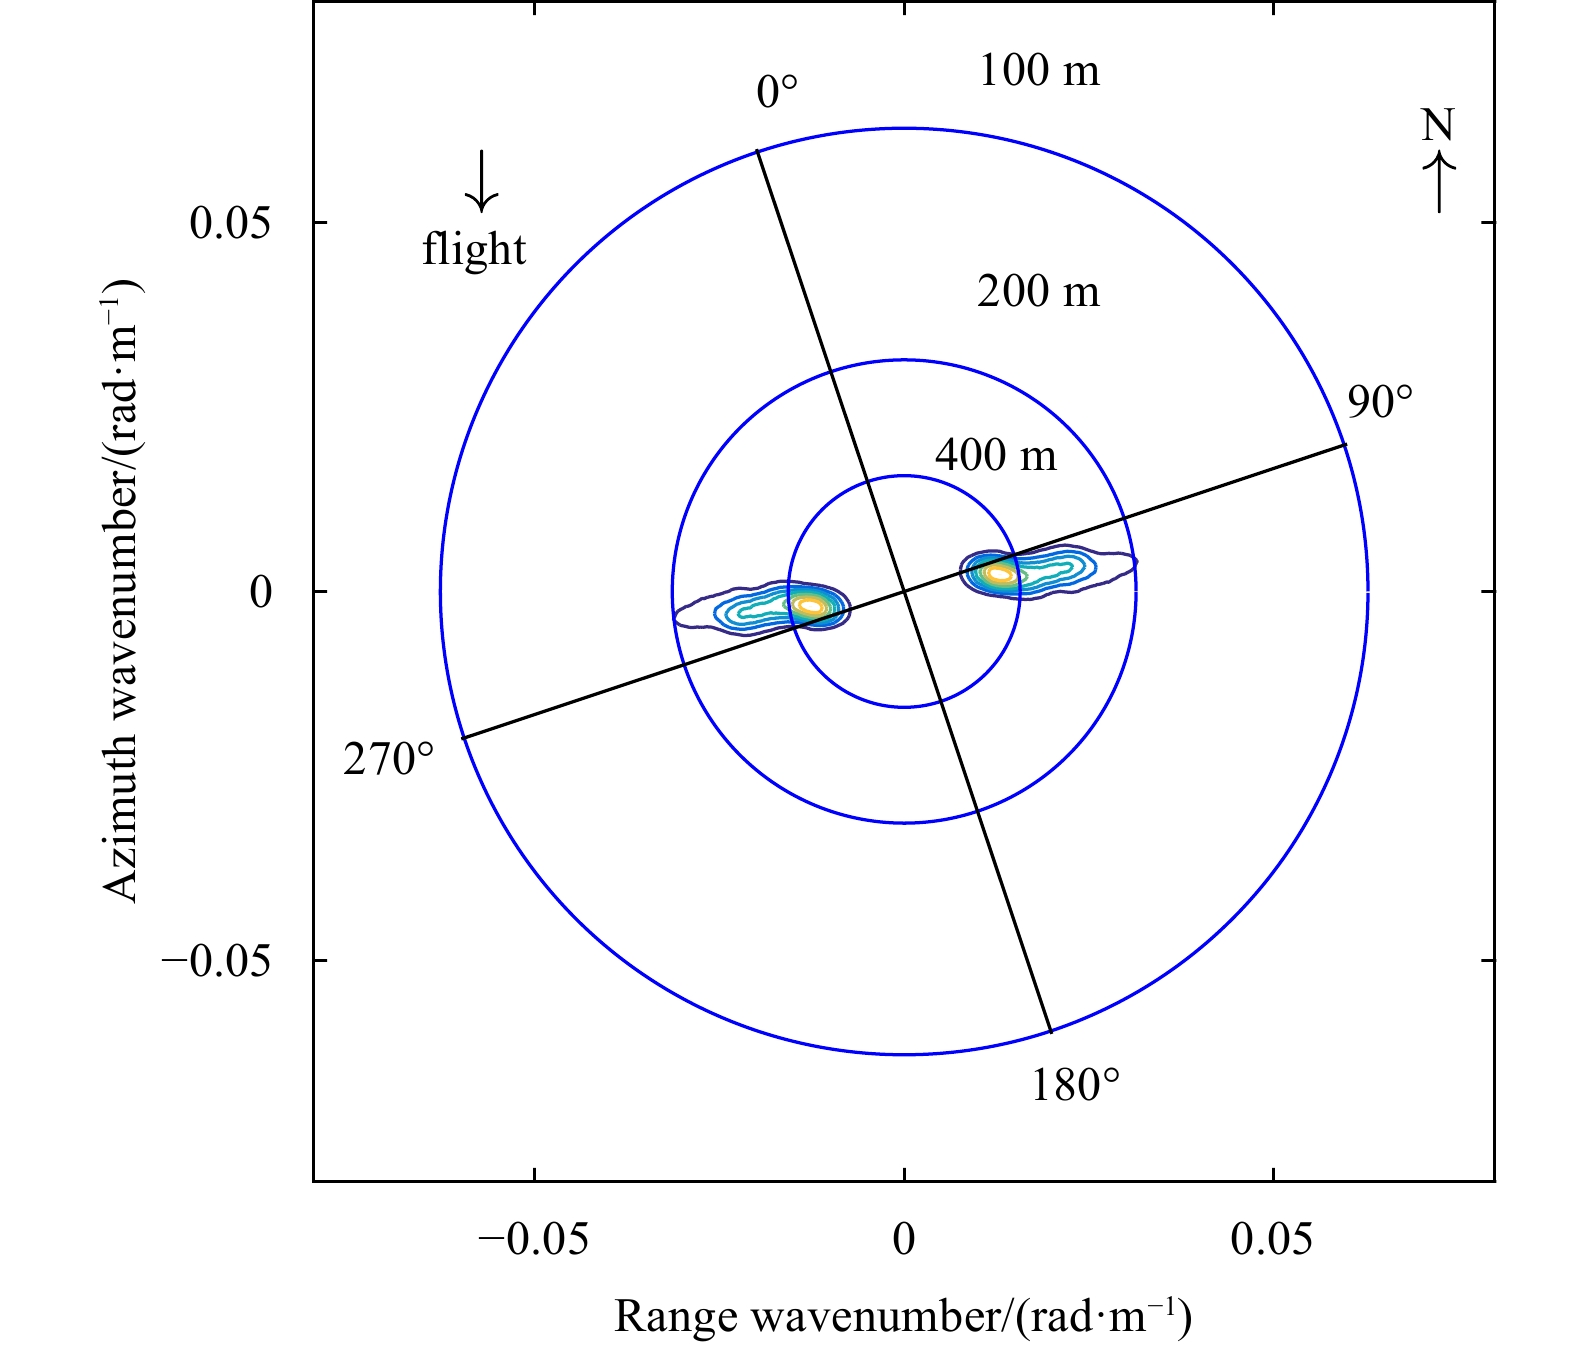
We aim to directly invert wave parameters by using the data of a compact polarimetric synthetic aperture radar (CP SAR) and validate the effectiveness of ocean wave parameter retrieval from the circular transmit/linear receive mode and π/4 compact polarimetric mode. Relevant data from the RADARSAT-2 fully polarimetric SAR on the C-band were used to obtain the compact polarimetric SAR images, and a polarimetric SAR wave retrieval algorithm was used to verify the sea surface wave measurements. Using the data and algorithm, there is no need to estimate complex hydrodynamic modulation transfer functions, even at large radar incidence angles. First, the radar backscattering cross-sections and backscattering cross-section of the radar linearly polarized with any polarization orientation angle were calculated in the two compact polarimetric SAR modes. Then, the wave slopes along the azimuth direction and the range direction were calculated directly using CP SAR data. Finally, we obtained the slope spectrum of the wave from the estimated wave slopes along azimuth and range directions. The wave parameters extracted from the synthetic wave slope spectrum were compared with those obtained from buoy observations of the National Data Buoy Center, verifying a suitable agreement.
A novel synthetic aperture radar scattering model for sea surface with breaking waves
Xiaochen Wang, Yuxin Hu, Bing Han, Wei Tian, Chunhua Zhang
2022, 41(4): 138-145. doi: 10.1007/s13131-021-1842-y
Abstract:
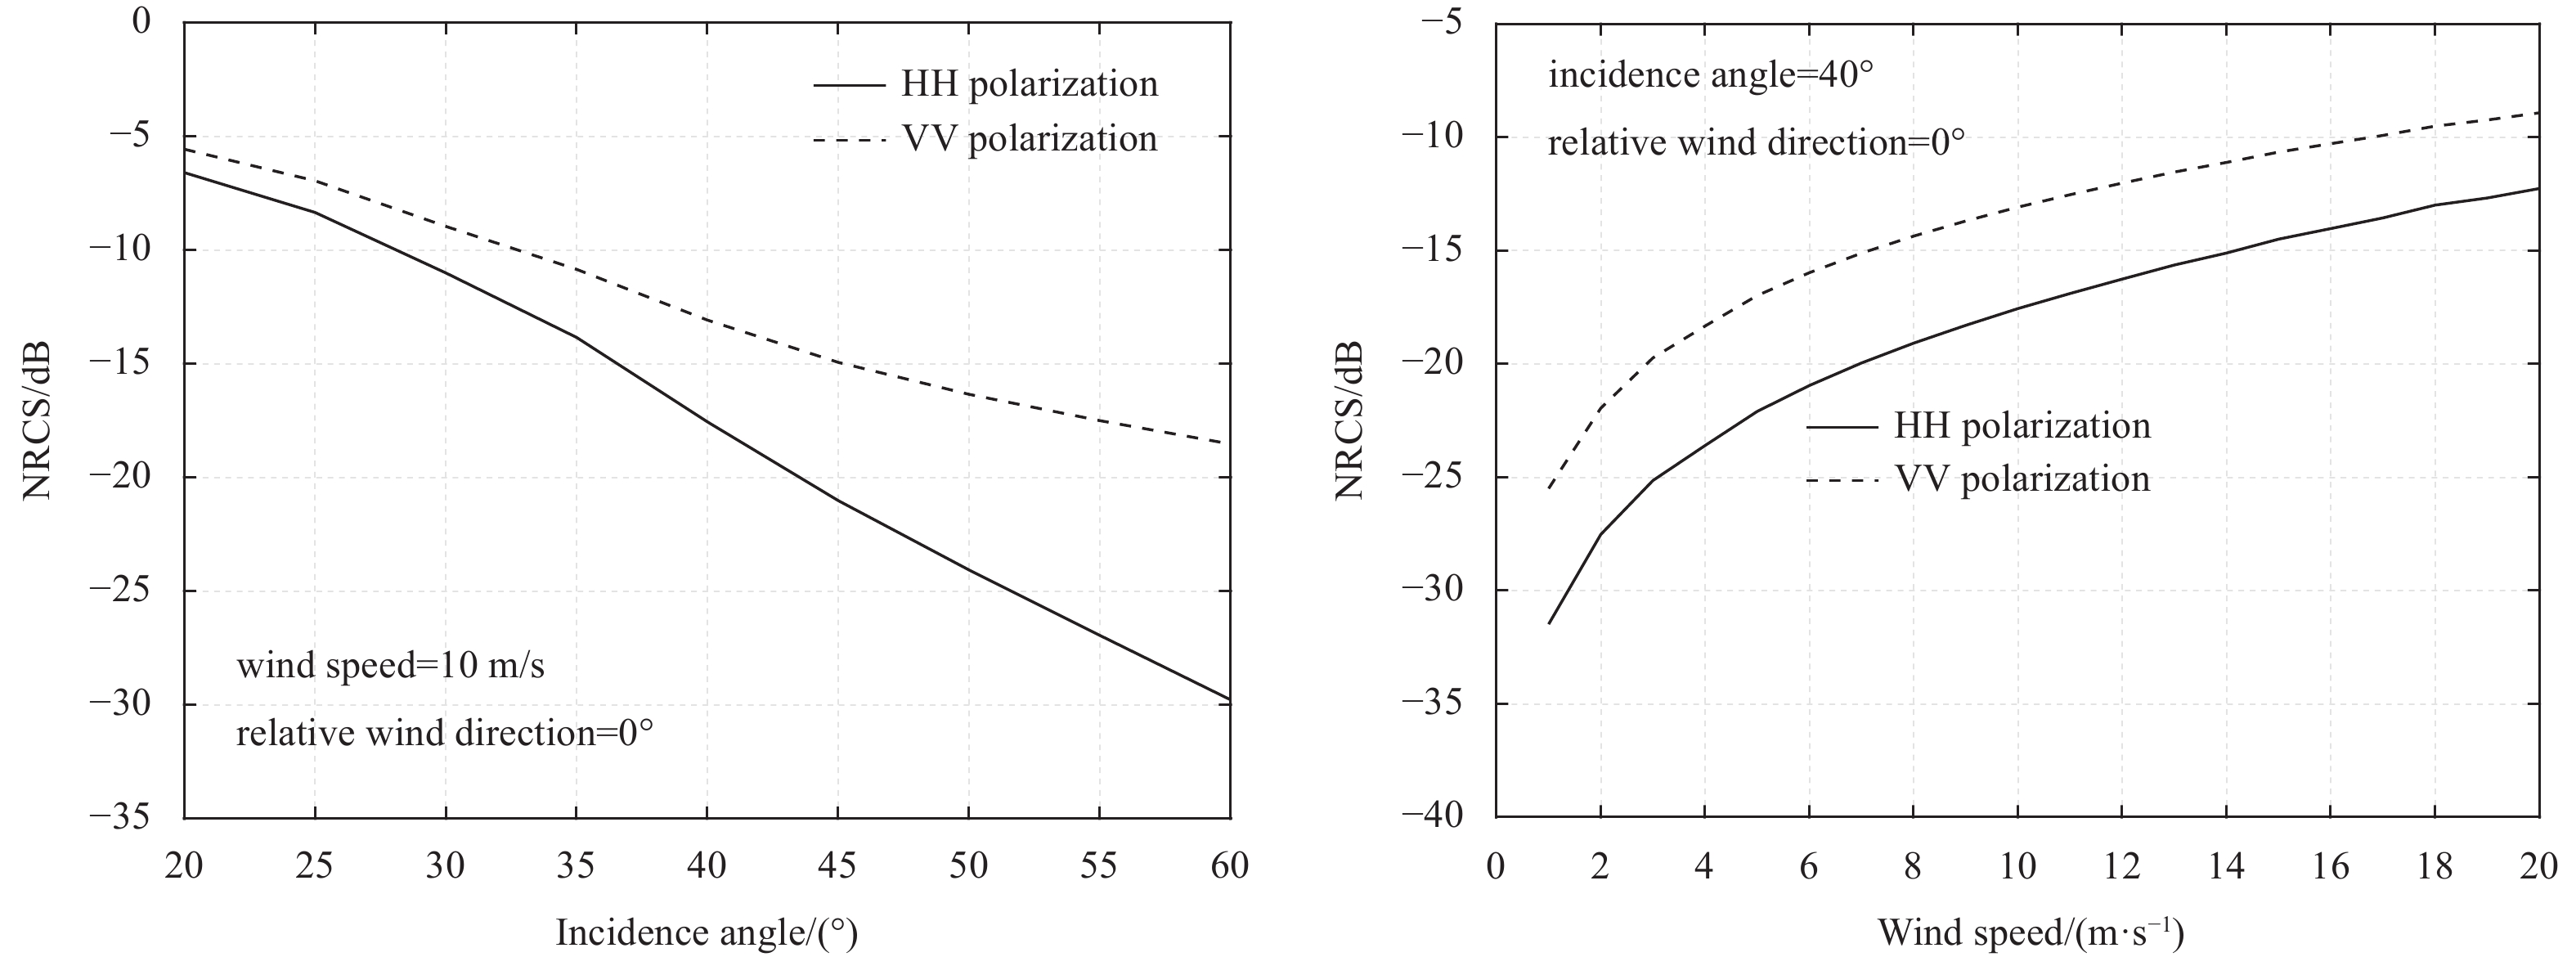
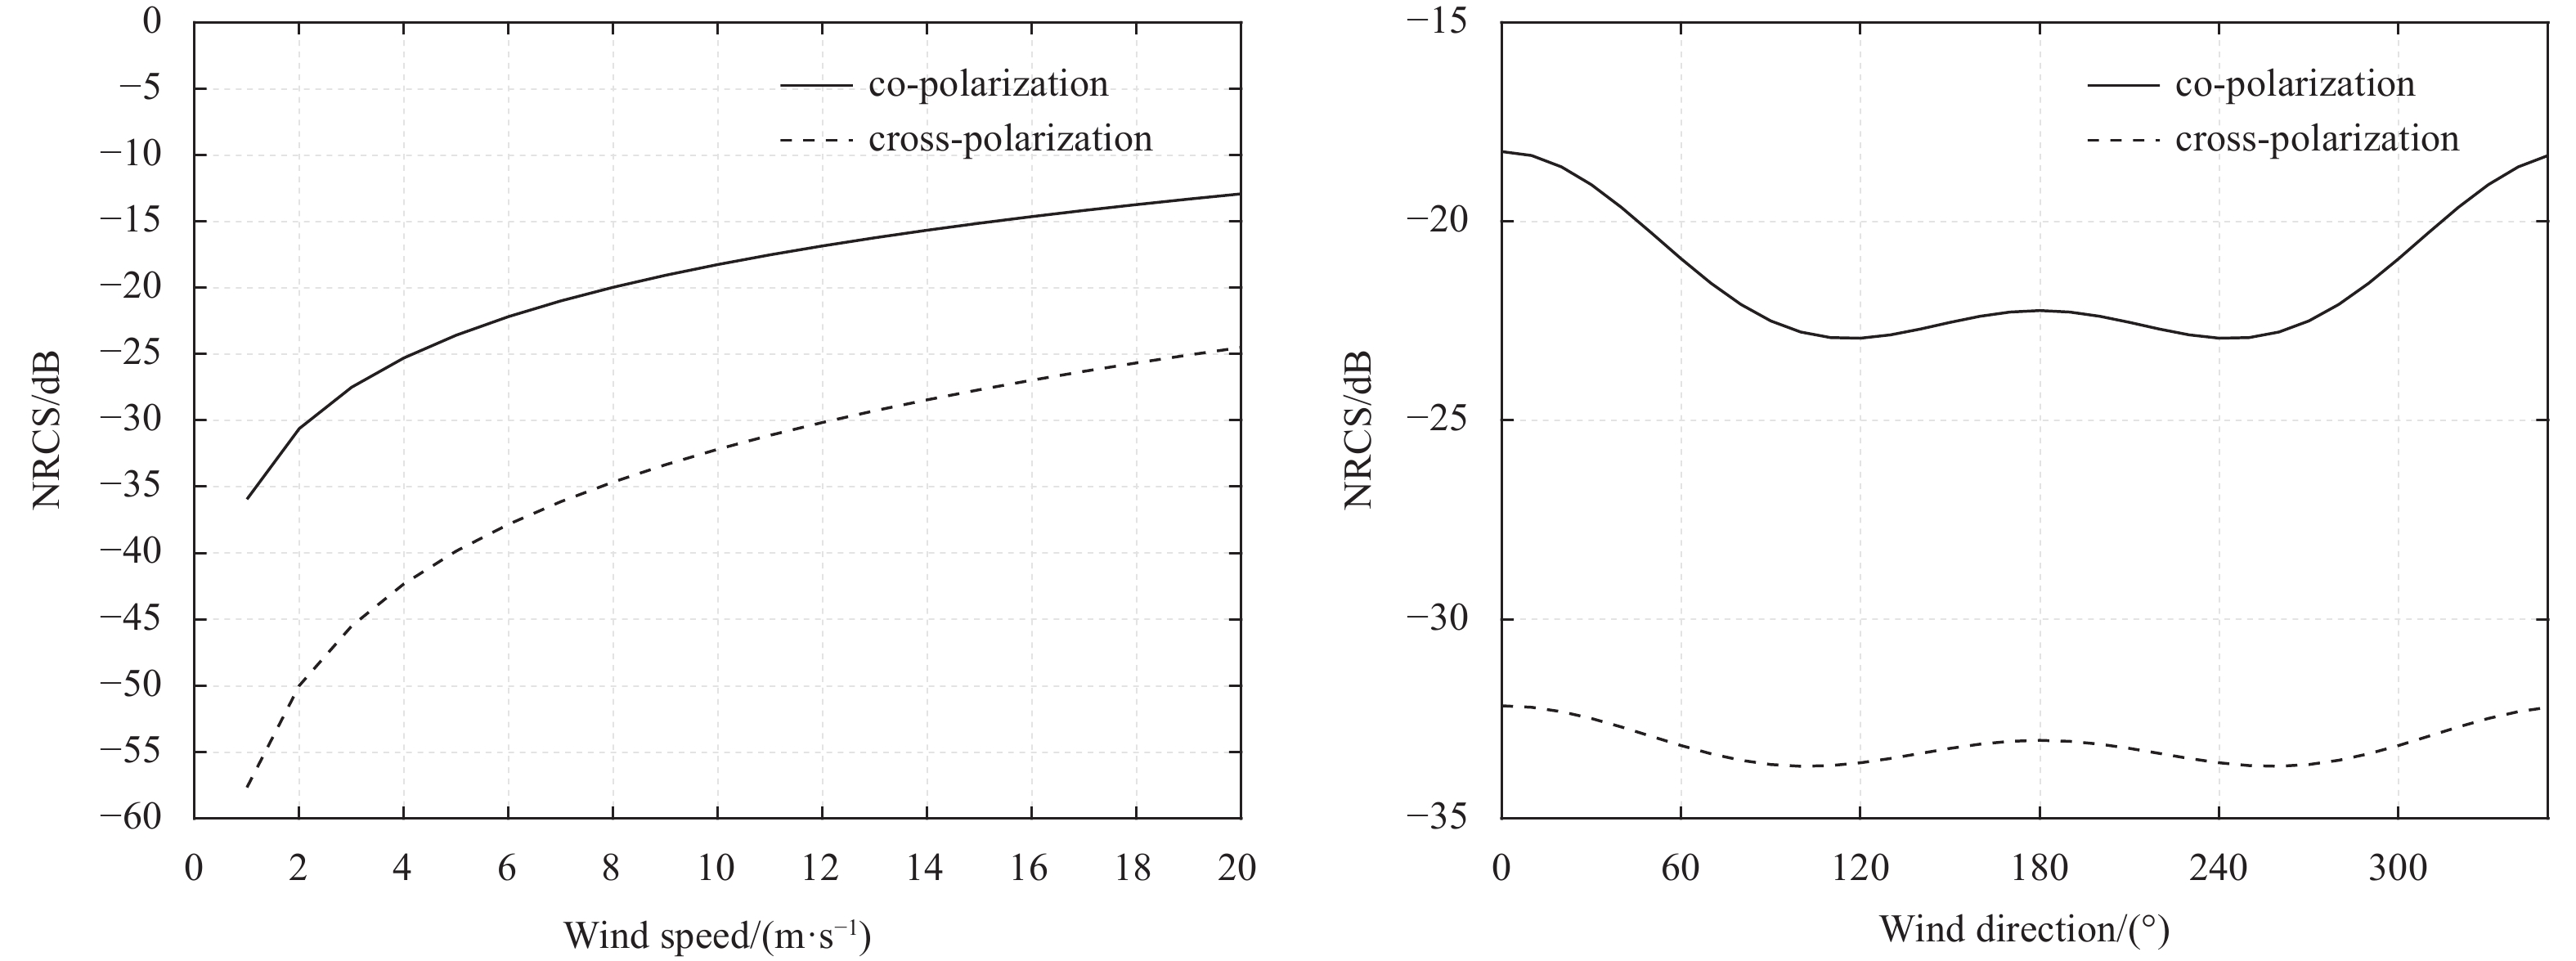
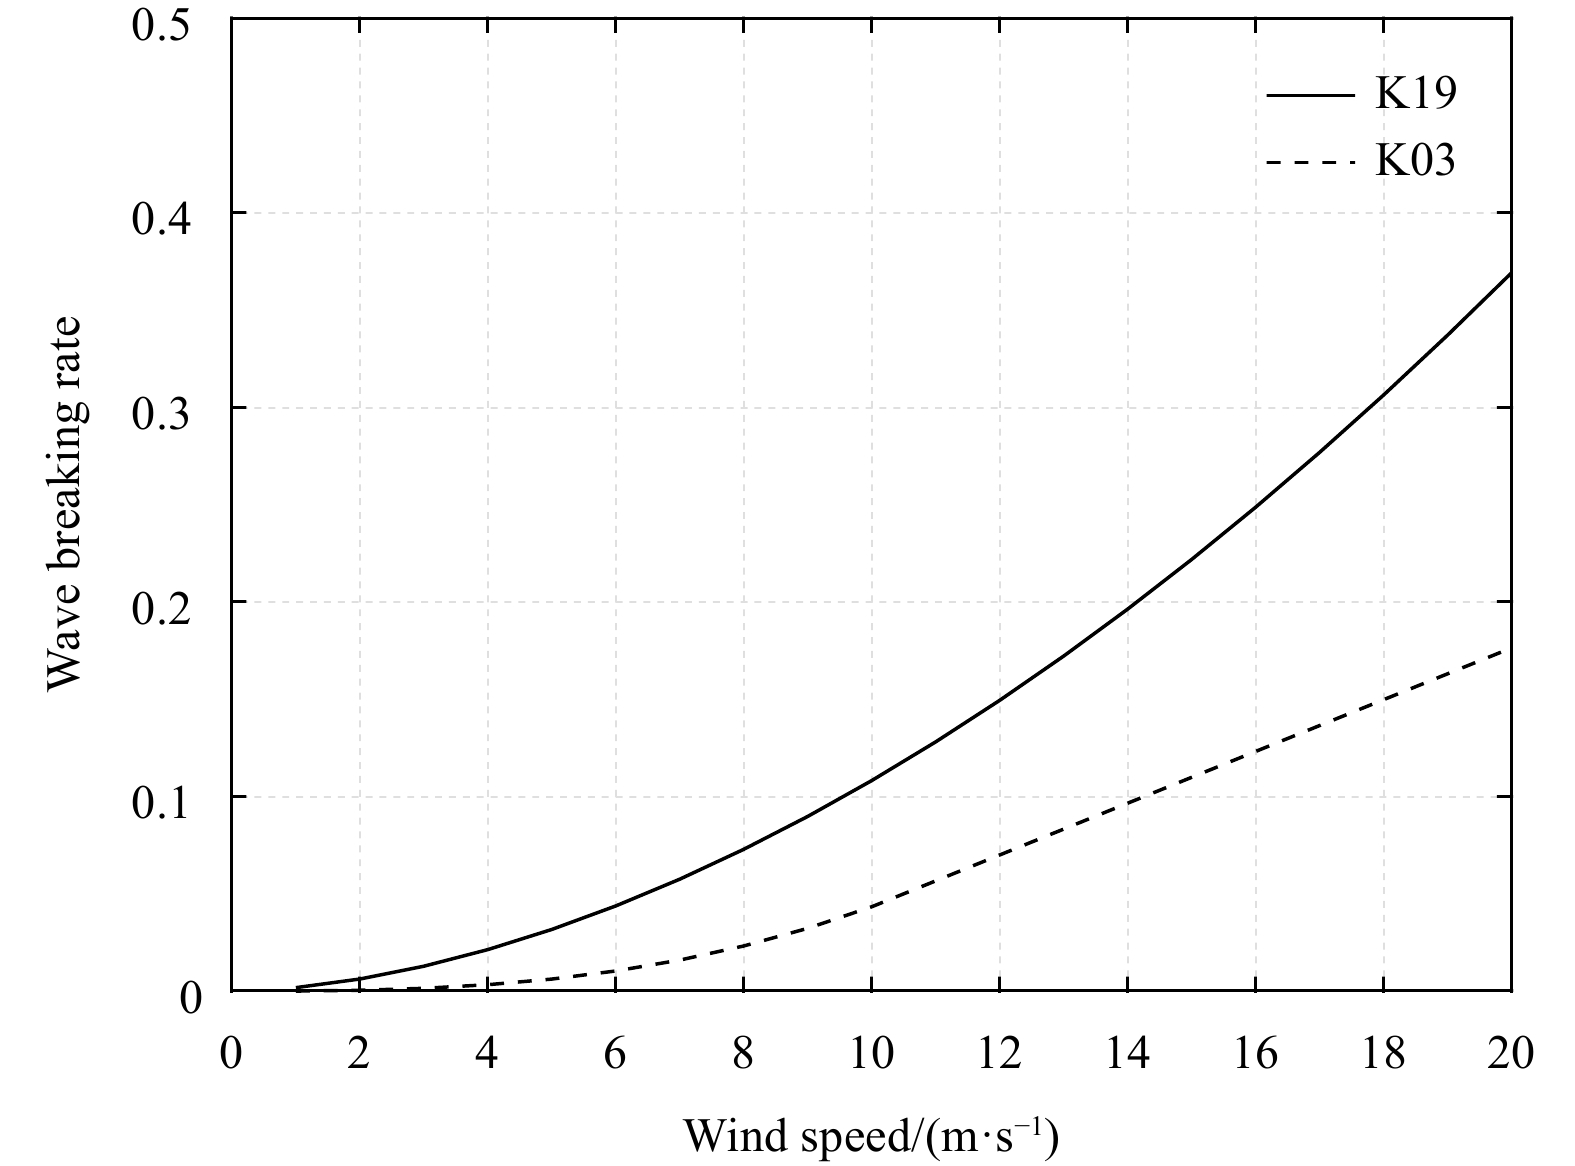
In this study a novel synthetic aperture radar (SAR) scattering model for sea surface with breaking waves is proposed. Compared with existing models, the proposed model considers an empirical relationship between wind speed and wave breaking scattering to present the contribution of wave breaking. Moreover, the scattering weight factor p, and wave breaking rate q, are performed to present the contribution of the quasi-specular scattering term, Bragg scattering term, and wave breaking scattering term to the total scattering from the sea surface. To explore the modeling accuracy of sea-surface scattering, a simulated normalized radar cross-section (NRCS) and measured NRCS are compared. The proposed model generated the simulated NRCS and a matching GF-3 dataset was used for the measured NRCS. It was revealed that the performance of the VV polarization of our model was much better than that of HH polarization, with a correlation of 0.91, bias of −0.14 dB, root mean square error (RMSE) of 1.26 dB, and scattering index (SI) of −0.11. In addition, the novel model is explored and compared with the geophysical model of CMODs and satellite-measured NRCS from GF-3 SAR wave mode imagery. For an incidence angle 40°–41°, the relationship between the NRCS and wind speed, relative wind direction is proposed. As with the SAR-measured NRCS, the performance of VV polarization was much better than HH polarization, with a correlation of 0.99, bias of −0.25 dB, RMSE of 0.64 dB, and SI of −0.04.
Article$Marine Information Science
Spatio-temporal analysis of the melt onset dates over Arctic sea ice from 1979 to 2017
Shuang Liang, Jiangyuan Zeng, Zhen Li, Dejing Qiao
2022, 41(4): 146-156. doi: 10.1007/s13131-021-1827-x
Abstract:
The melt onset dates (MOD) over Arctic sea ice plays an important role in the seasonal cycle of sea ice surface properties, which impacts Arctic surface solar radiation absorbed by the ice-ocean system. Monitoring interannual variations in MOD is valuable for understanding climate change. In this study, we investigated the spatio-temporal variability of MOD over Arctic sea ice and 14 Arctic sub-regions in the period of 1979 to 2017 from passive microwave satellite data. A set of mathematical and statistical methods, including the Sen’s slope and Mann-Kendall mutation tests, were used to comprehensively assess the variation trend and abrupt points of MOD during the past 39 years for different Arctic sub-regions. Additionally, the correlation between Arctic Oscillation (AO) and MOD was analyzed. The results indicate that: (1) all Arctic sub-regions show a trend toward earlier MOD except the Bering Sea and St. Lawrence Gulf. The East Siberian Sea exhibits a significantly earlier trend, with the highest rate of −9.45 d/decade; (2) the temporal variability and statistical significance of MOD trend exhibit large interannual differences with different time windows for most regions in the Arctic; (3) during the past 39 years, the MOD changed abruptly in different years for different sub-regions; (4) the seasonal AO has more influence on MOD than monthly AO. The findings in this study can improve our knowledge of MOD changes and are beneficial for further Arctic climate change study.