2024 Vol. 43, No. 5
Display Method:
2024, 43(5): .
Abstract:
2024, 43(5): 1-15.
doi: 10.1007/s13131-024-2317-8
Abstract:
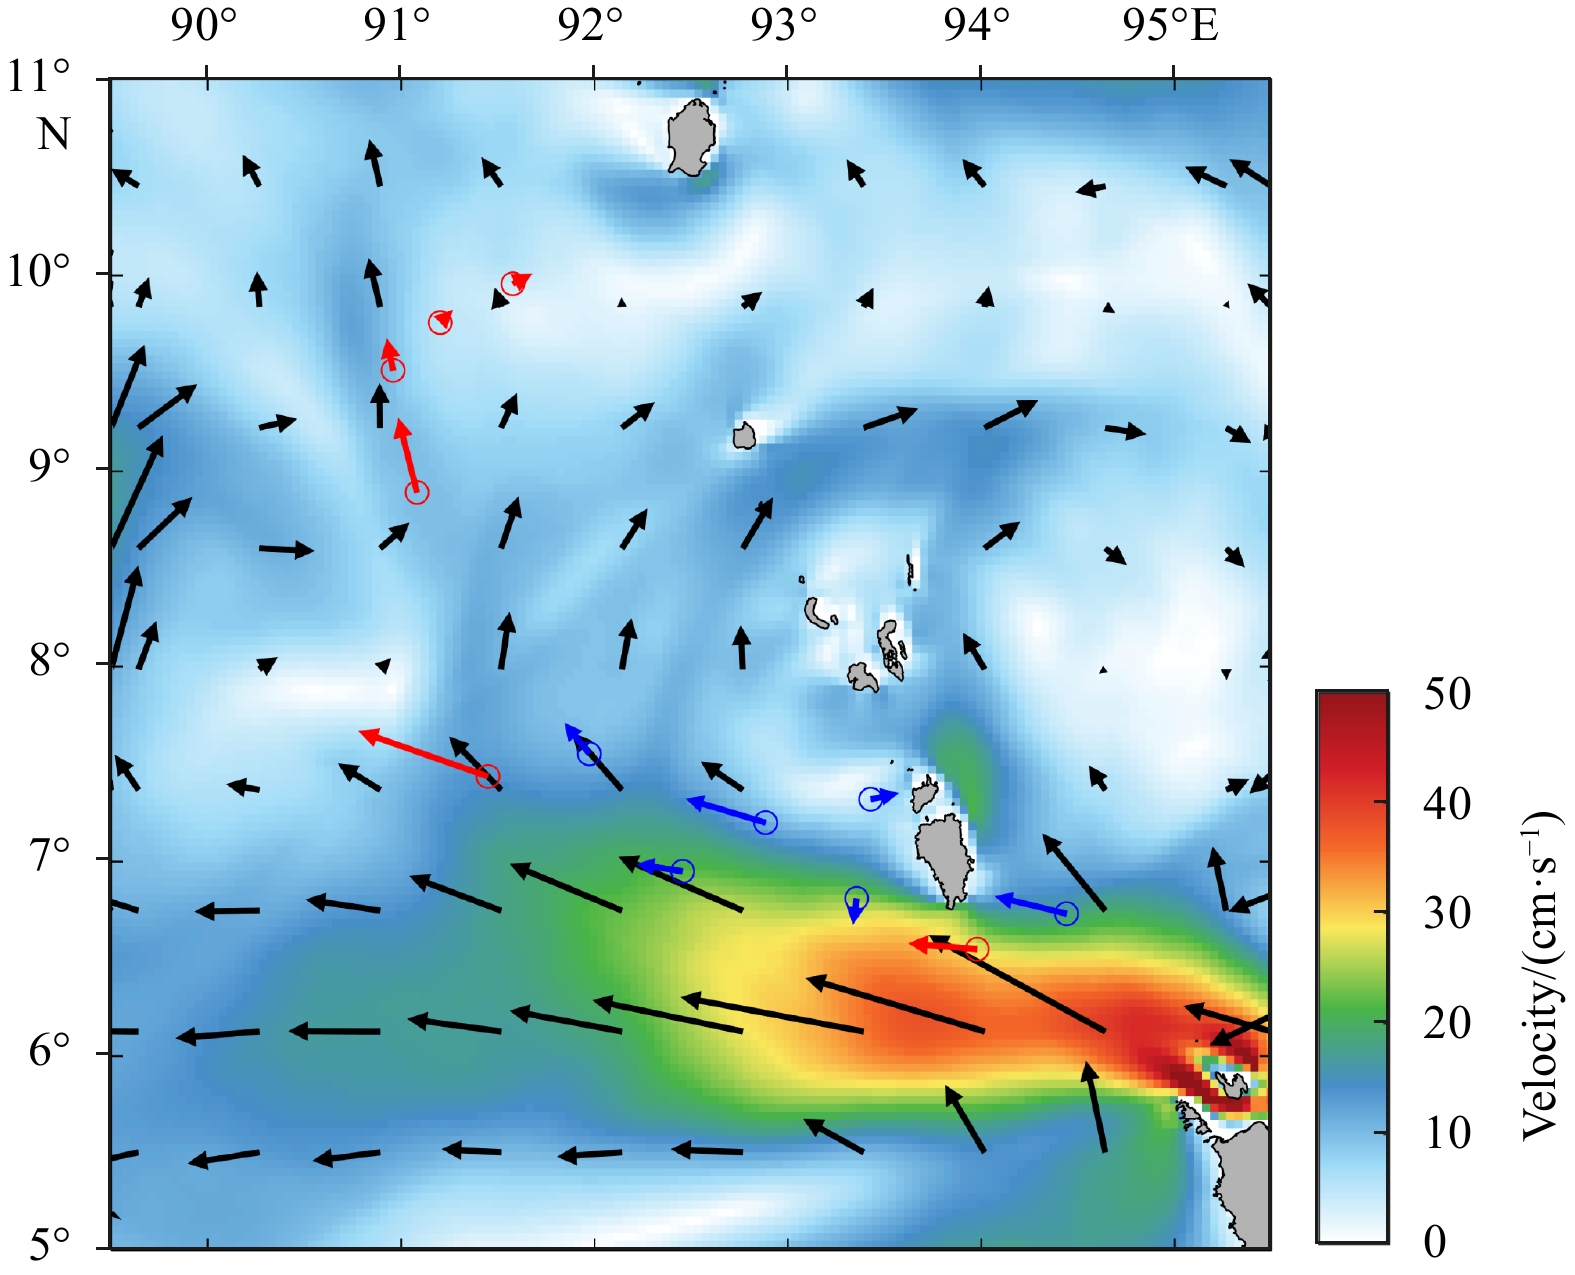
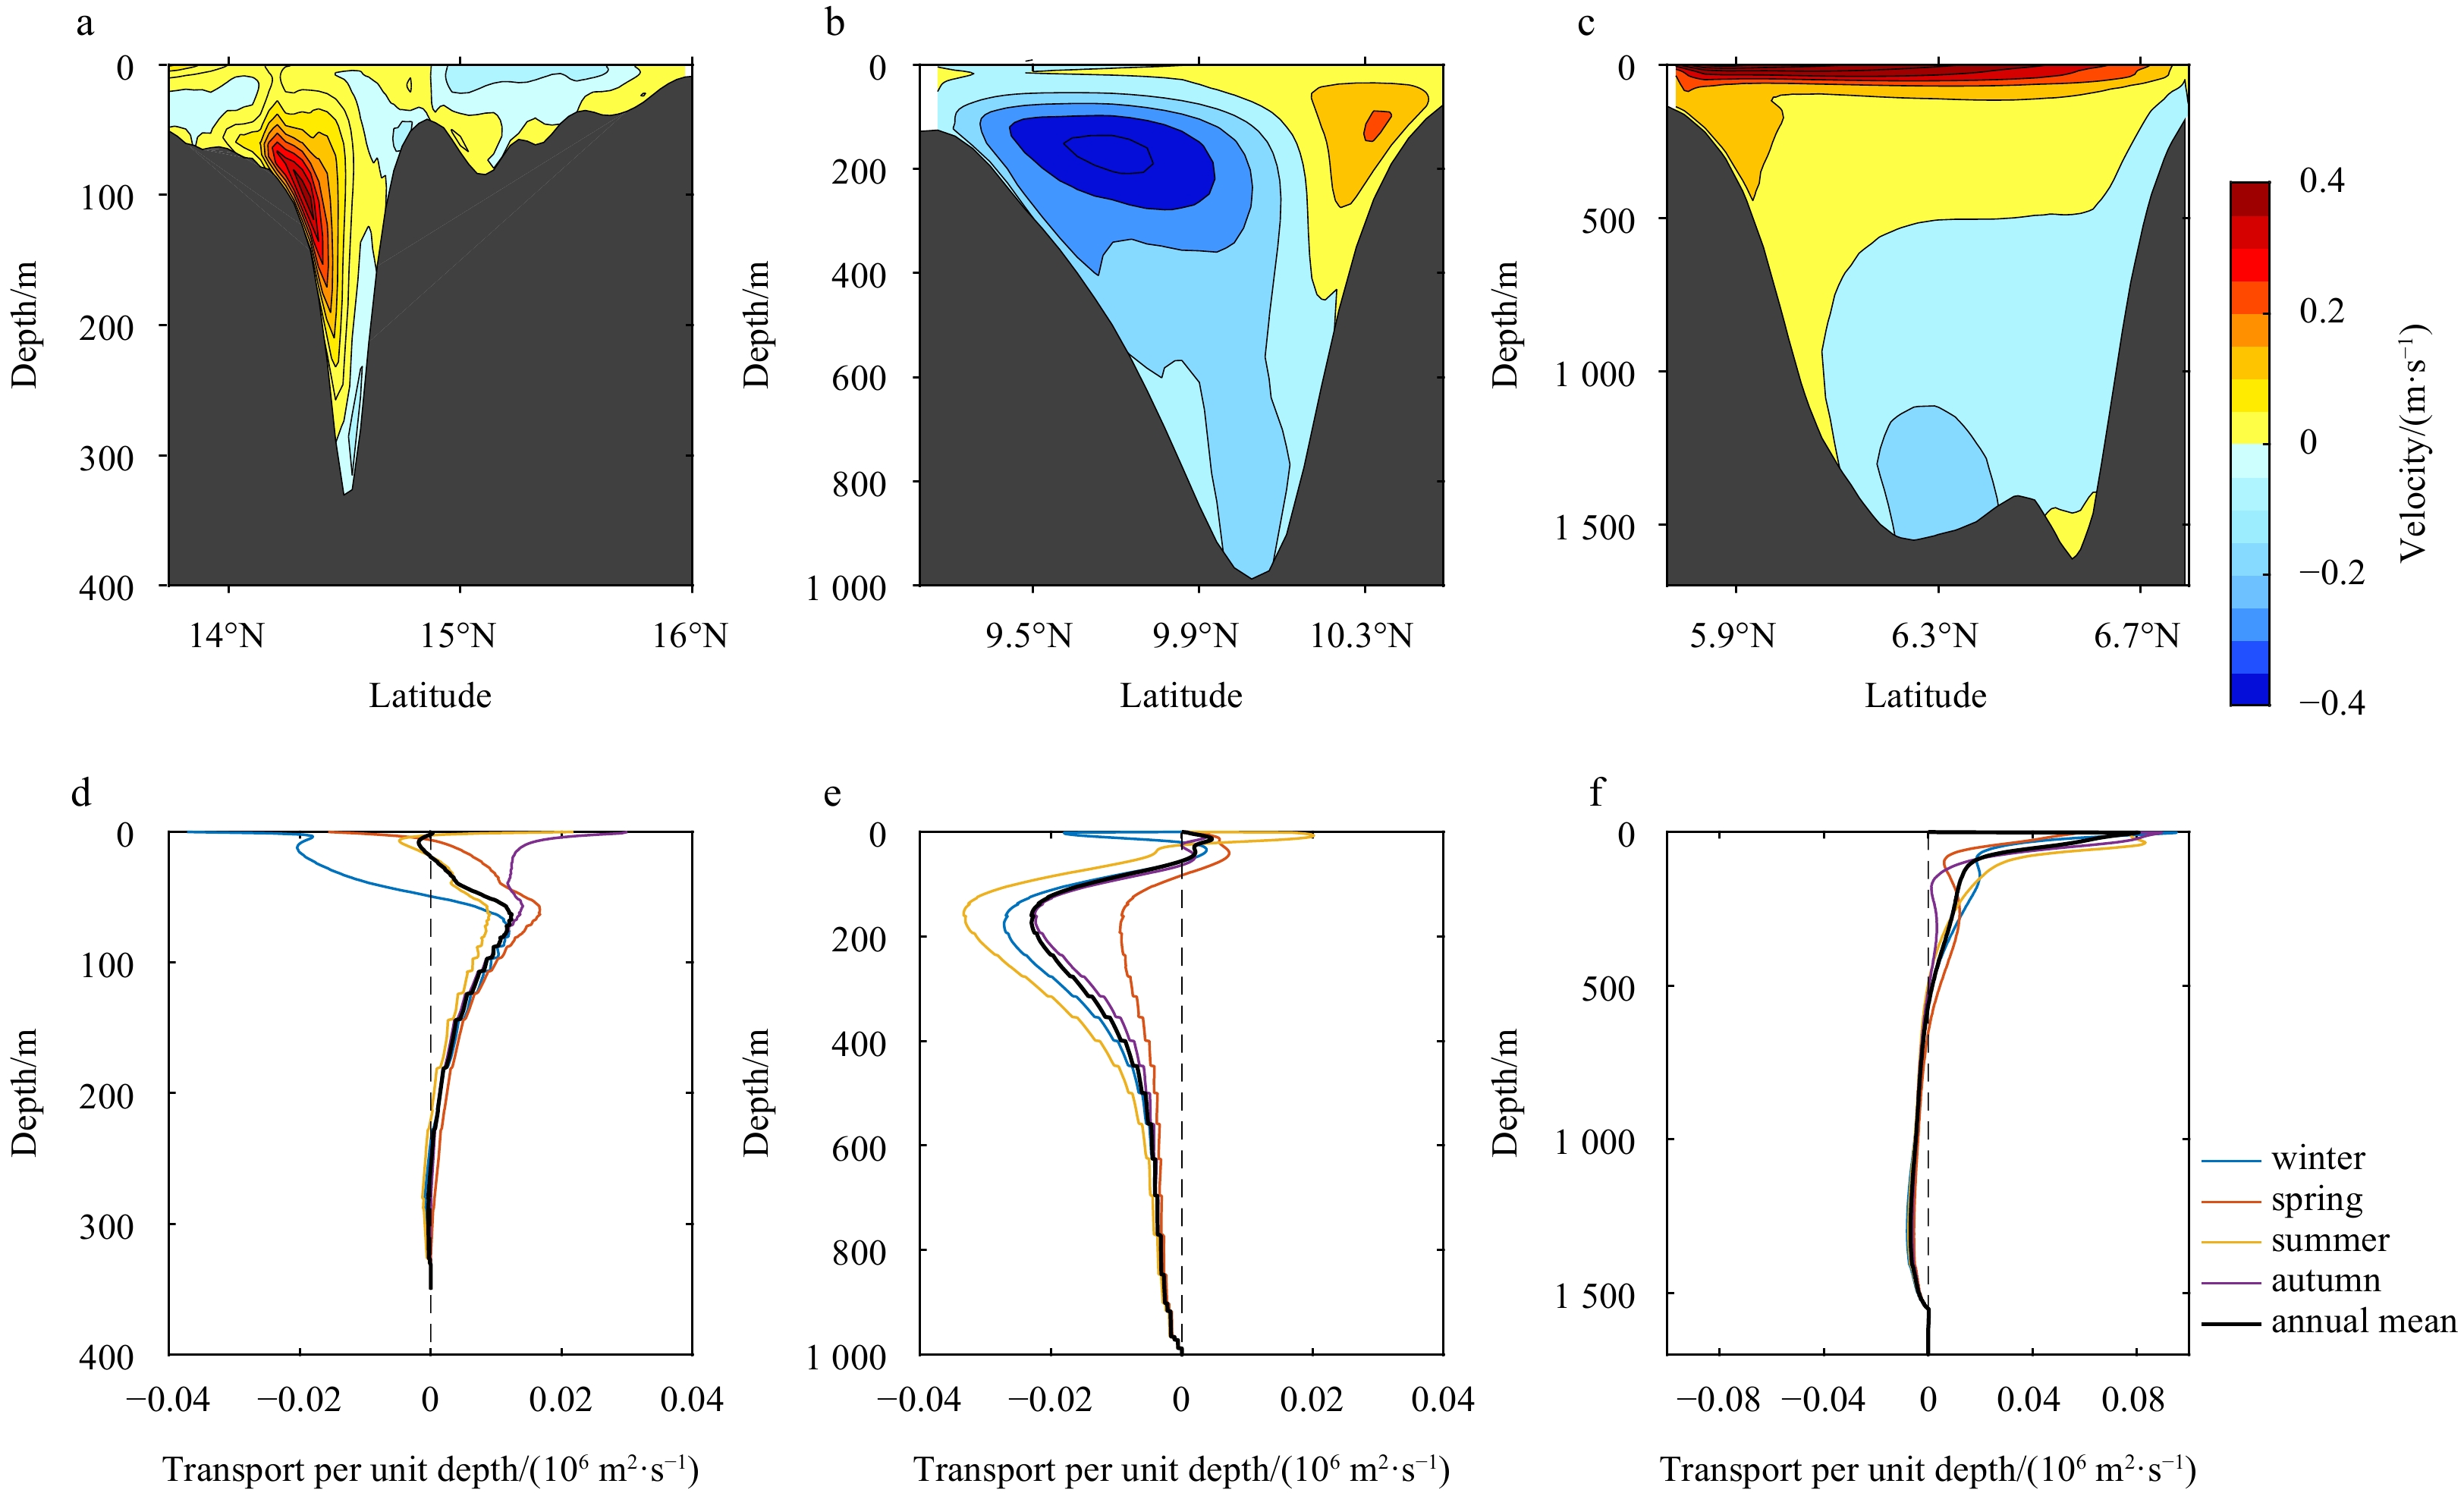
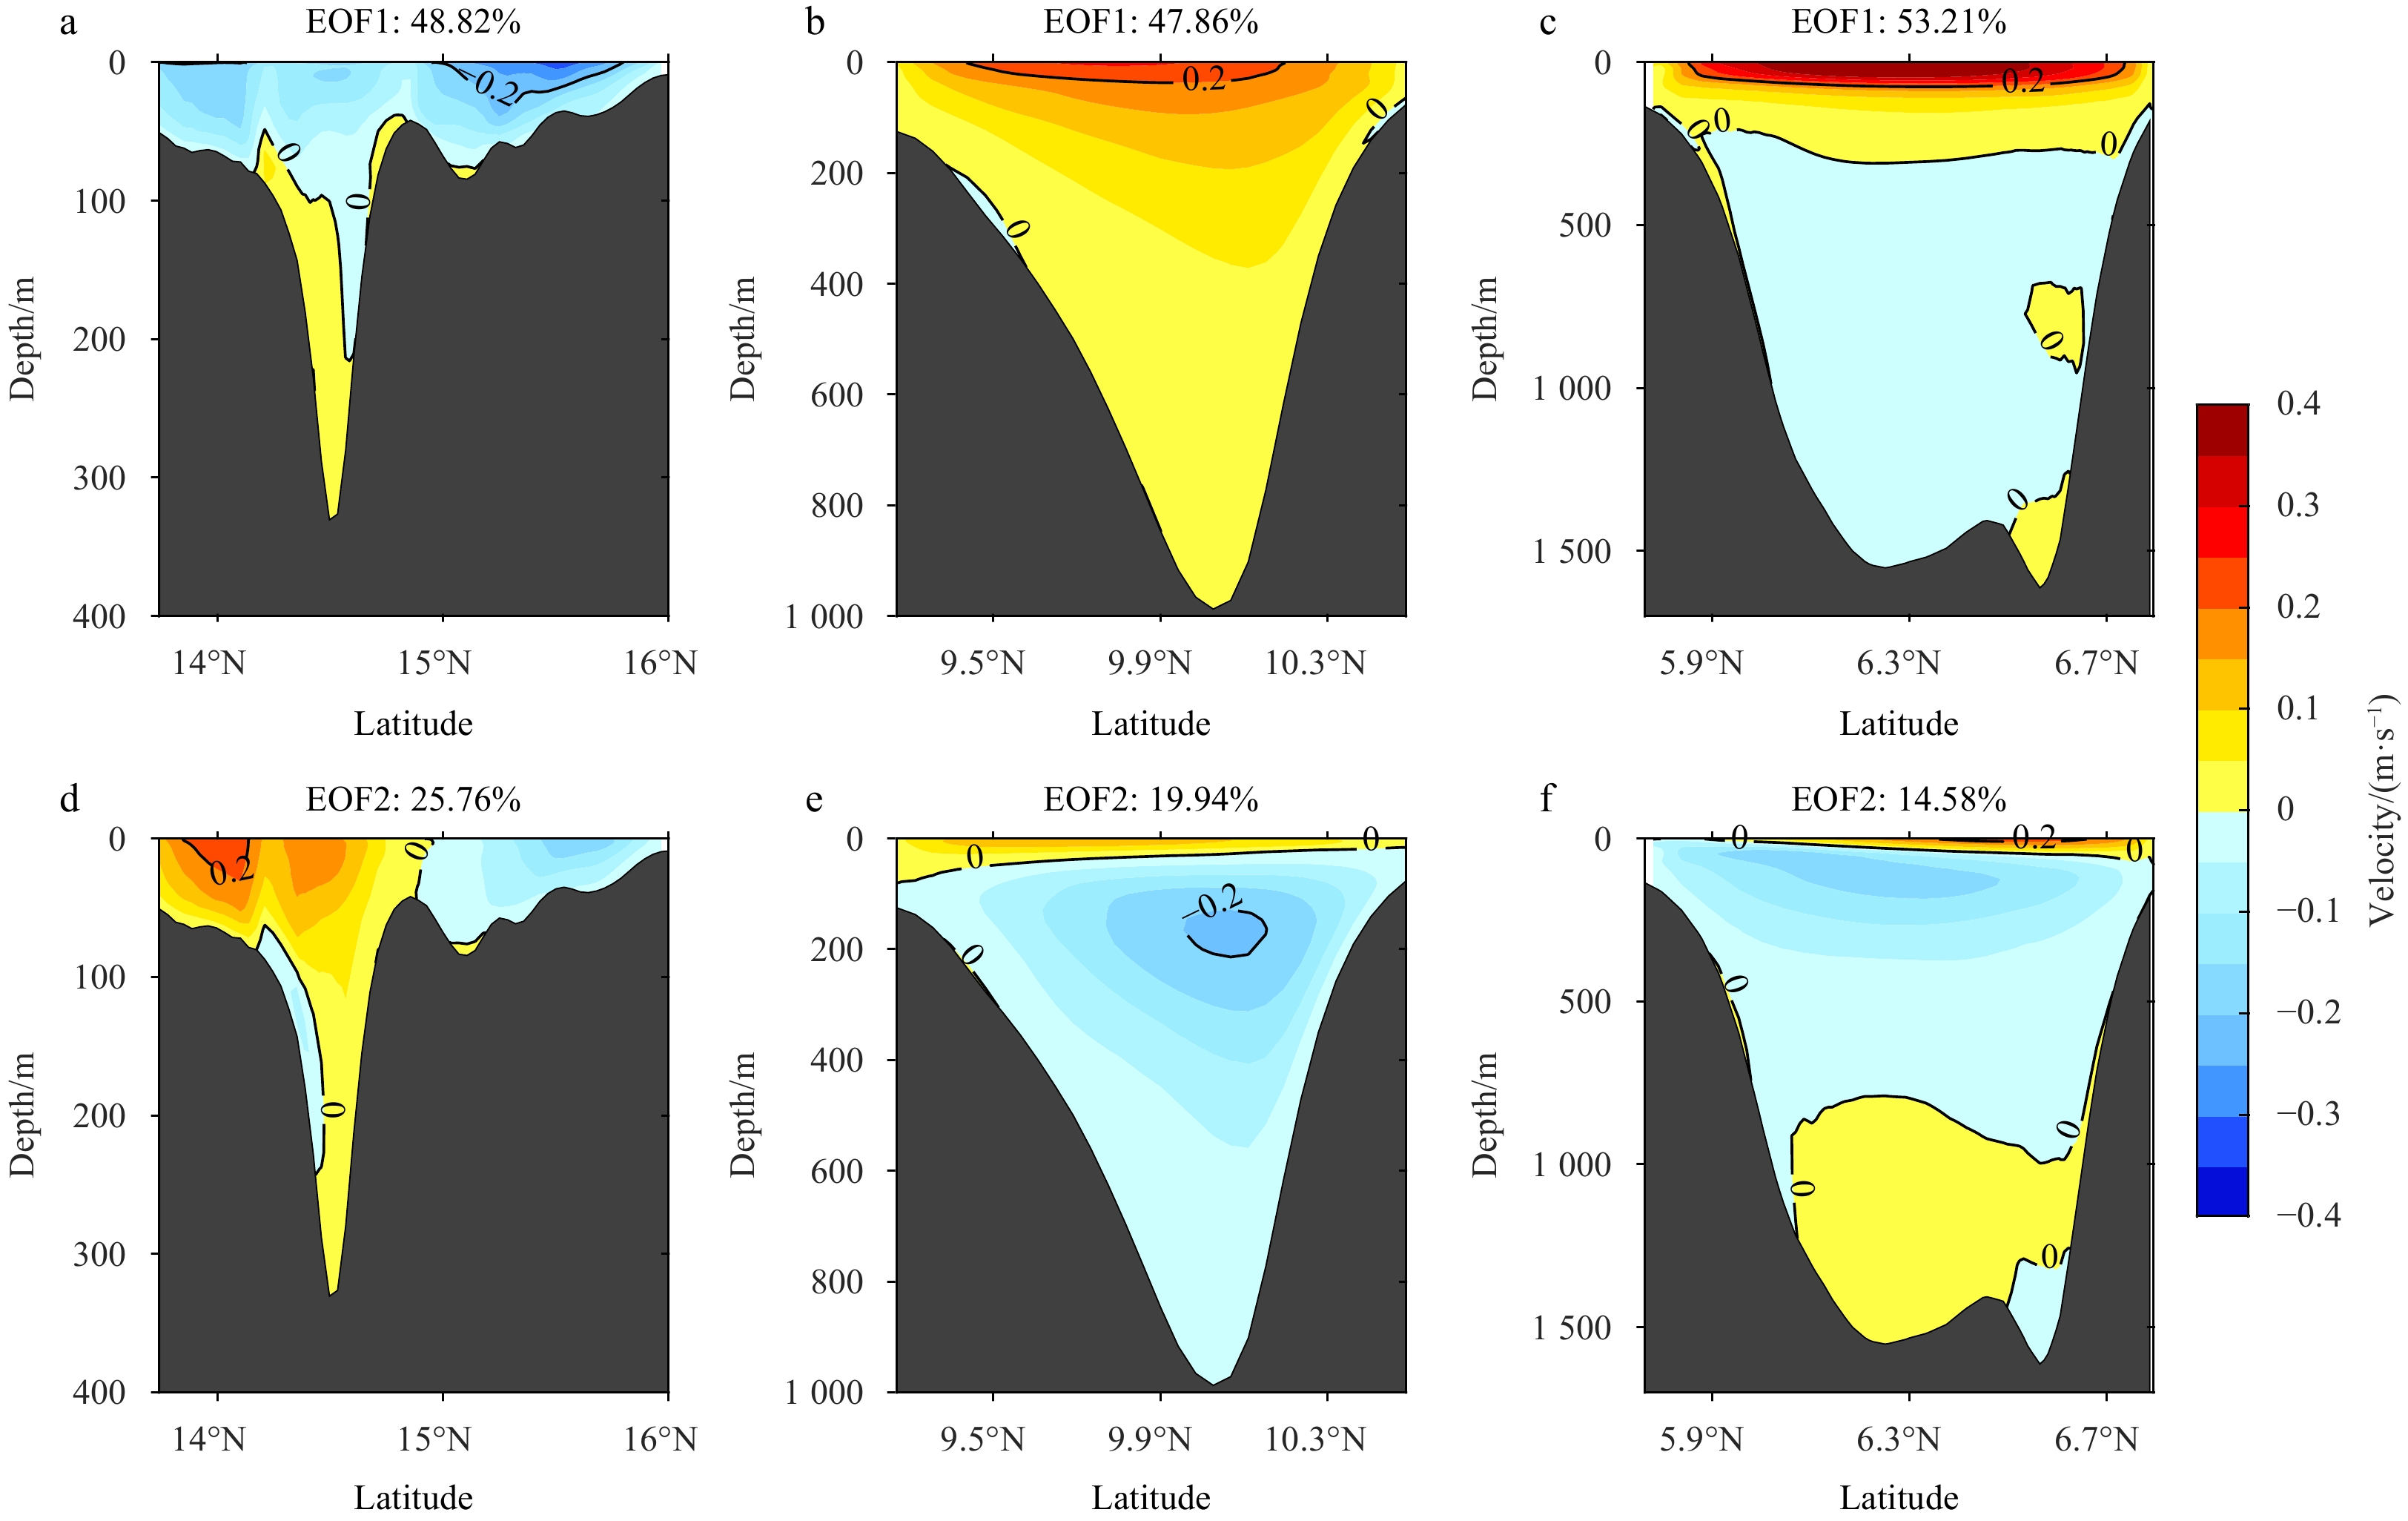
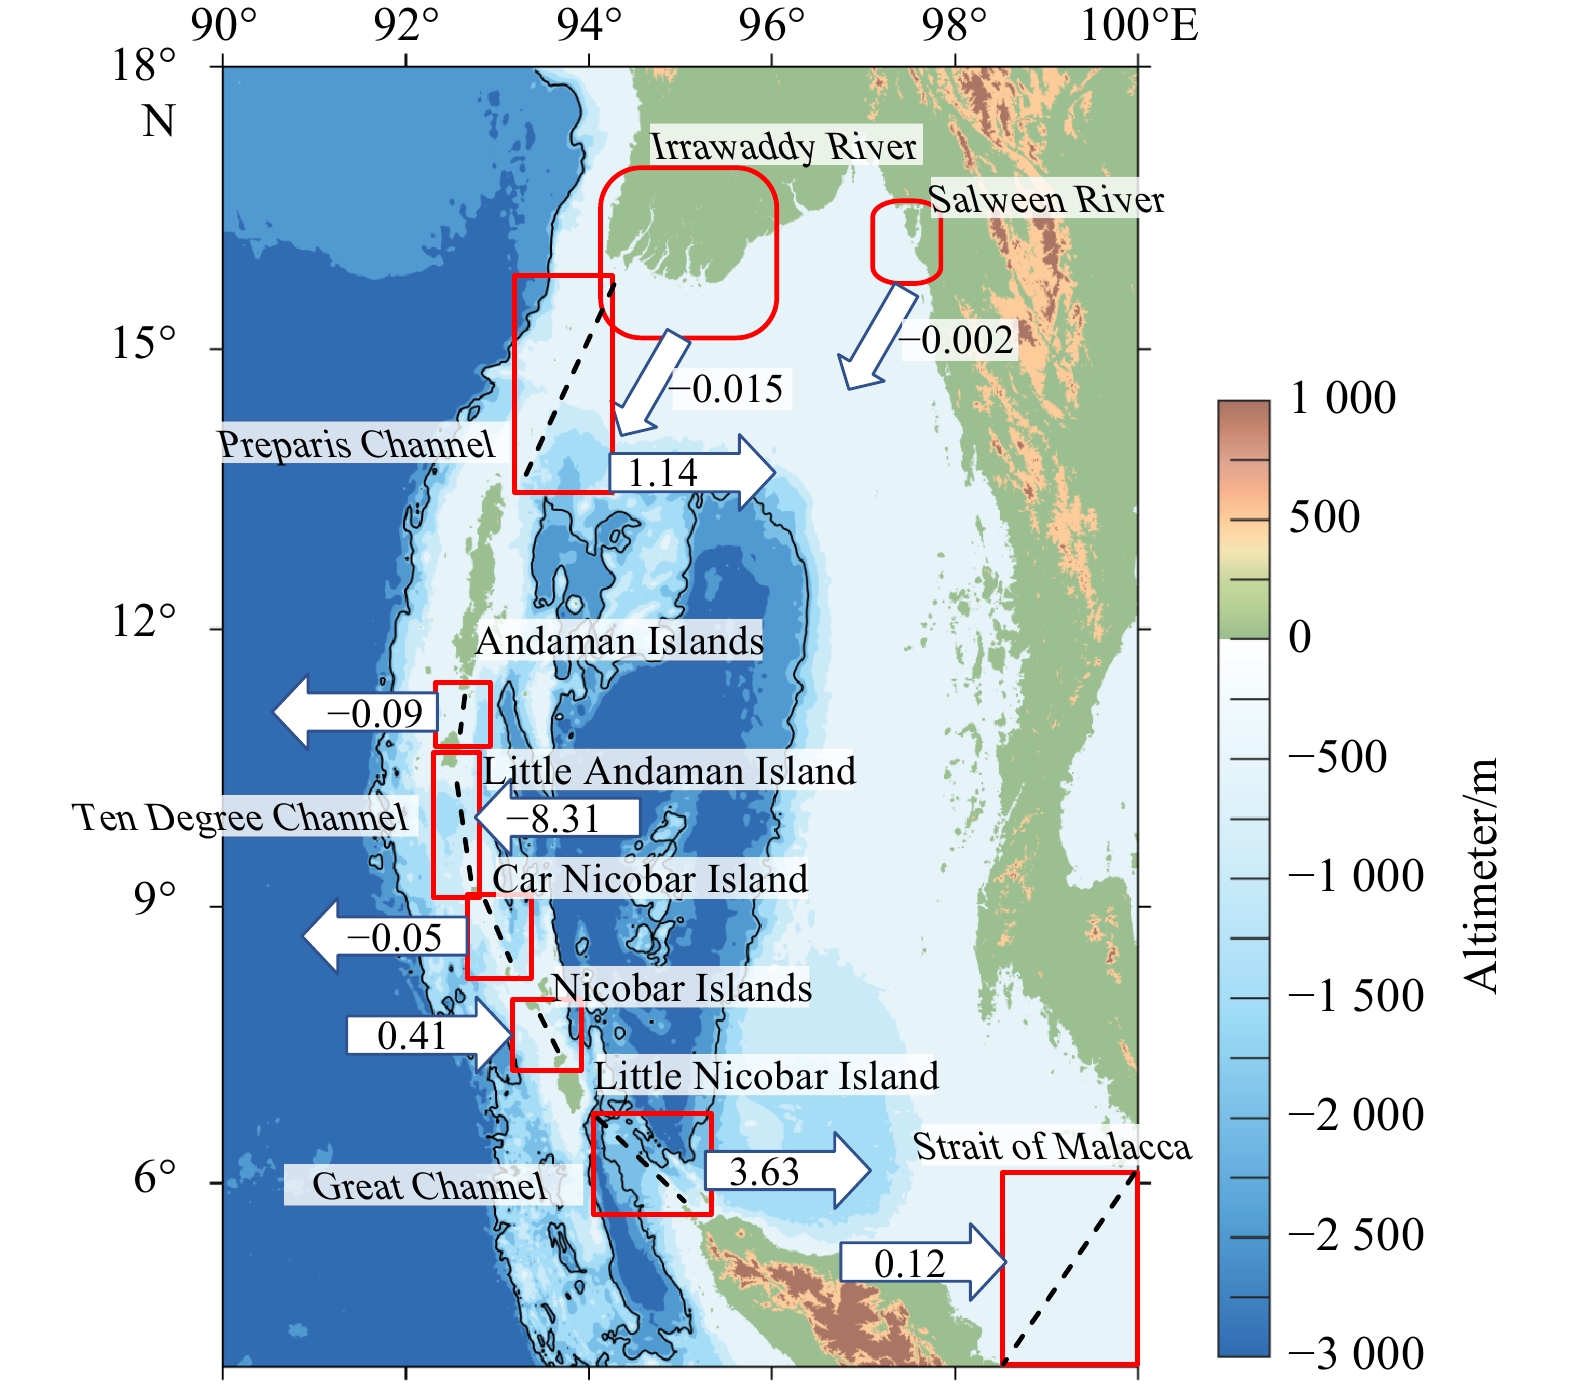
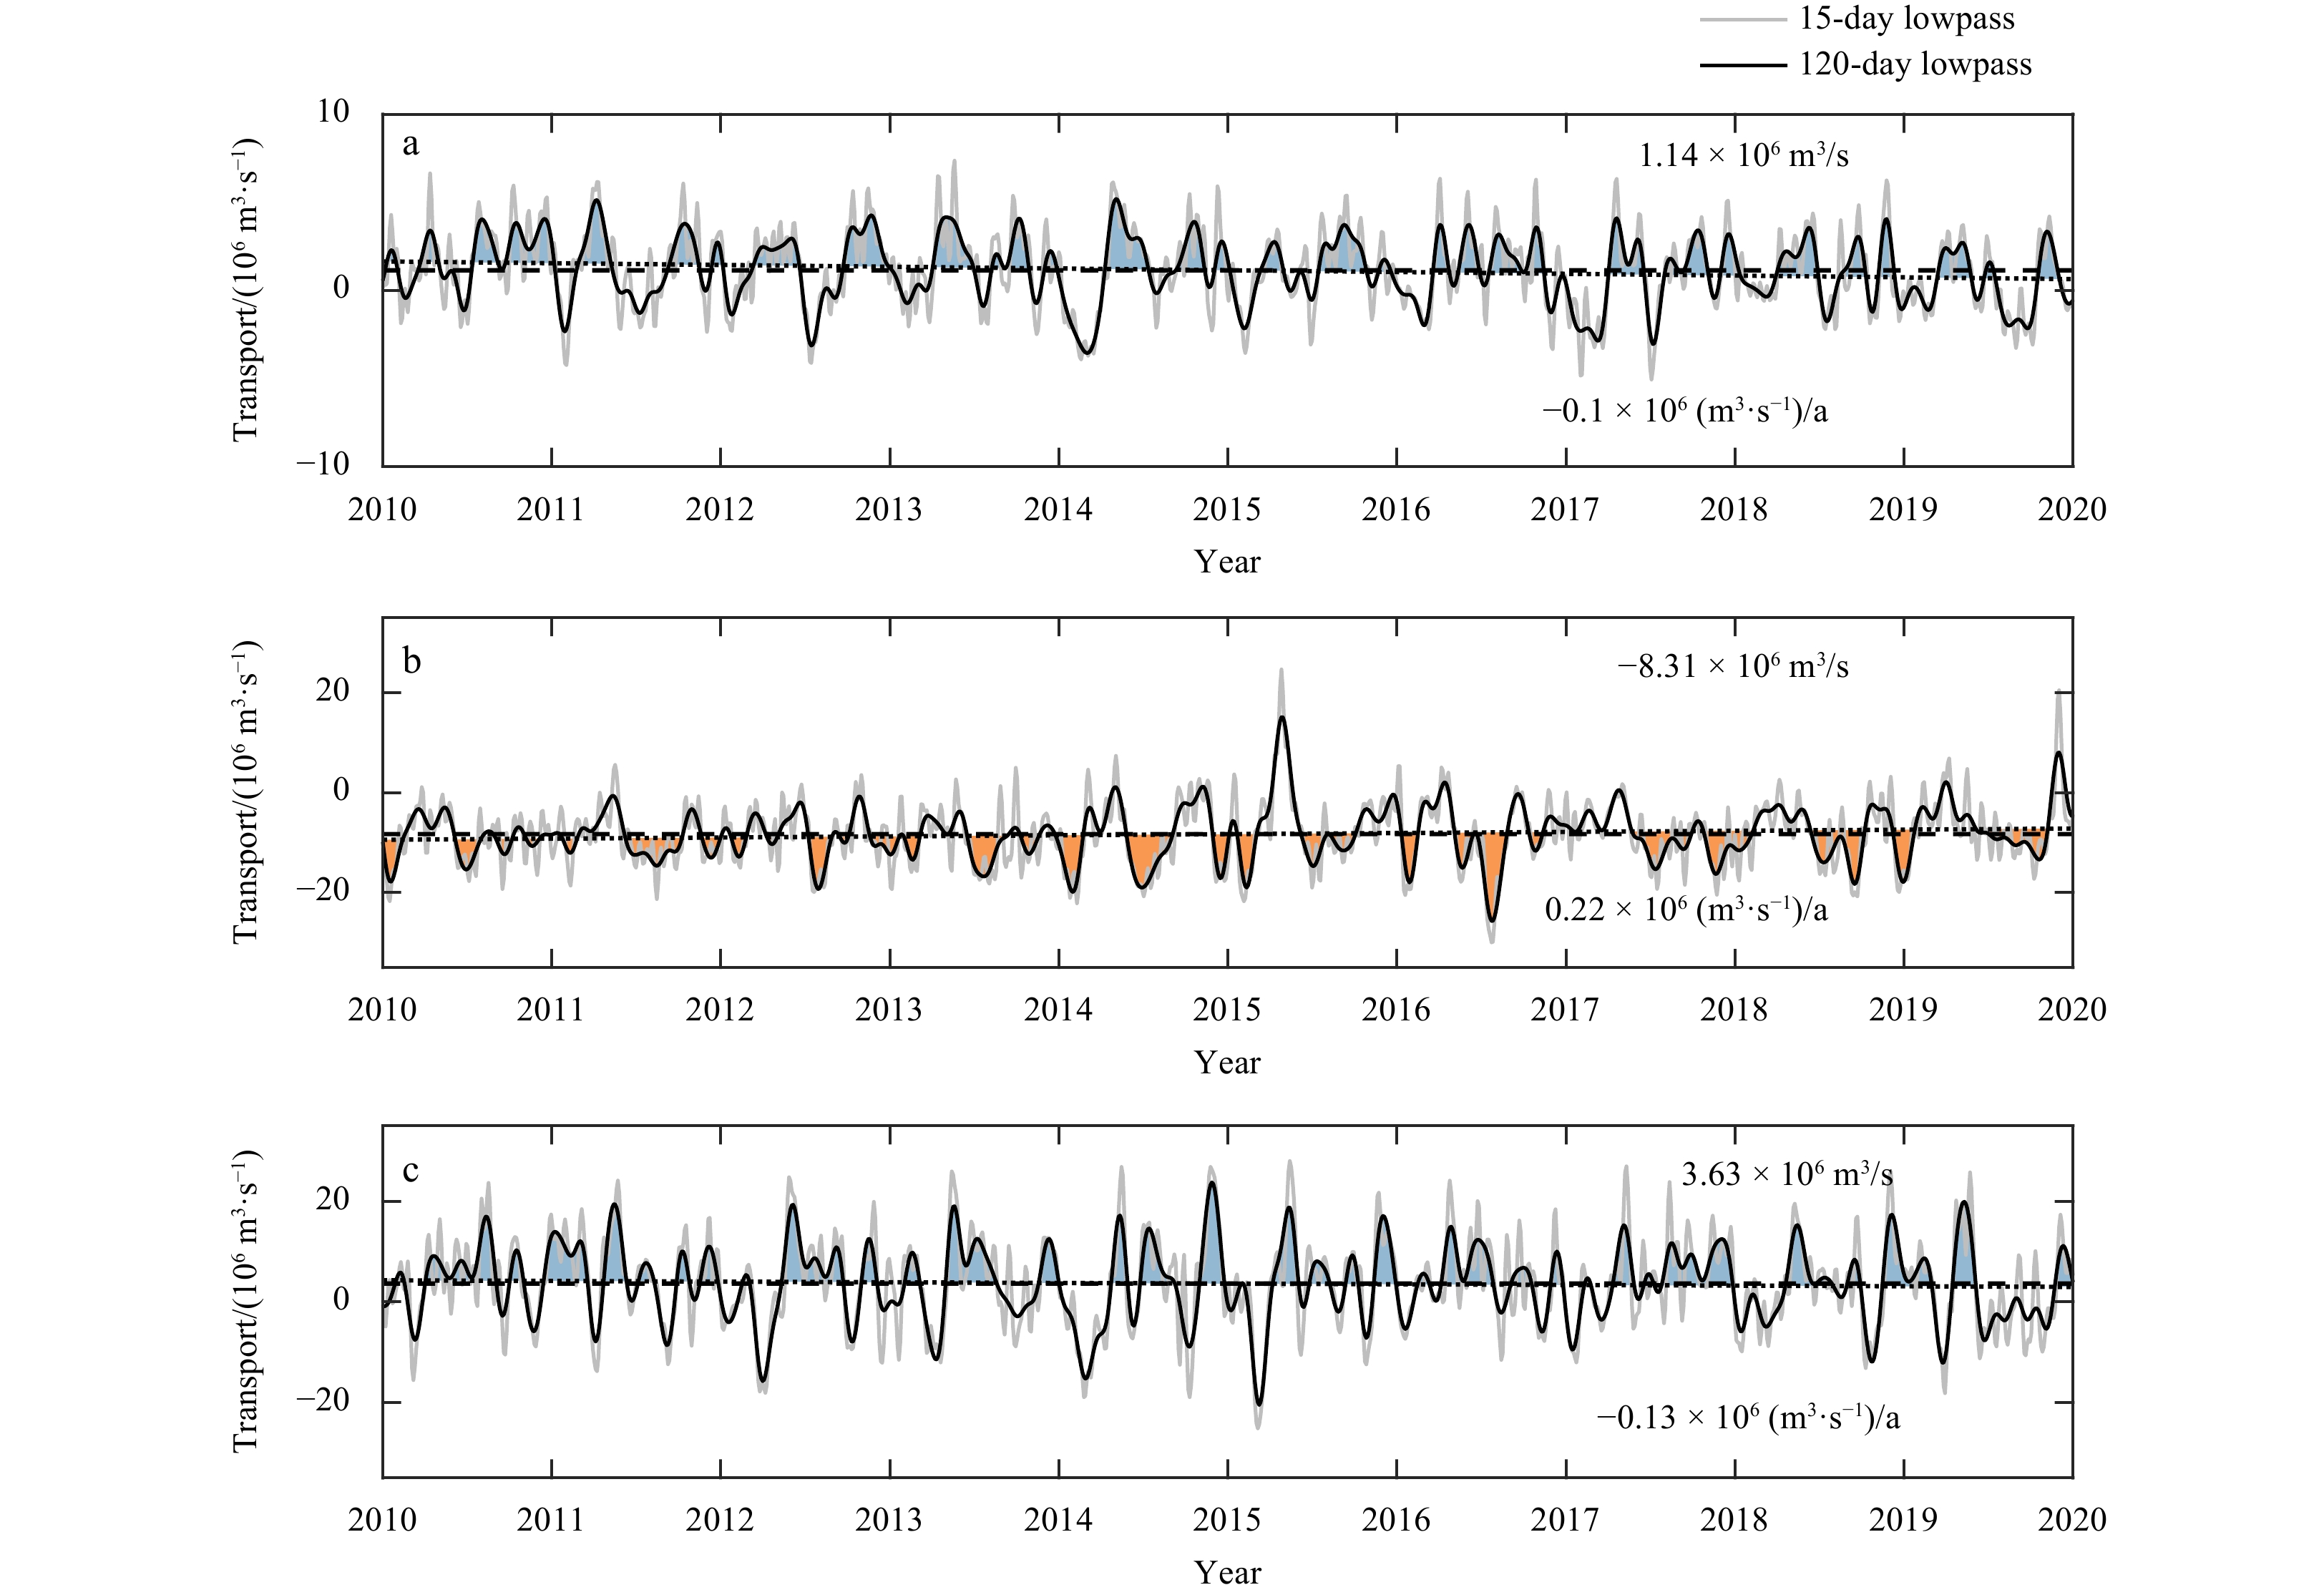
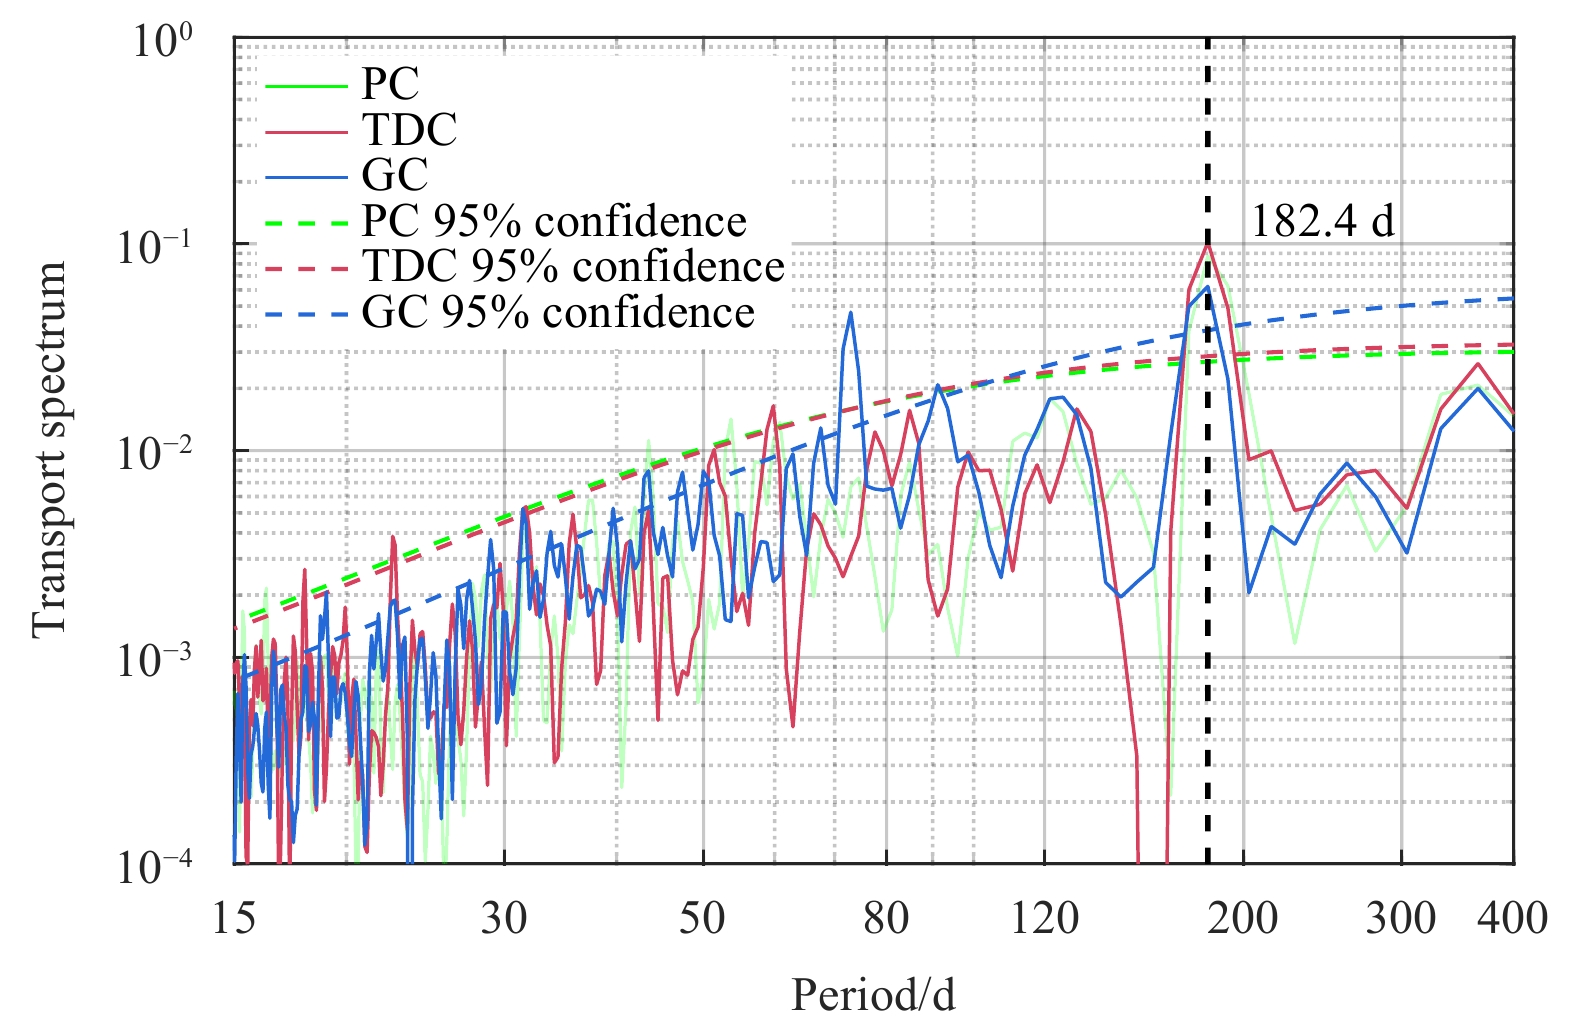
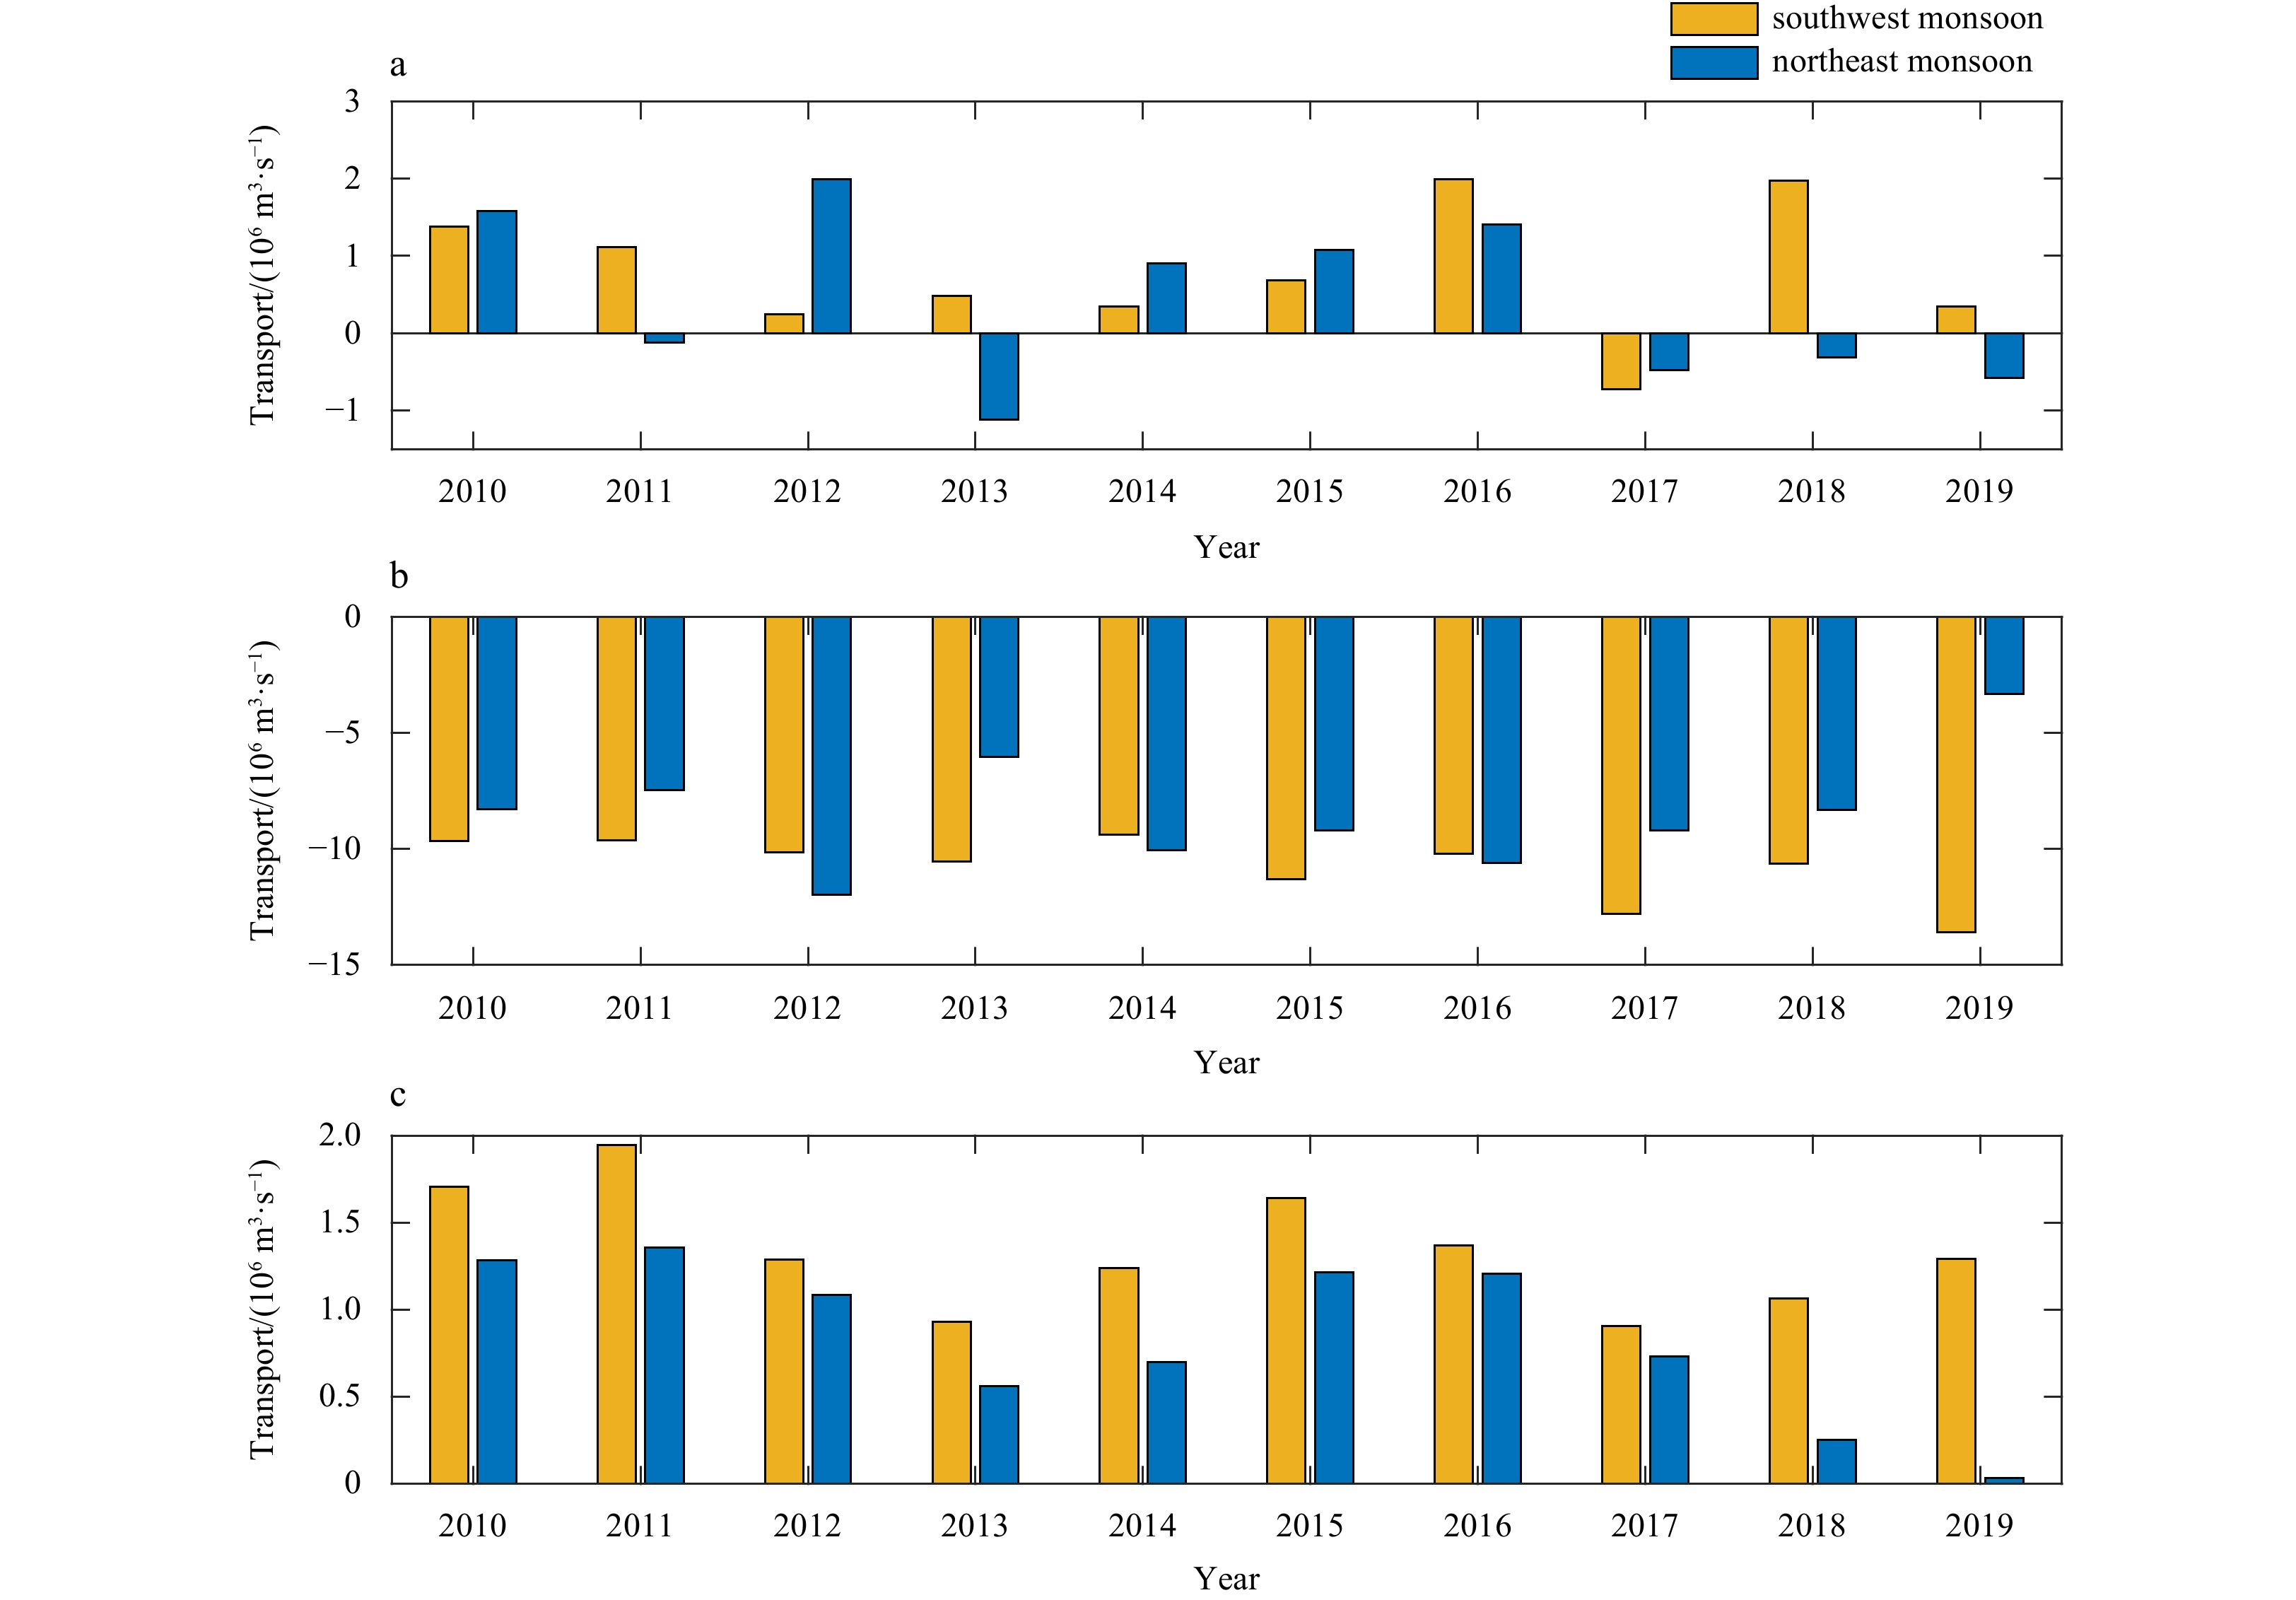
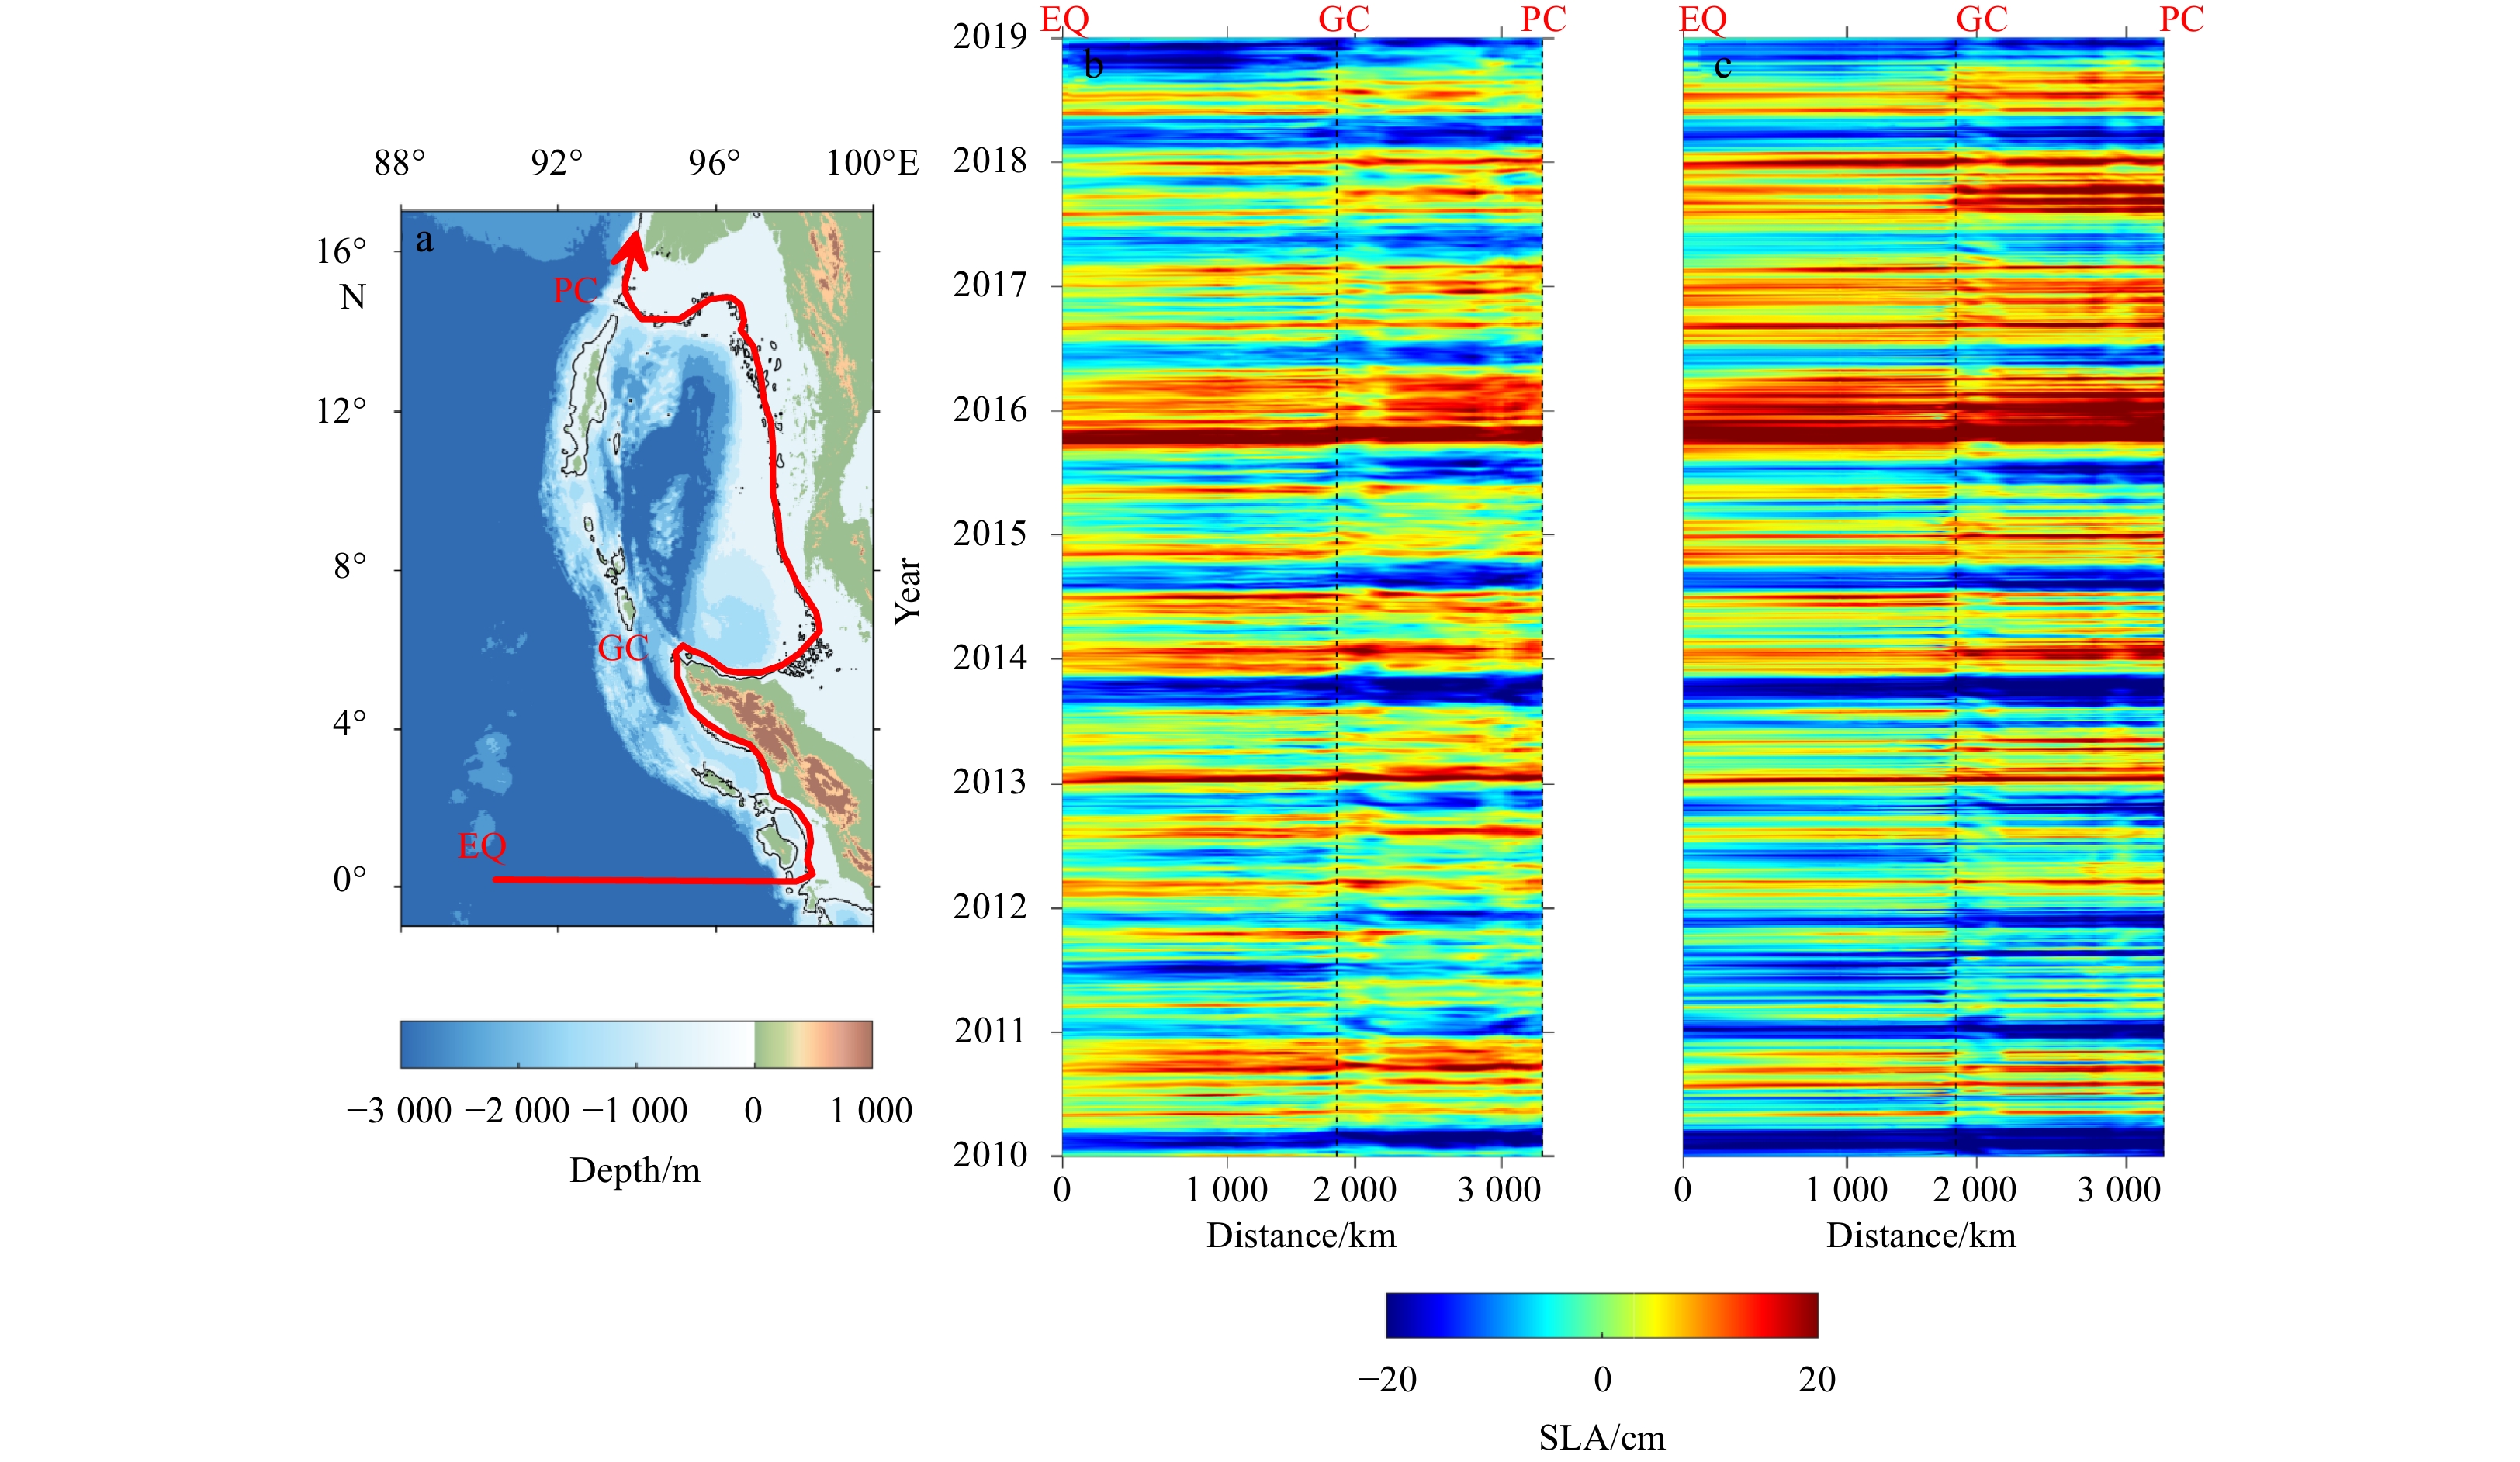
A high-resolution customized numerical model is used to analyze the water transport in the three major water passages between the Andaman Sea (AS) and the Bay of Bengal, i.e., the Preparis Channel (PC), the Ten Degree Channel (TDC), and the Great Channel (GC), based on the daily averaged simulation results ranging from 2010 to 2019. Spectral analysis and Empirical Orthogonal Function (EOF) methods are employed to investigate the spatiotemporal variability of the water exchange and controlling mechanisms. The results of model simulation indicate that the net average transports of the PC and GC, as well as their linear trend, are opposite to that of the TDC. This indicates that the PC and the GC are the main inflow channels of the AS, while the TDC is the main outflow channel of the AS. The transport variability is most pronounced at surface levels and between 100 m and 200 m depth, likely affected by monsoons and circulation. A 182.4-d semiannual variability is consistently seen in all three channels, which is also evident in their second principal components. Based on sea level anomalies and EOF analysis results, this is primarily due to equatorial winds during the monsoon transition period, causing eastward movement of Kelvin waves along the AS coast, thereby affecting the spatiotemporal characteristics of the flow in the AS. The first EOF of the PC flow field section shows a split at 100 m deep, likely due to topography. The first EOF of the TDC flow field section is steady but has potent seasonal oscillations in its time series. Meanwhile, the first EOF of the GC flow field section indicates a stable surface inflow, probably influenced by the equatorial Indian Ocean’s eastward current.
A high-resolution customized numerical model is used to analyze the water transport in the three major water passages between the Andaman Sea (AS) and the Bay of Bengal, i.e., the Preparis Channel (PC), the Ten Degree Channel (TDC), and the Great Channel (GC), based on the daily averaged simulation results ranging from 2010 to 2019. Spectral analysis and Empirical Orthogonal Function (EOF) methods are employed to investigate the spatiotemporal variability of the water exchange and controlling mechanisms. The results of model simulation indicate that the net average transports of the PC and GC, as well as their linear trend, are opposite to that of the TDC. This indicates that the PC and the GC are the main inflow channels of the AS, while the TDC is the main outflow channel of the AS. The transport variability is most pronounced at surface levels and between 100 m and 200 m depth, likely affected by monsoons and circulation. A 182.4-d semiannual variability is consistently seen in all three channels, which is also evident in their second principal components. Based on sea level anomalies and EOF analysis results, this is primarily due to equatorial winds during the monsoon transition period, causing eastward movement of Kelvin waves along the AS coast, thereby affecting the spatiotemporal characteristics of the flow in the AS. The first EOF of the PC flow field section shows a split at 100 m deep, likely due to topography. The first EOF of the TDC flow field section is steady but has potent seasonal oscillations in its time series. Meanwhile, the first EOF of the GC flow field section indicates a stable surface inflow, probably influenced by the equatorial Indian Ocean’s eastward current.


2024, 43(5): 16-29.
doi: 10.1007/s13131-023-2295-x
Abstract:
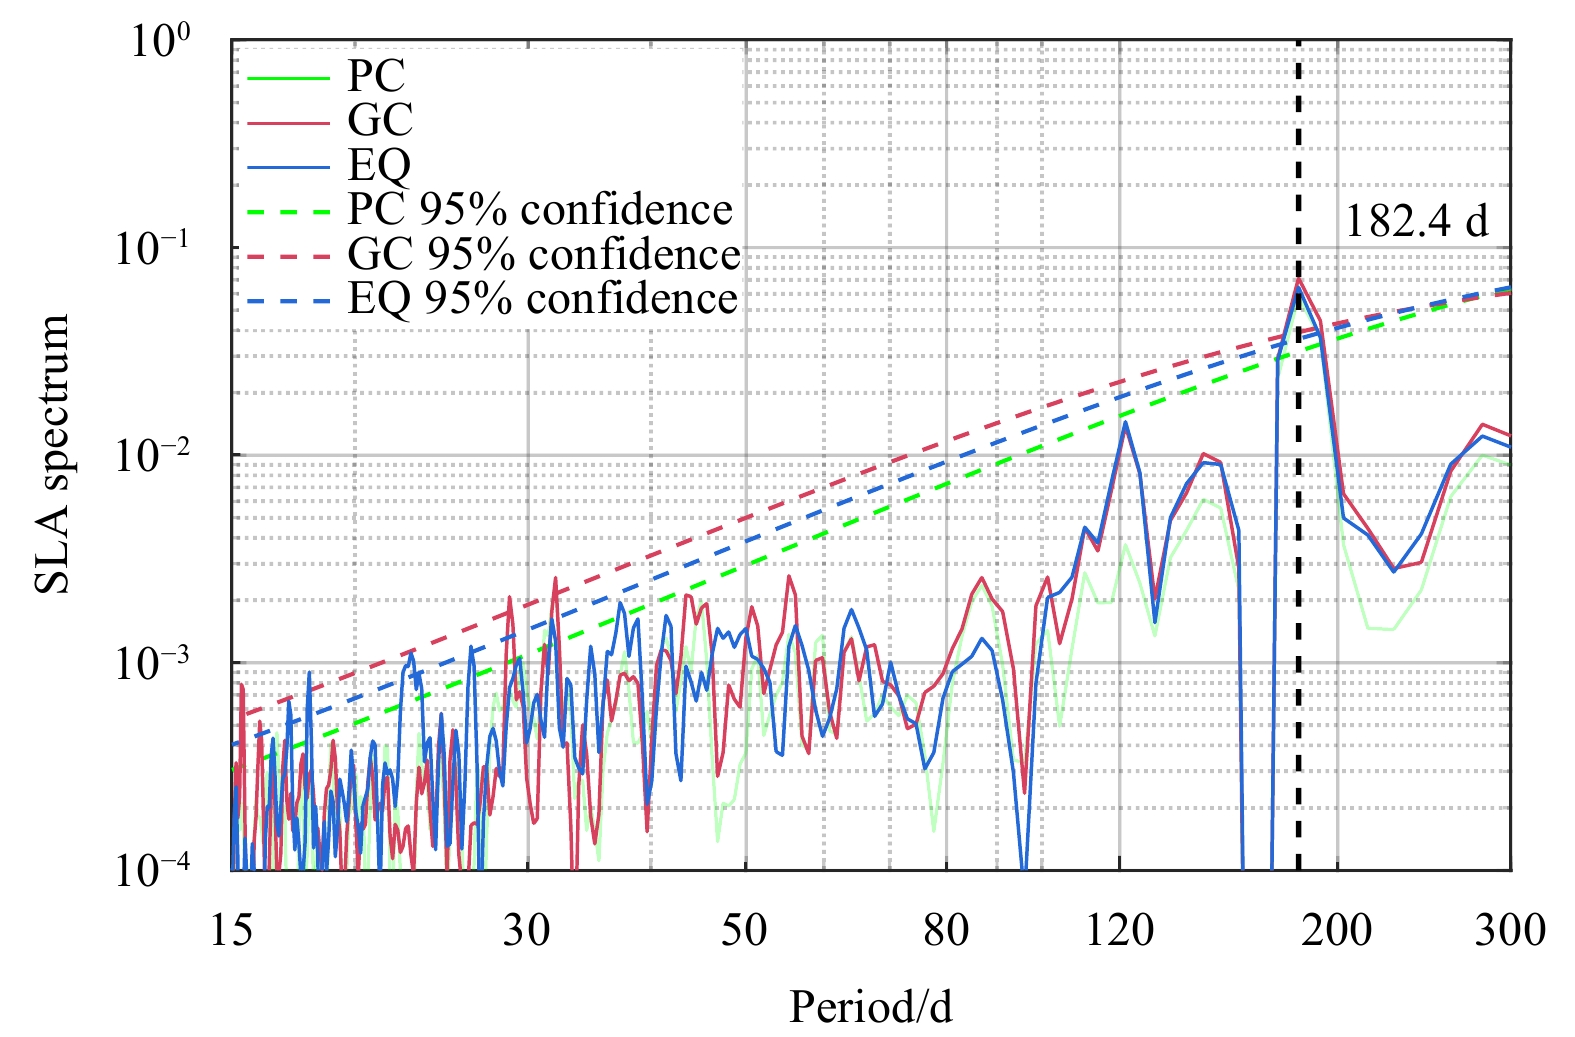
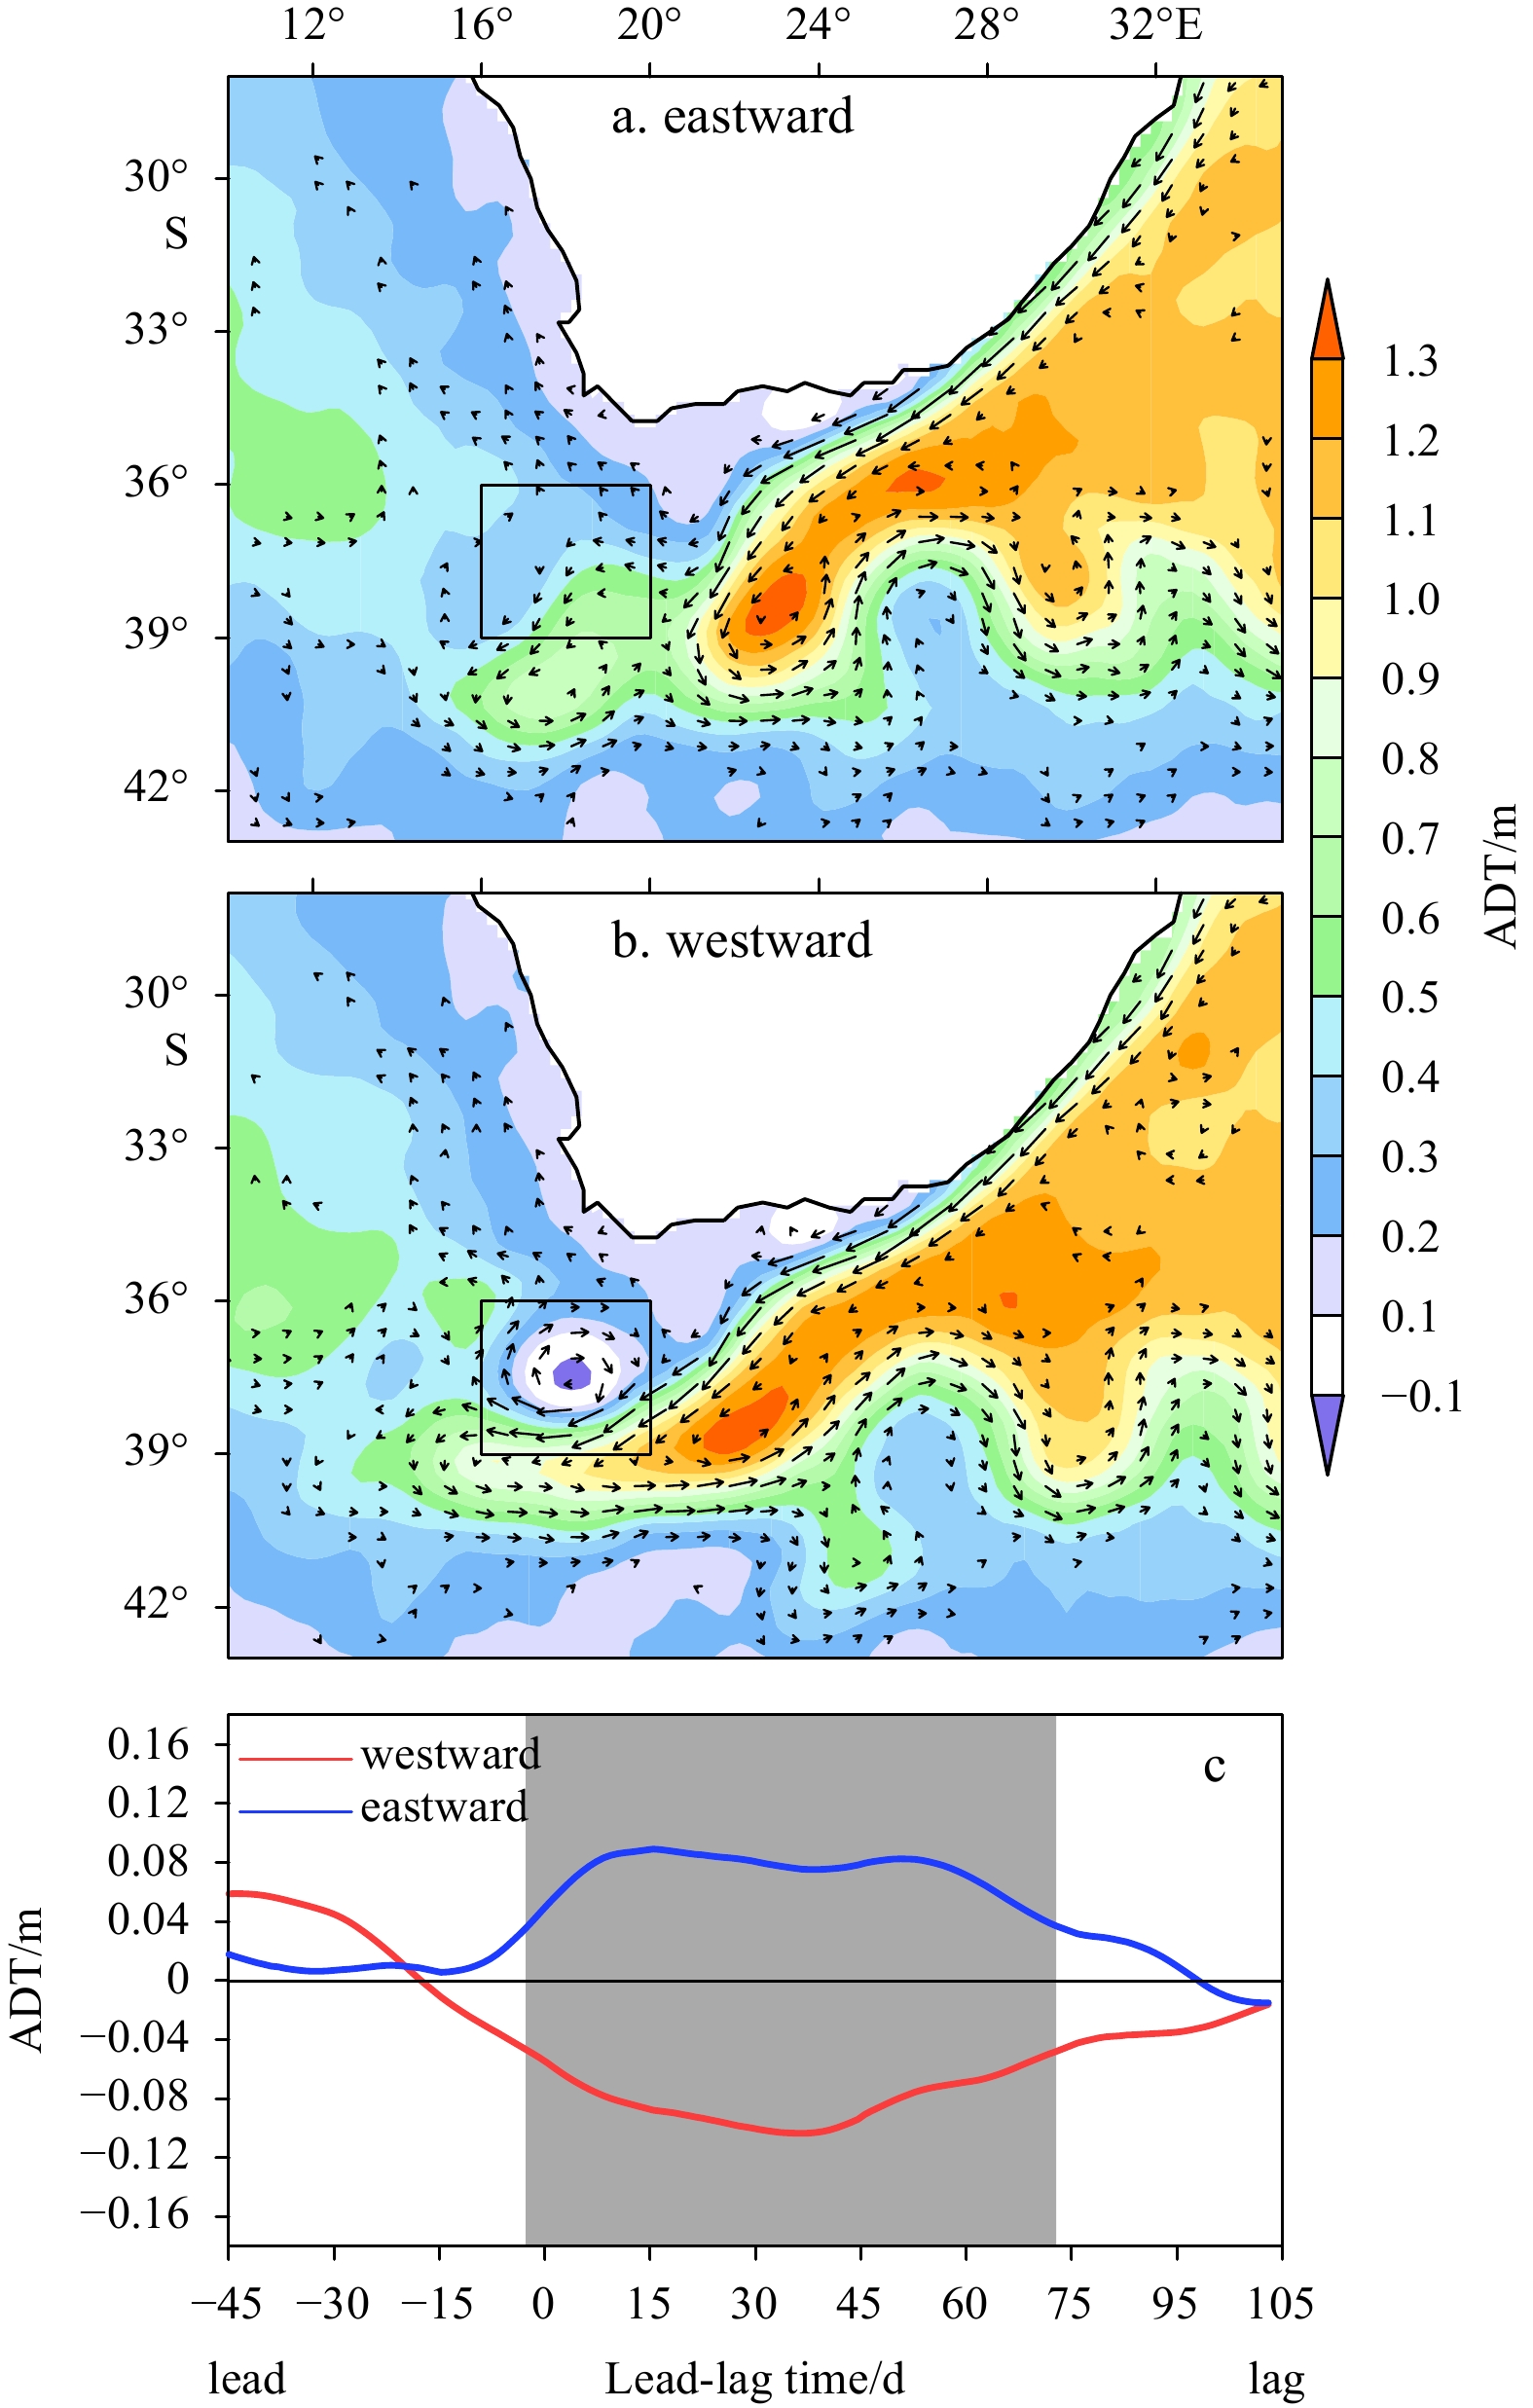
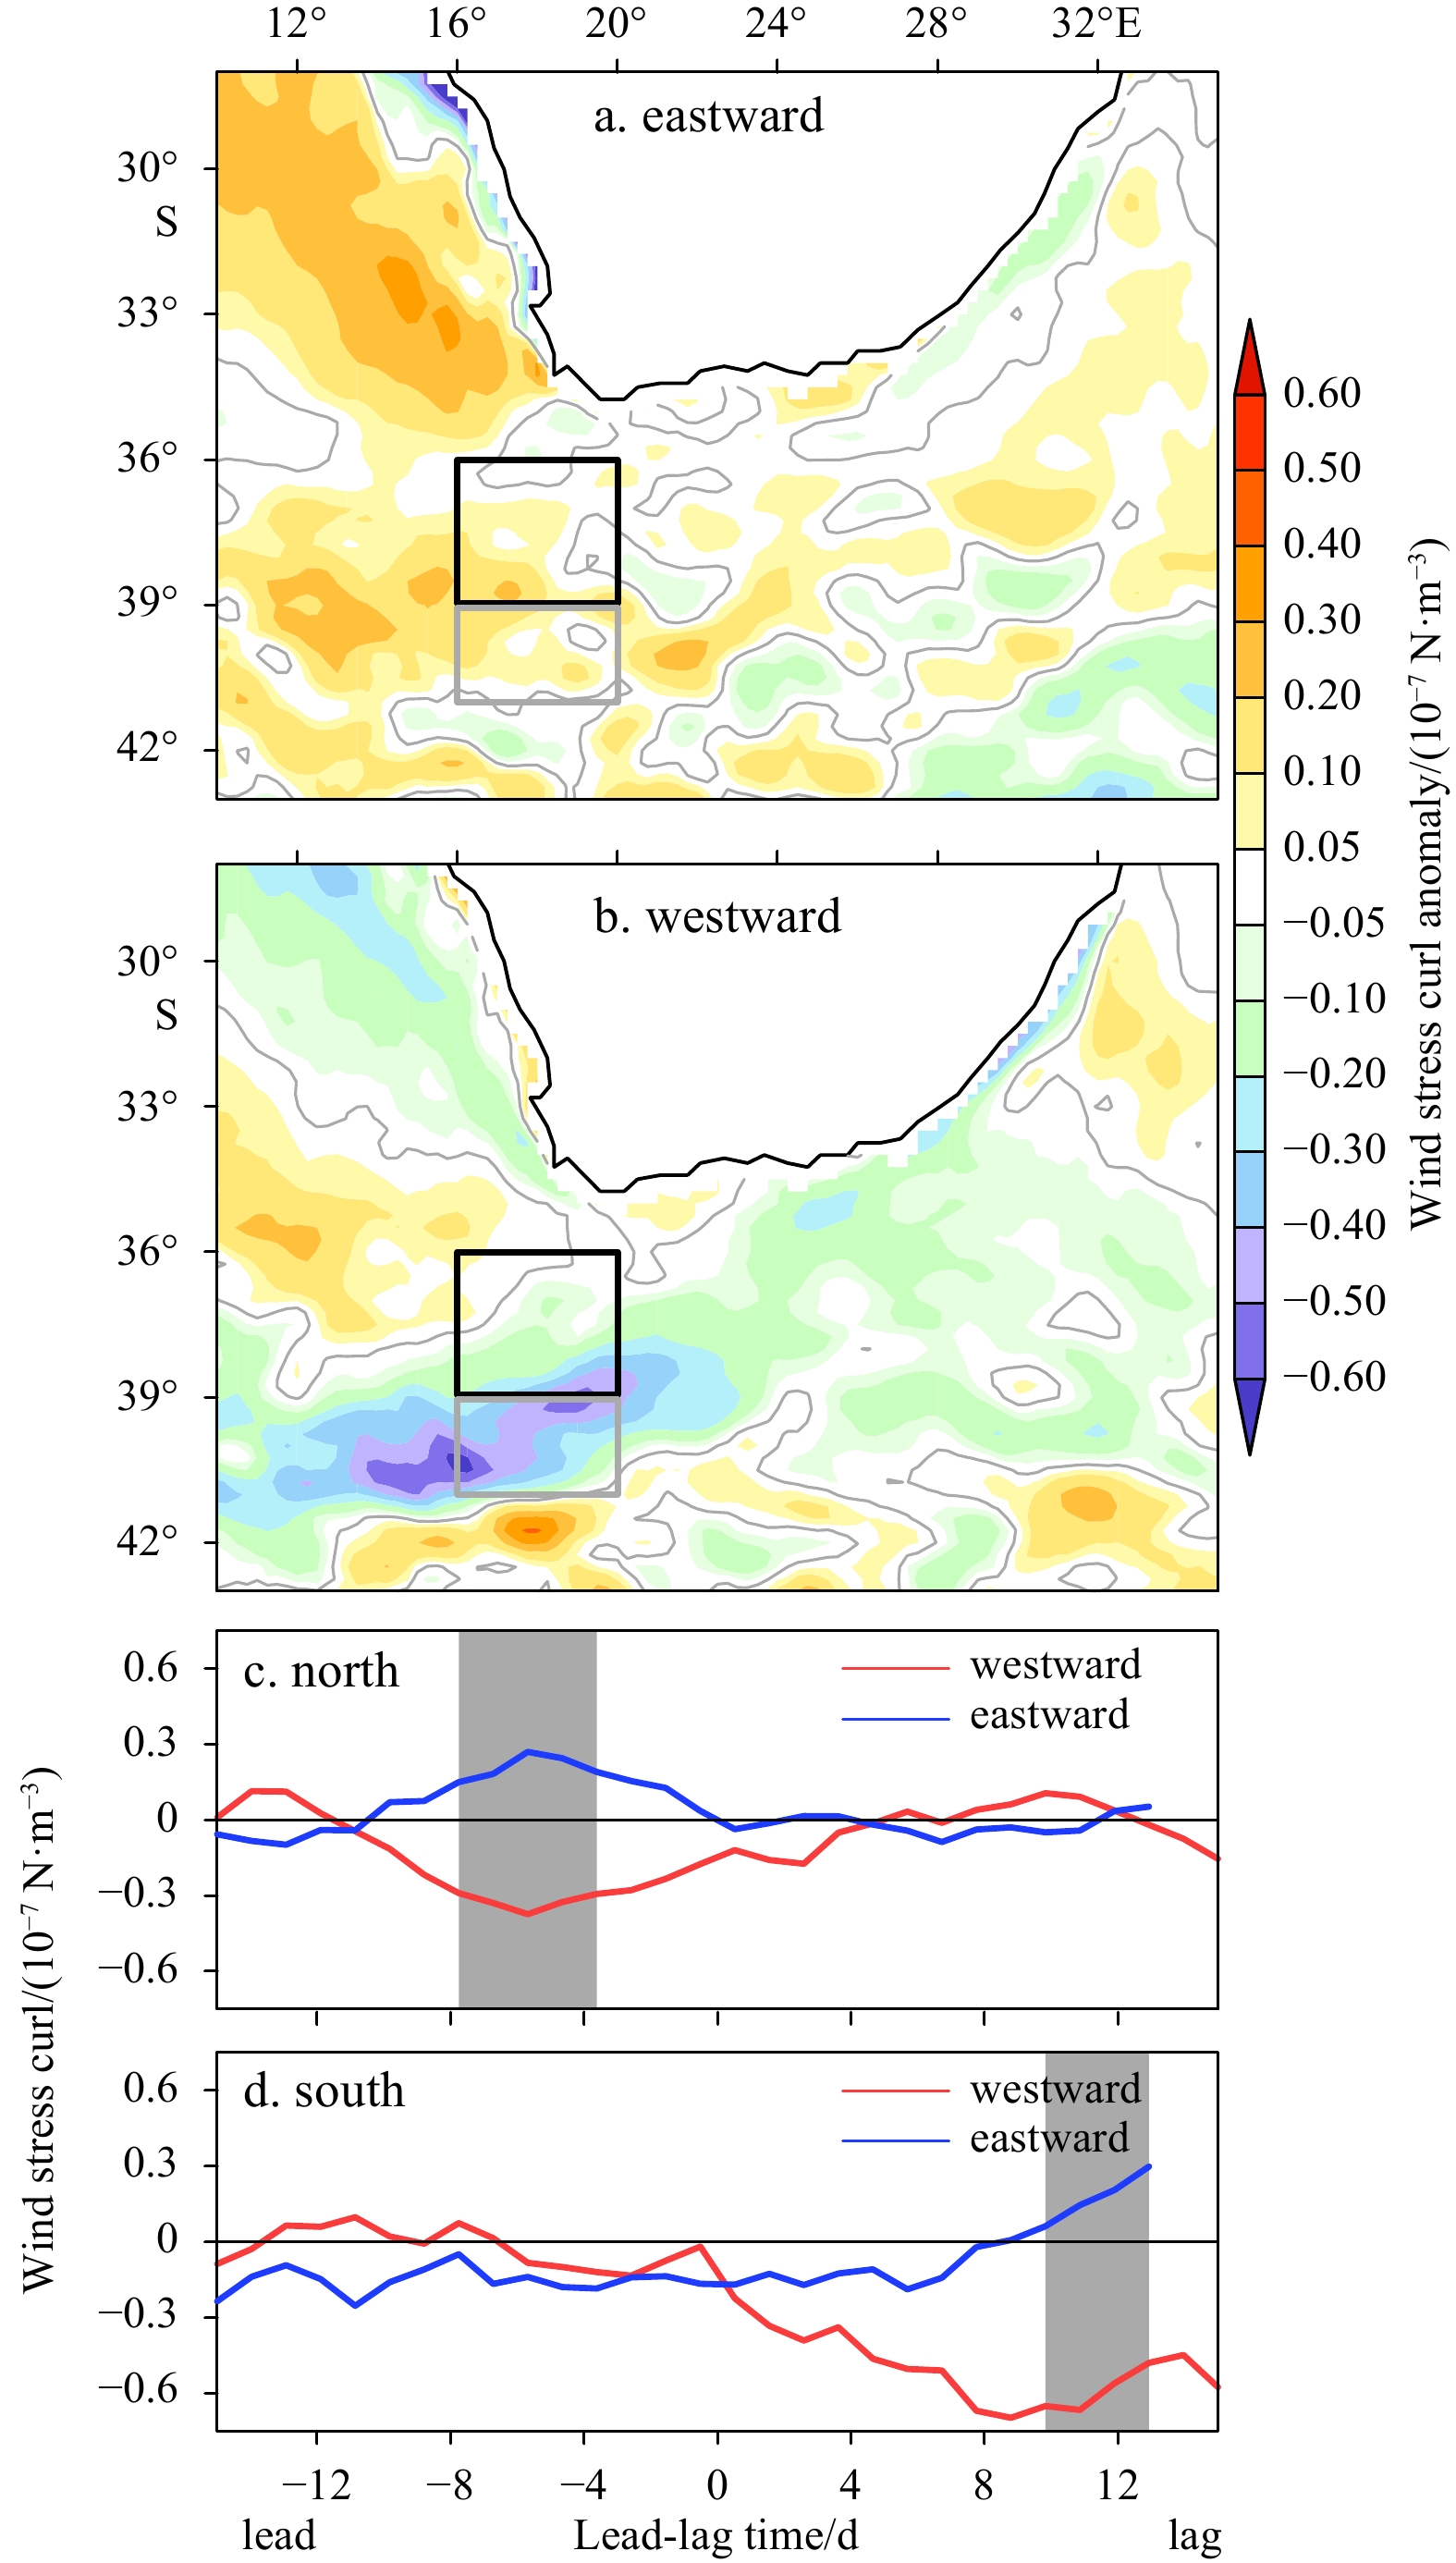
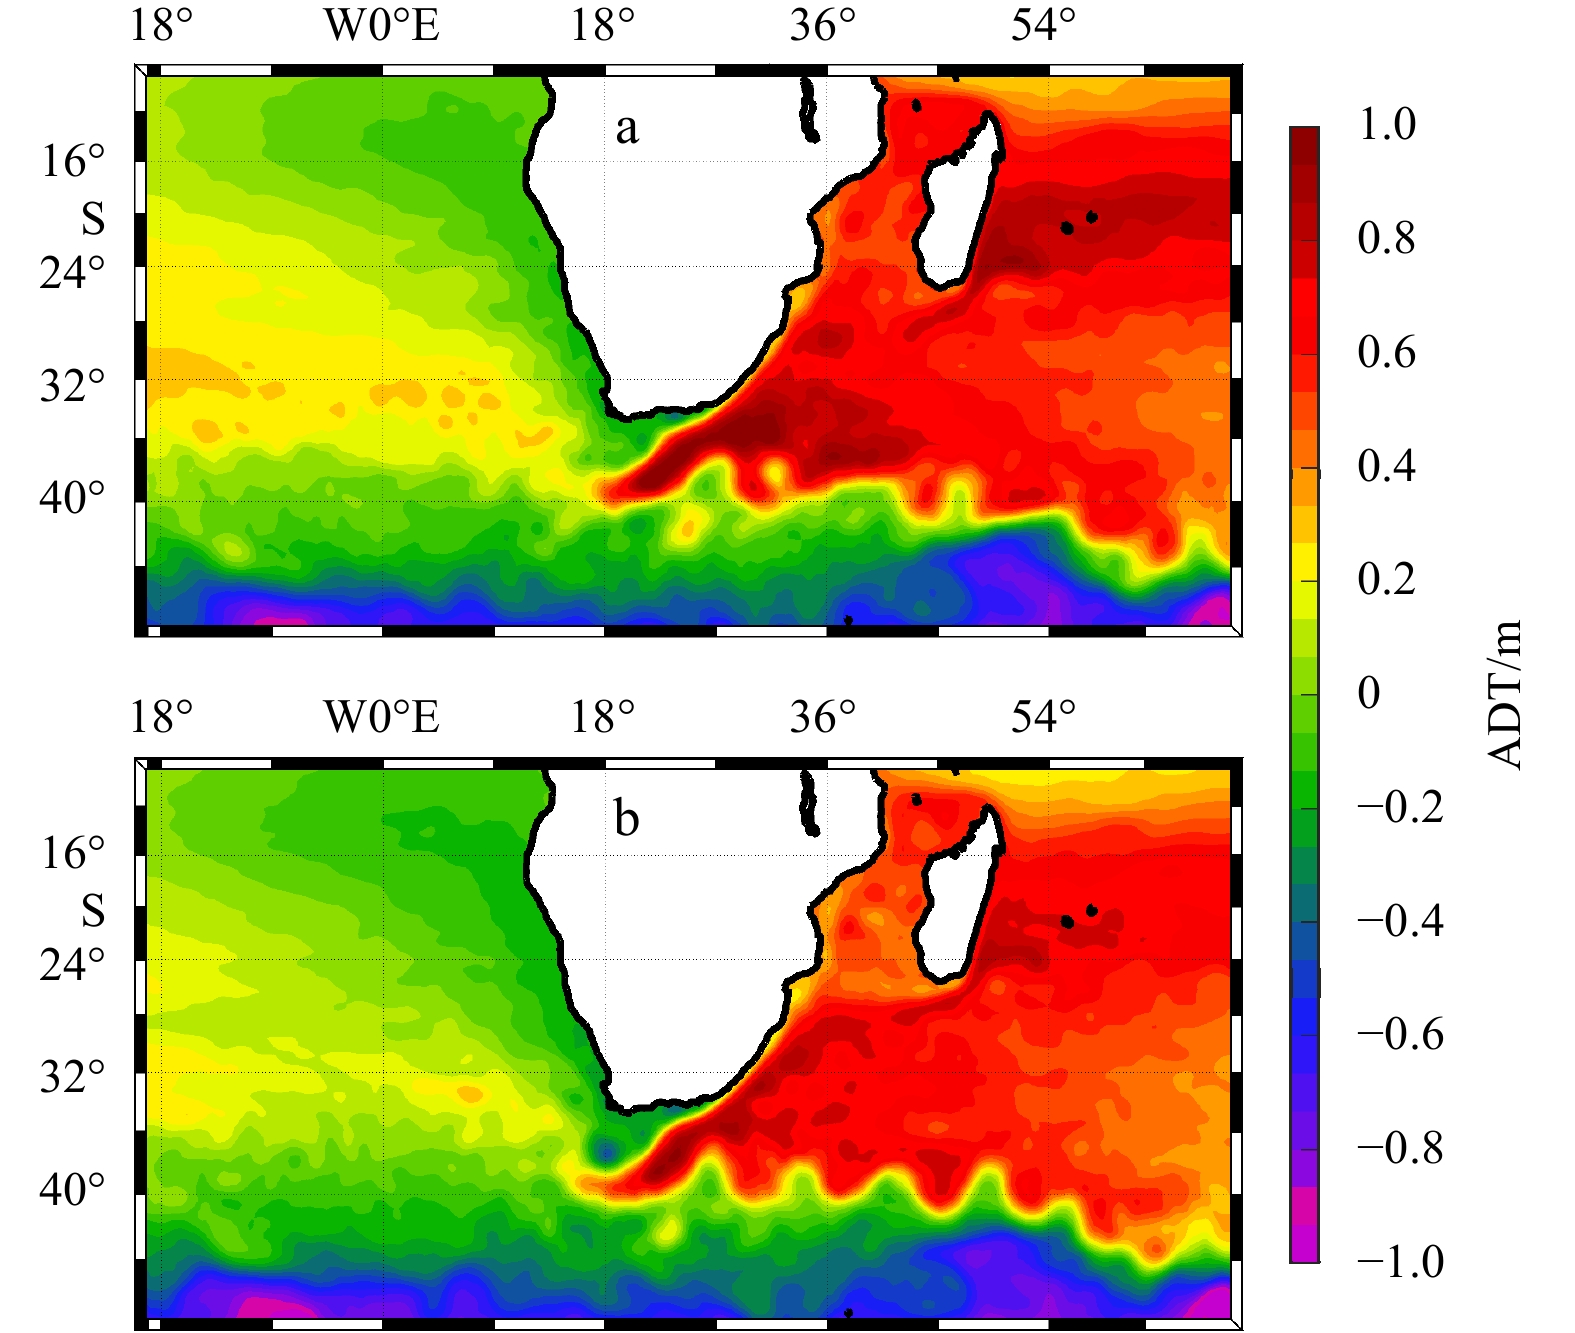
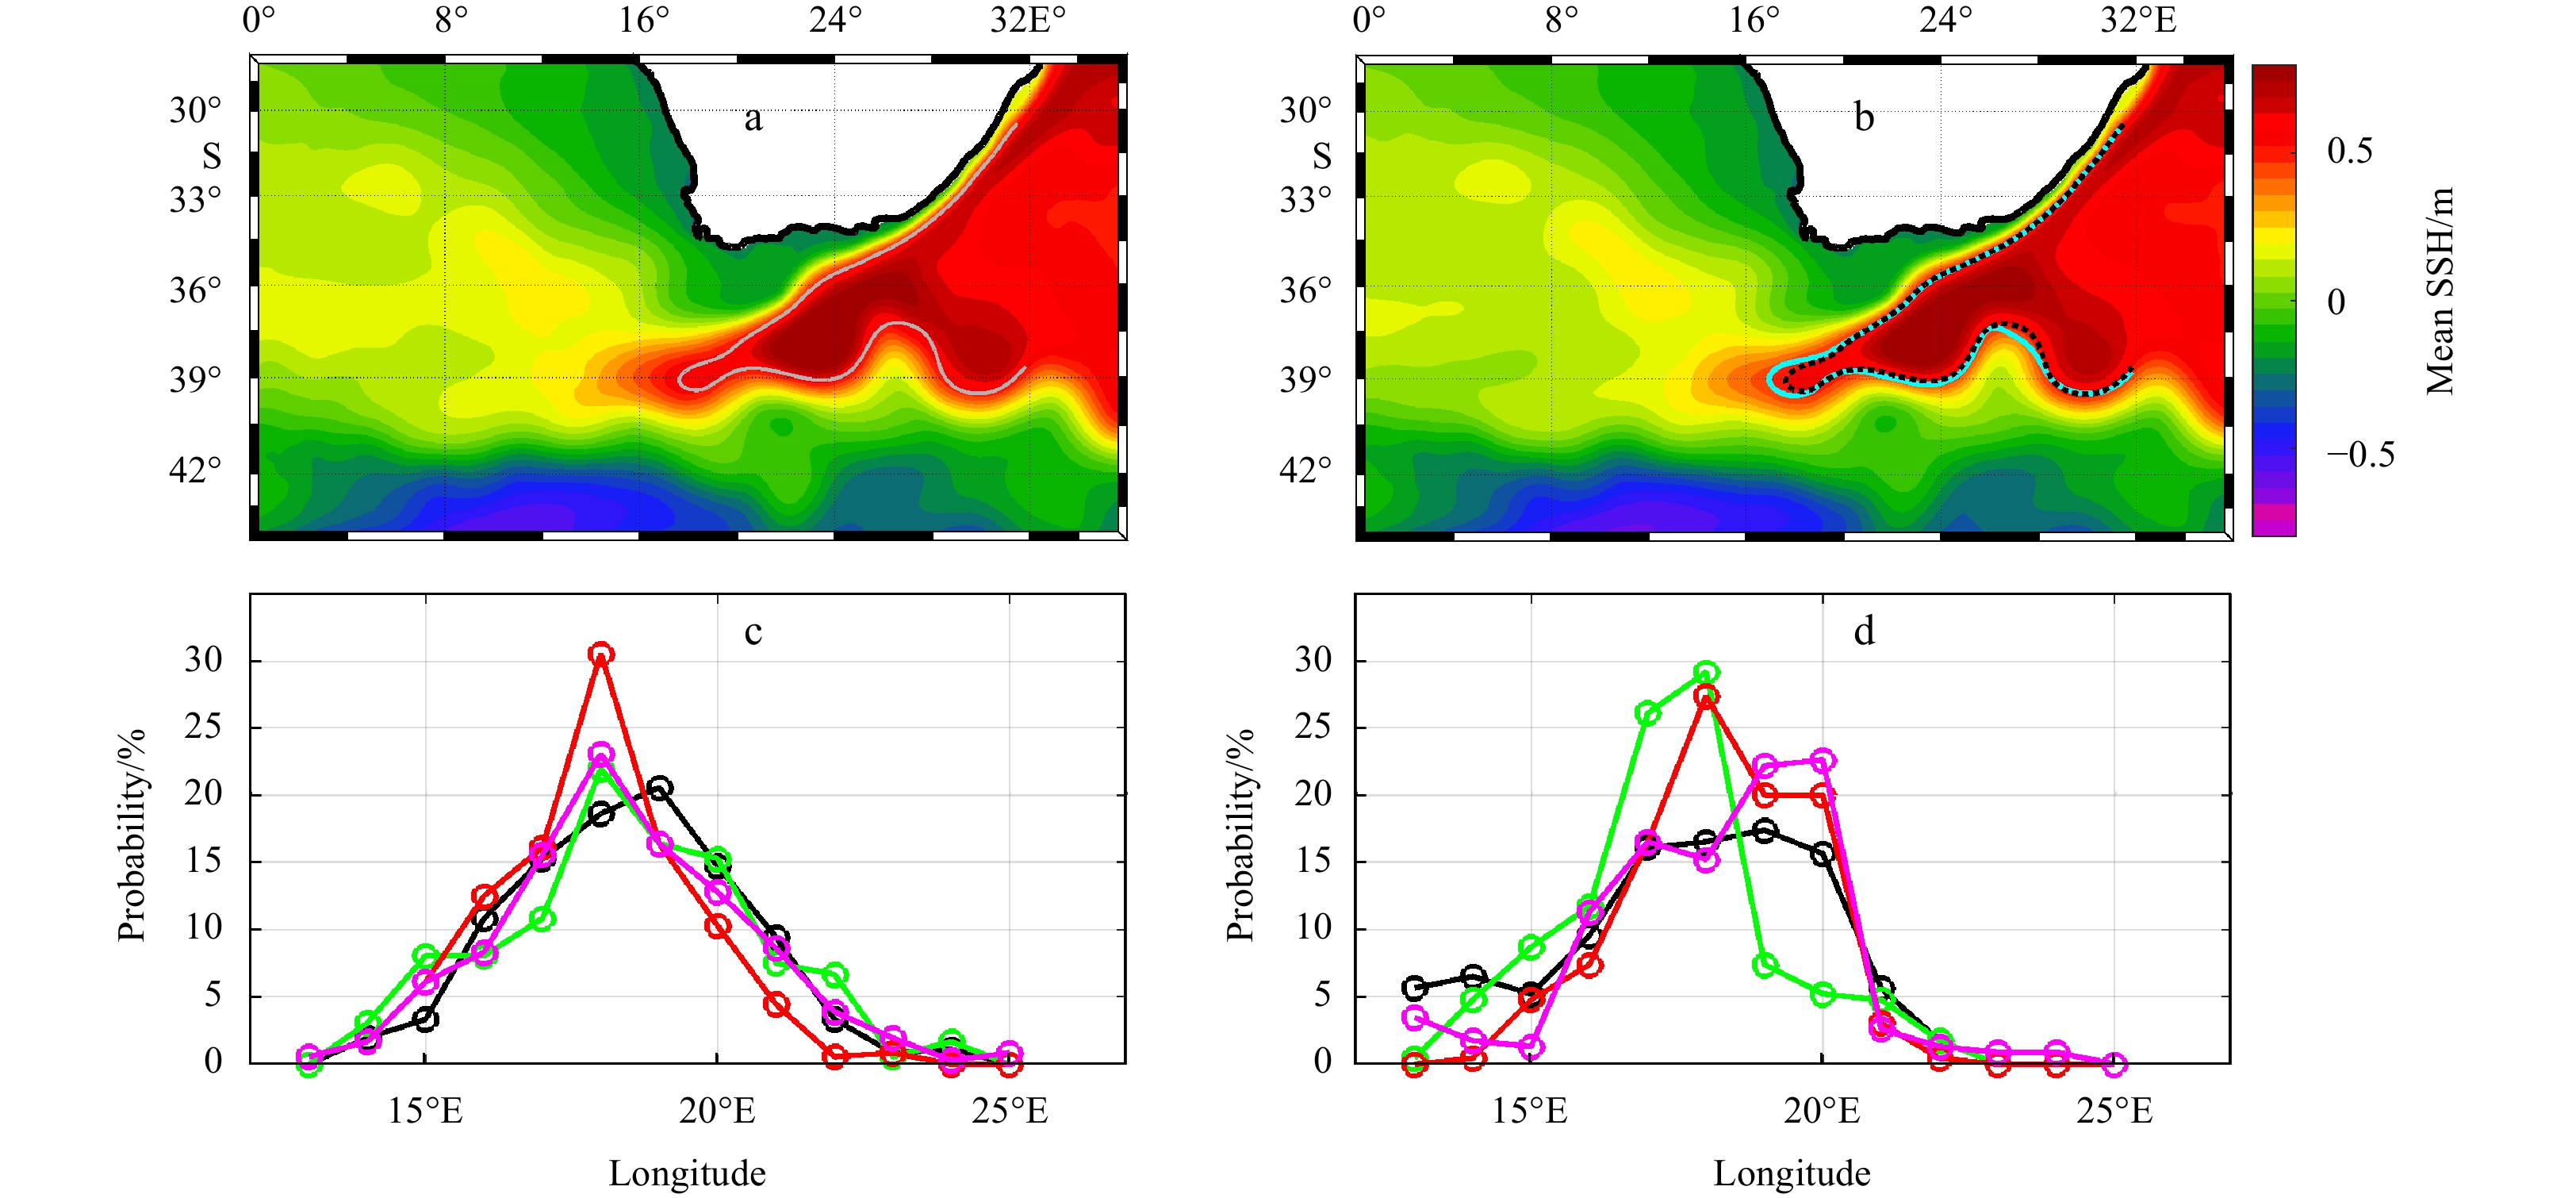
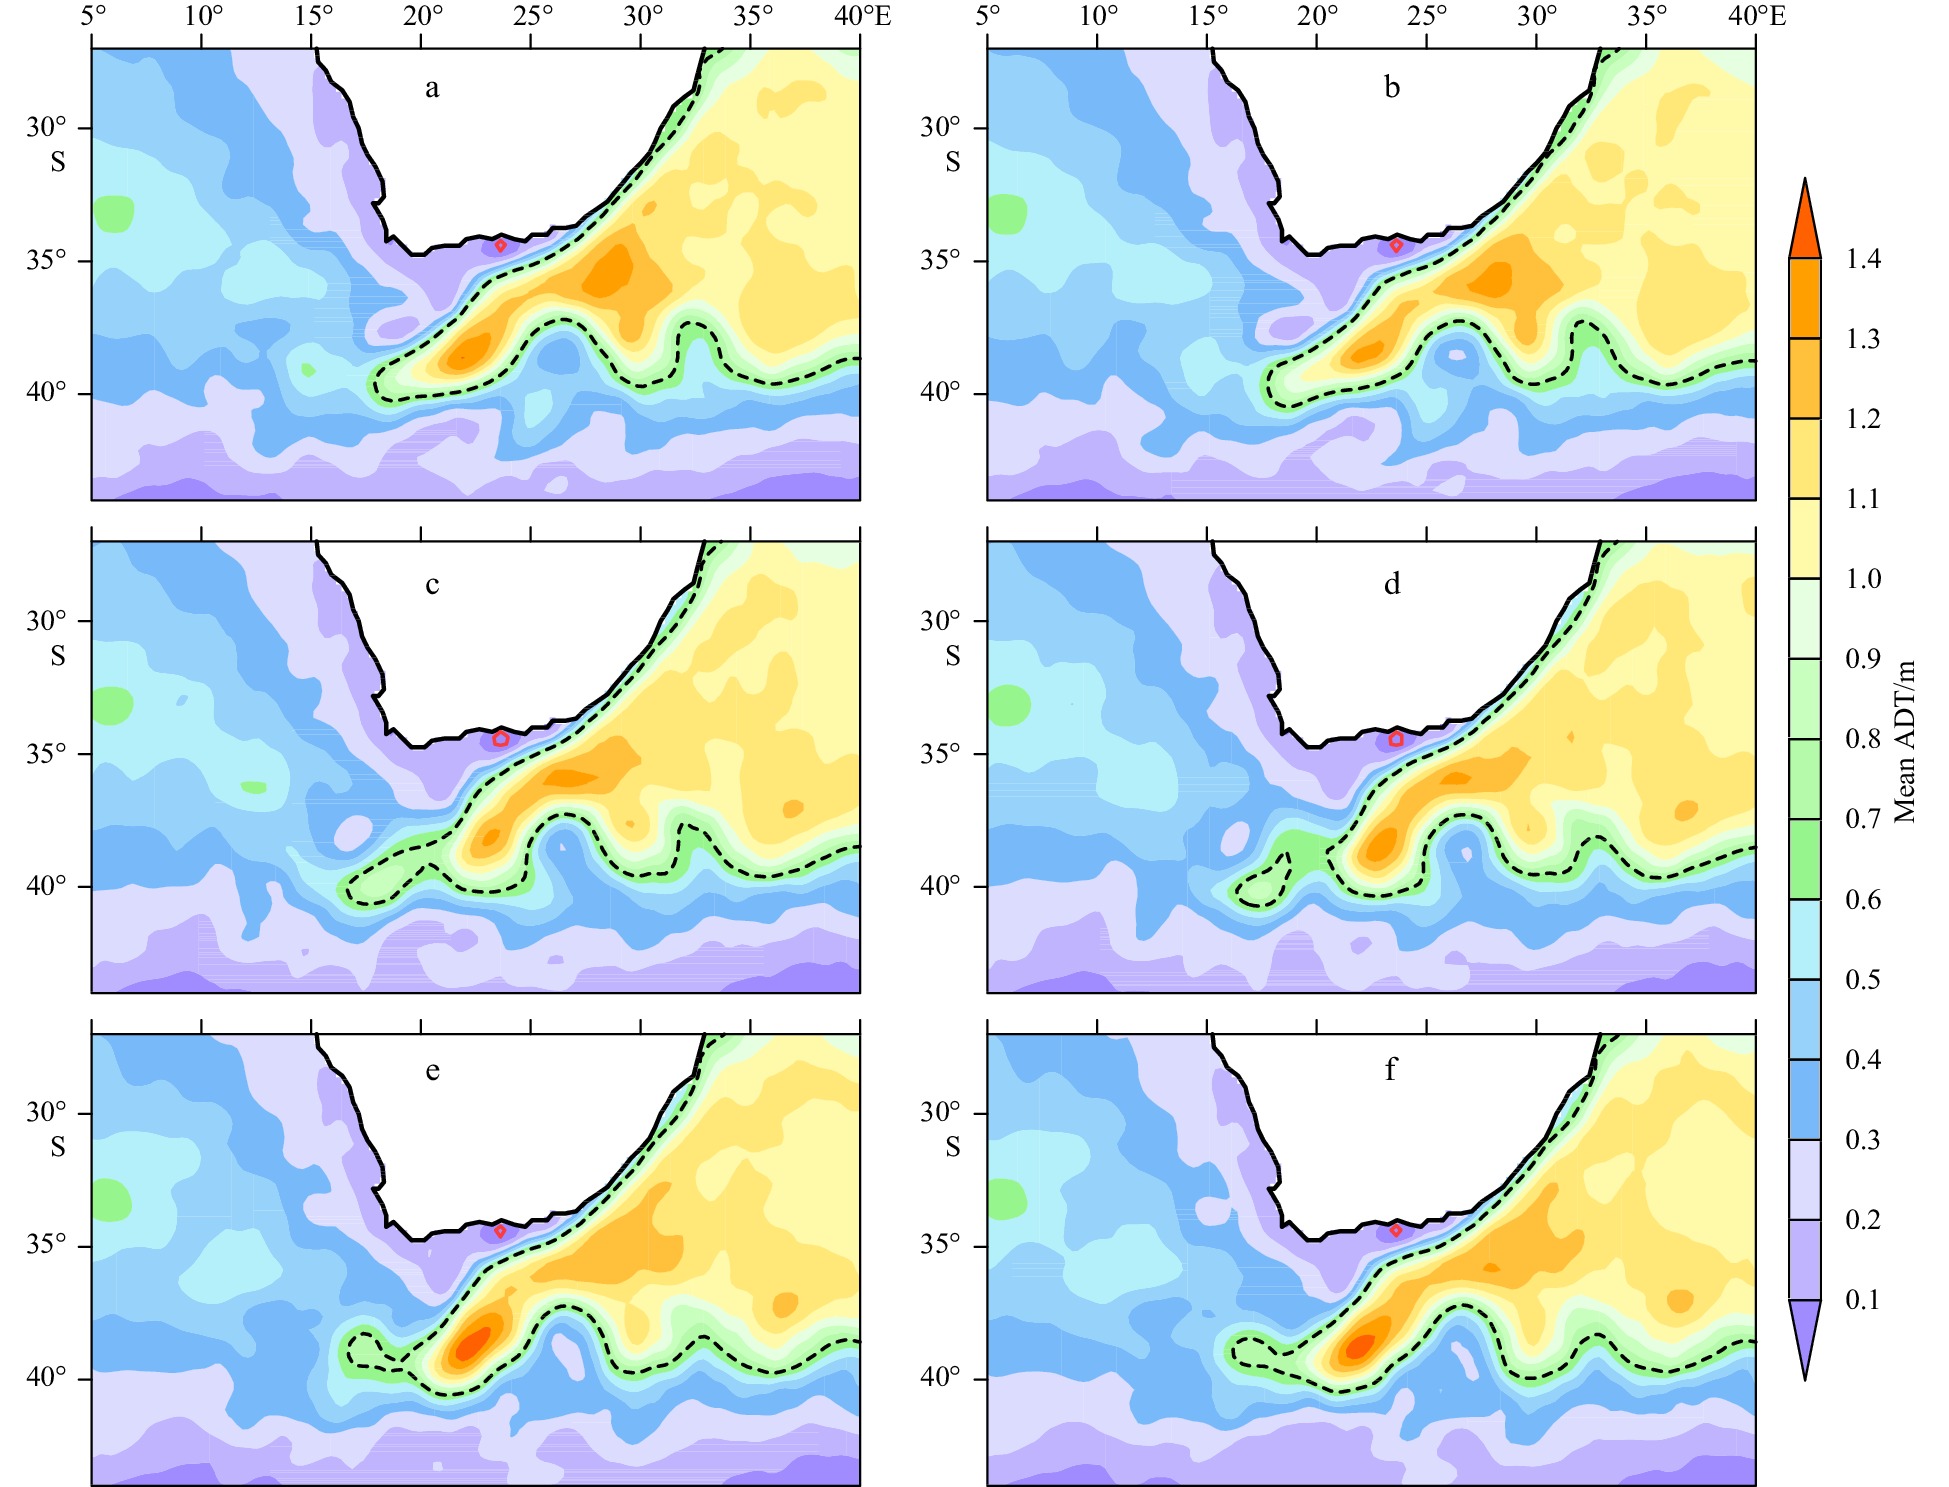
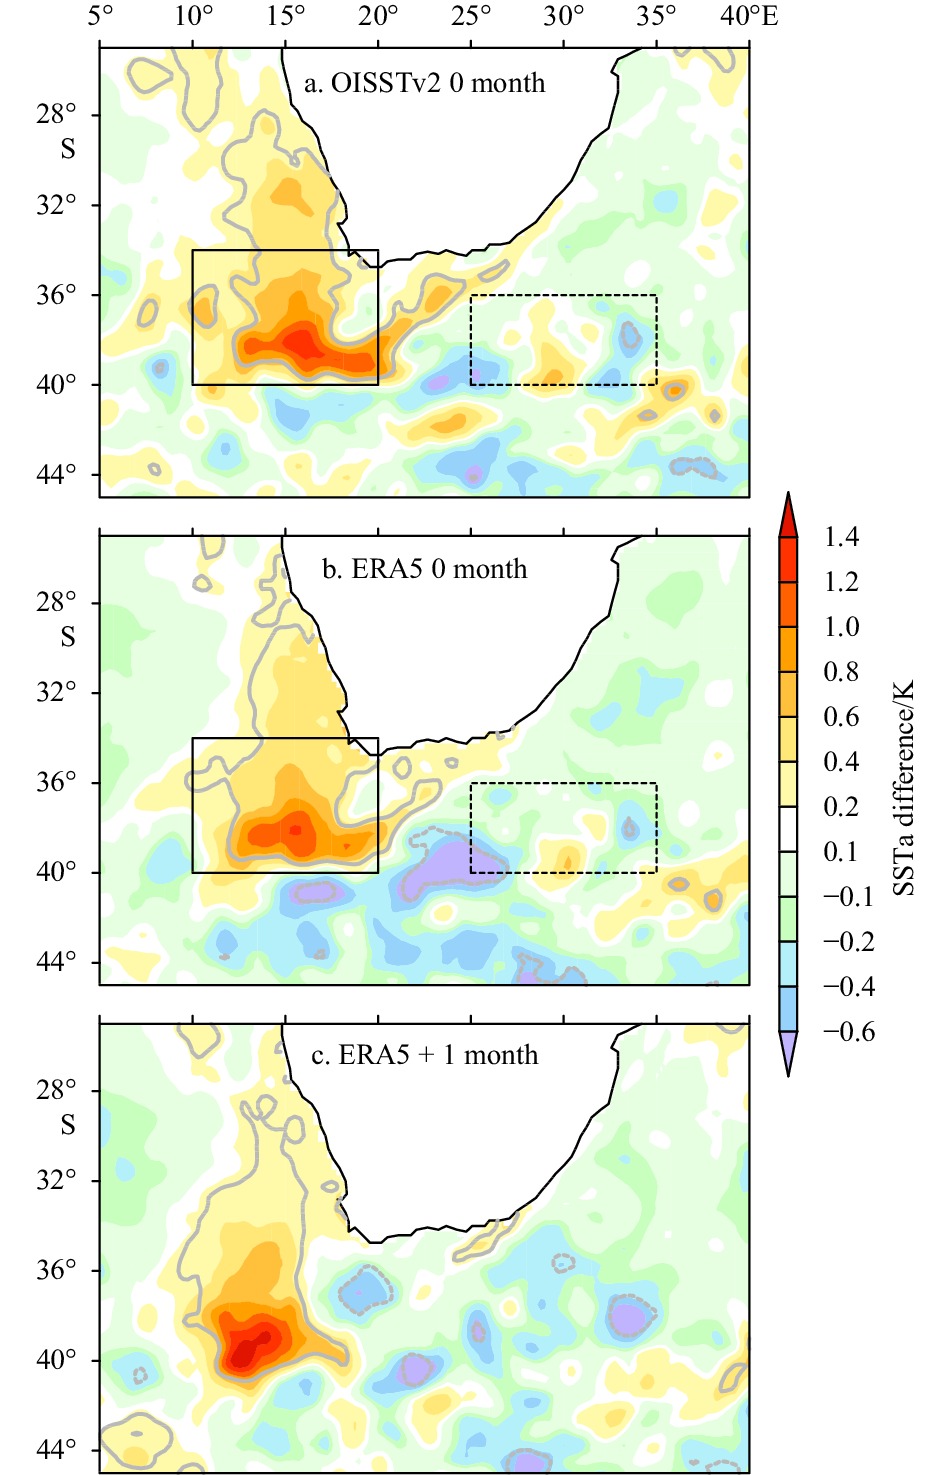
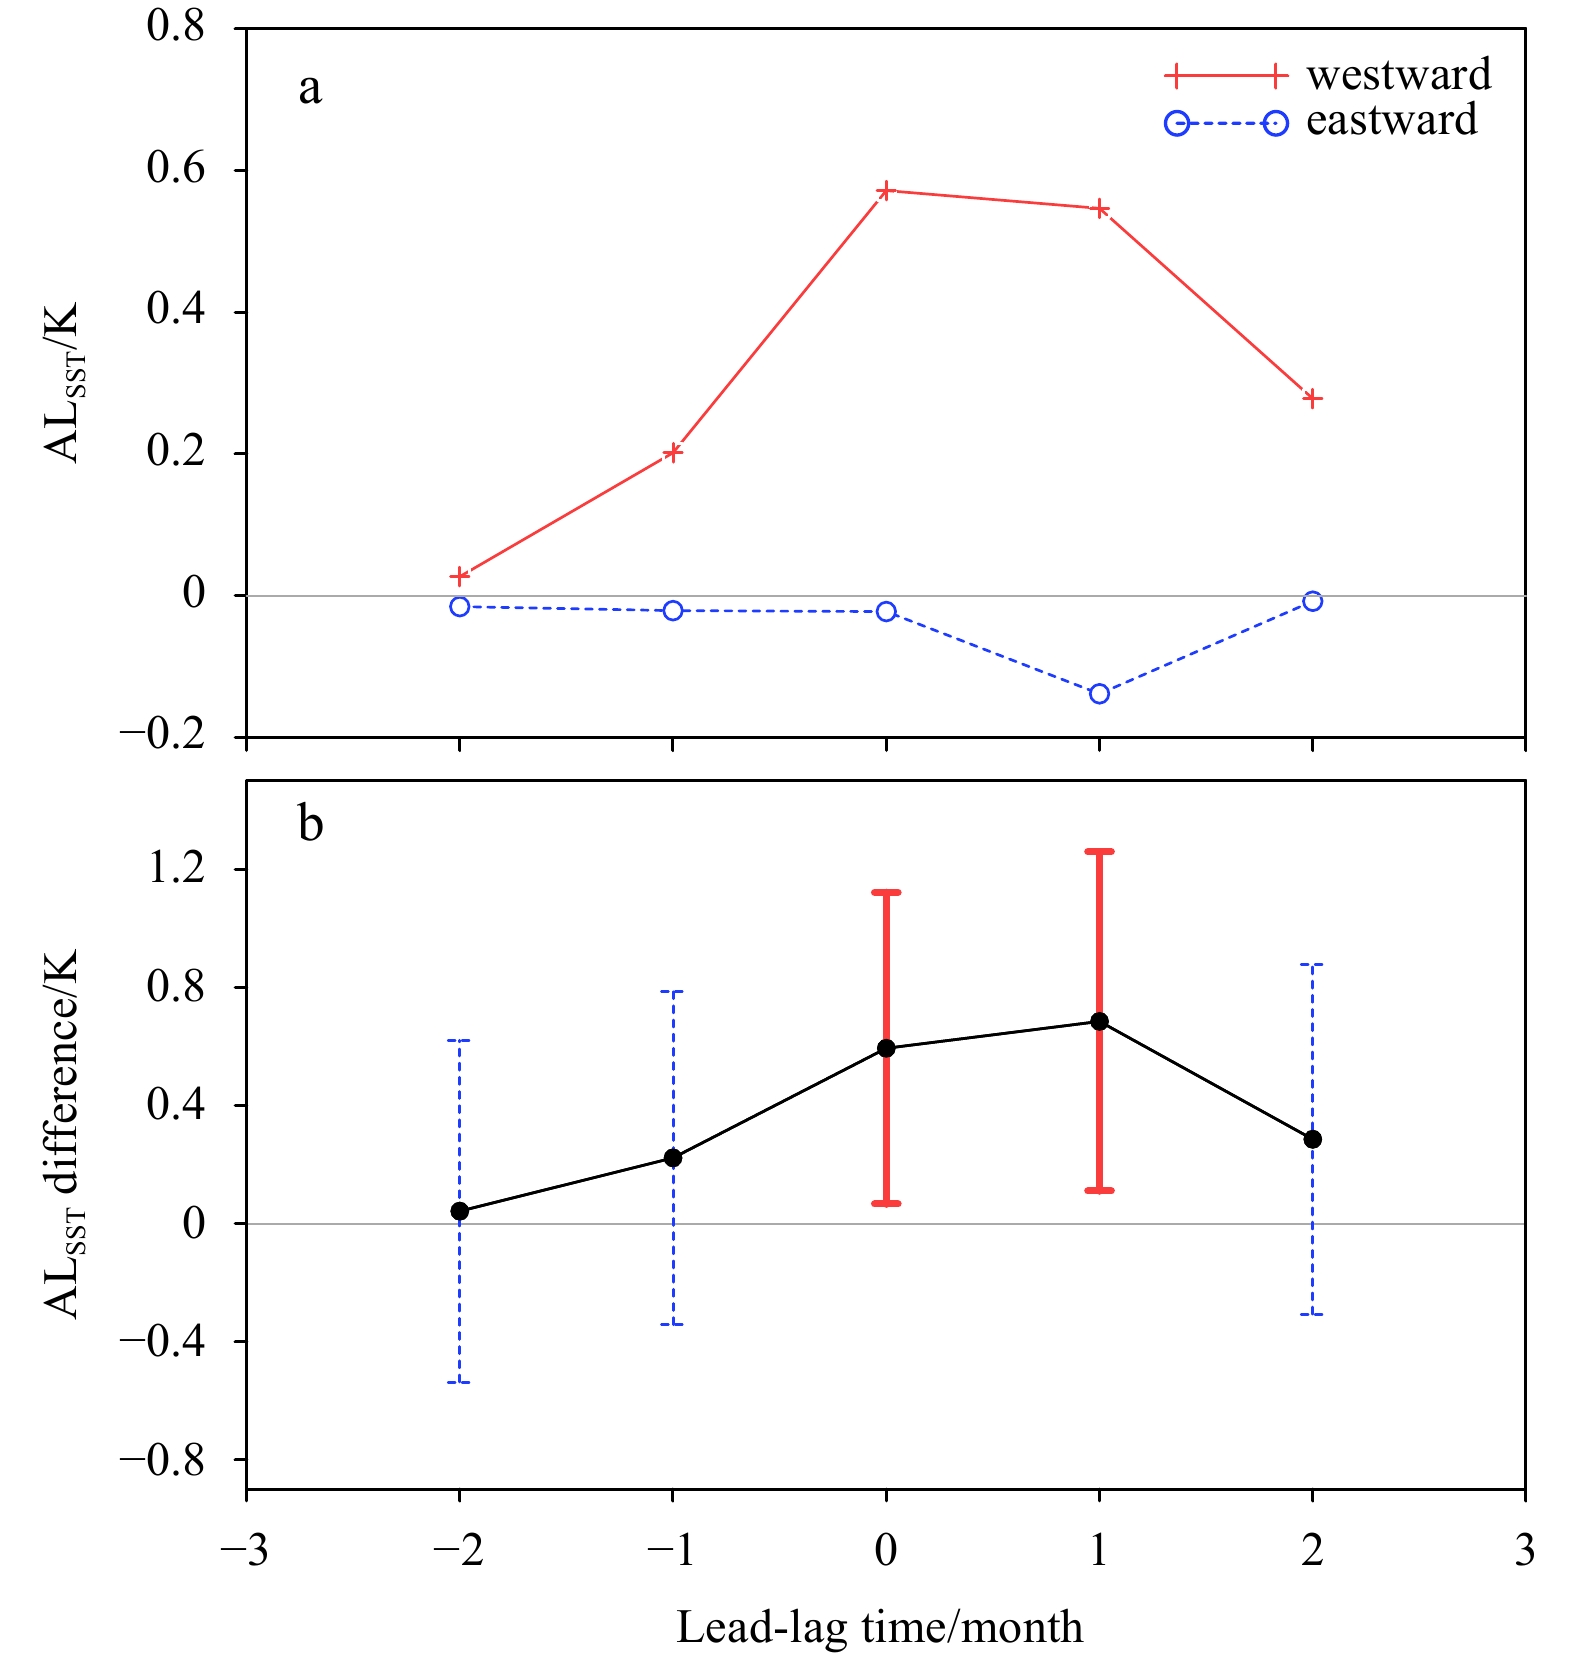
The Agulhas system is the strongest western boundary current system in the Southern Hemisphere and plays an important role in modulating the Indian-to-Atlantic Ocean water exchange by the Agulhas leakage. It is difficult to measure in situ transport of the Agulhas leakage as well as the Agulhas retroflection position due to their intermittent nature. In this study, an innovative kinematic algorithm was designed and applied to the gridded altimeter observational data, to ascertain the longitudinal position of Agulhas retroflection, the stability of Agulhas jet stream, as well as its strength. The results show that the east-west shift of retroflection is related neither to the strength of Agulhas current nor to its stability. Further analysis uncovers the connection between the westward extension of Agulhas jet stream and an anomalous cyclonic circulation at its northern side, which is likely attributed to the local wind stress curl anomaly. To confirm the effect of local wind forcing on the east-west shift of retroflection, numerical sensitivity experiments were conducted. The results show that the local wind stress can induce a similar longitudinal shift of the retroflection as altimetry observations. Further statistical and case study indicates that whether an Agulhas ring can continuously migrate westward to the Atlantic Ocean or re-merge into the main flow depends on the retroflection position. Therefore, the westward retroflection may contribute to a stronger Agulhas leakage than the eastward retroflection.
The Agulhas system is the strongest western boundary current system in the Southern Hemisphere and plays an important role in modulating the Indian-to-Atlantic Ocean water exchange by the Agulhas leakage. It is difficult to measure in situ transport of the Agulhas leakage as well as the Agulhas retroflection position due to their intermittent nature. In this study, an innovative kinematic algorithm was designed and applied to the gridded altimeter observational data, to ascertain the longitudinal position of Agulhas retroflection, the stability of Agulhas jet stream, as well as its strength. The results show that the east-west shift of retroflection is related neither to the strength of Agulhas current nor to its stability. Further analysis uncovers the connection between the westward extension of Agulhas jet stream and an anomalous cyclonic circulation at its northern side, which is likely attributed to the local wind stress curl anomaly. To confirm the effect of local wind forcing on the east-west shift of retroflection, numerical sensitivity experiments were conducted. The results show that the local wind stress can induce a similar longitudinal shift of the retroflection as altimetry observations. Further statistical and case study indicates that whether an Agulhas ring can continuously migrate westward to the Atlantic Ocean or re-merge into the main flow depends on the retroflection position. Therefore, the westward retroflection may contribute to a stronger Agulhas leakage than the eastward retroflection.


2024, 43(5): 30-40.
doi: 10.1007/s13131-024-2323-x
Abstract:
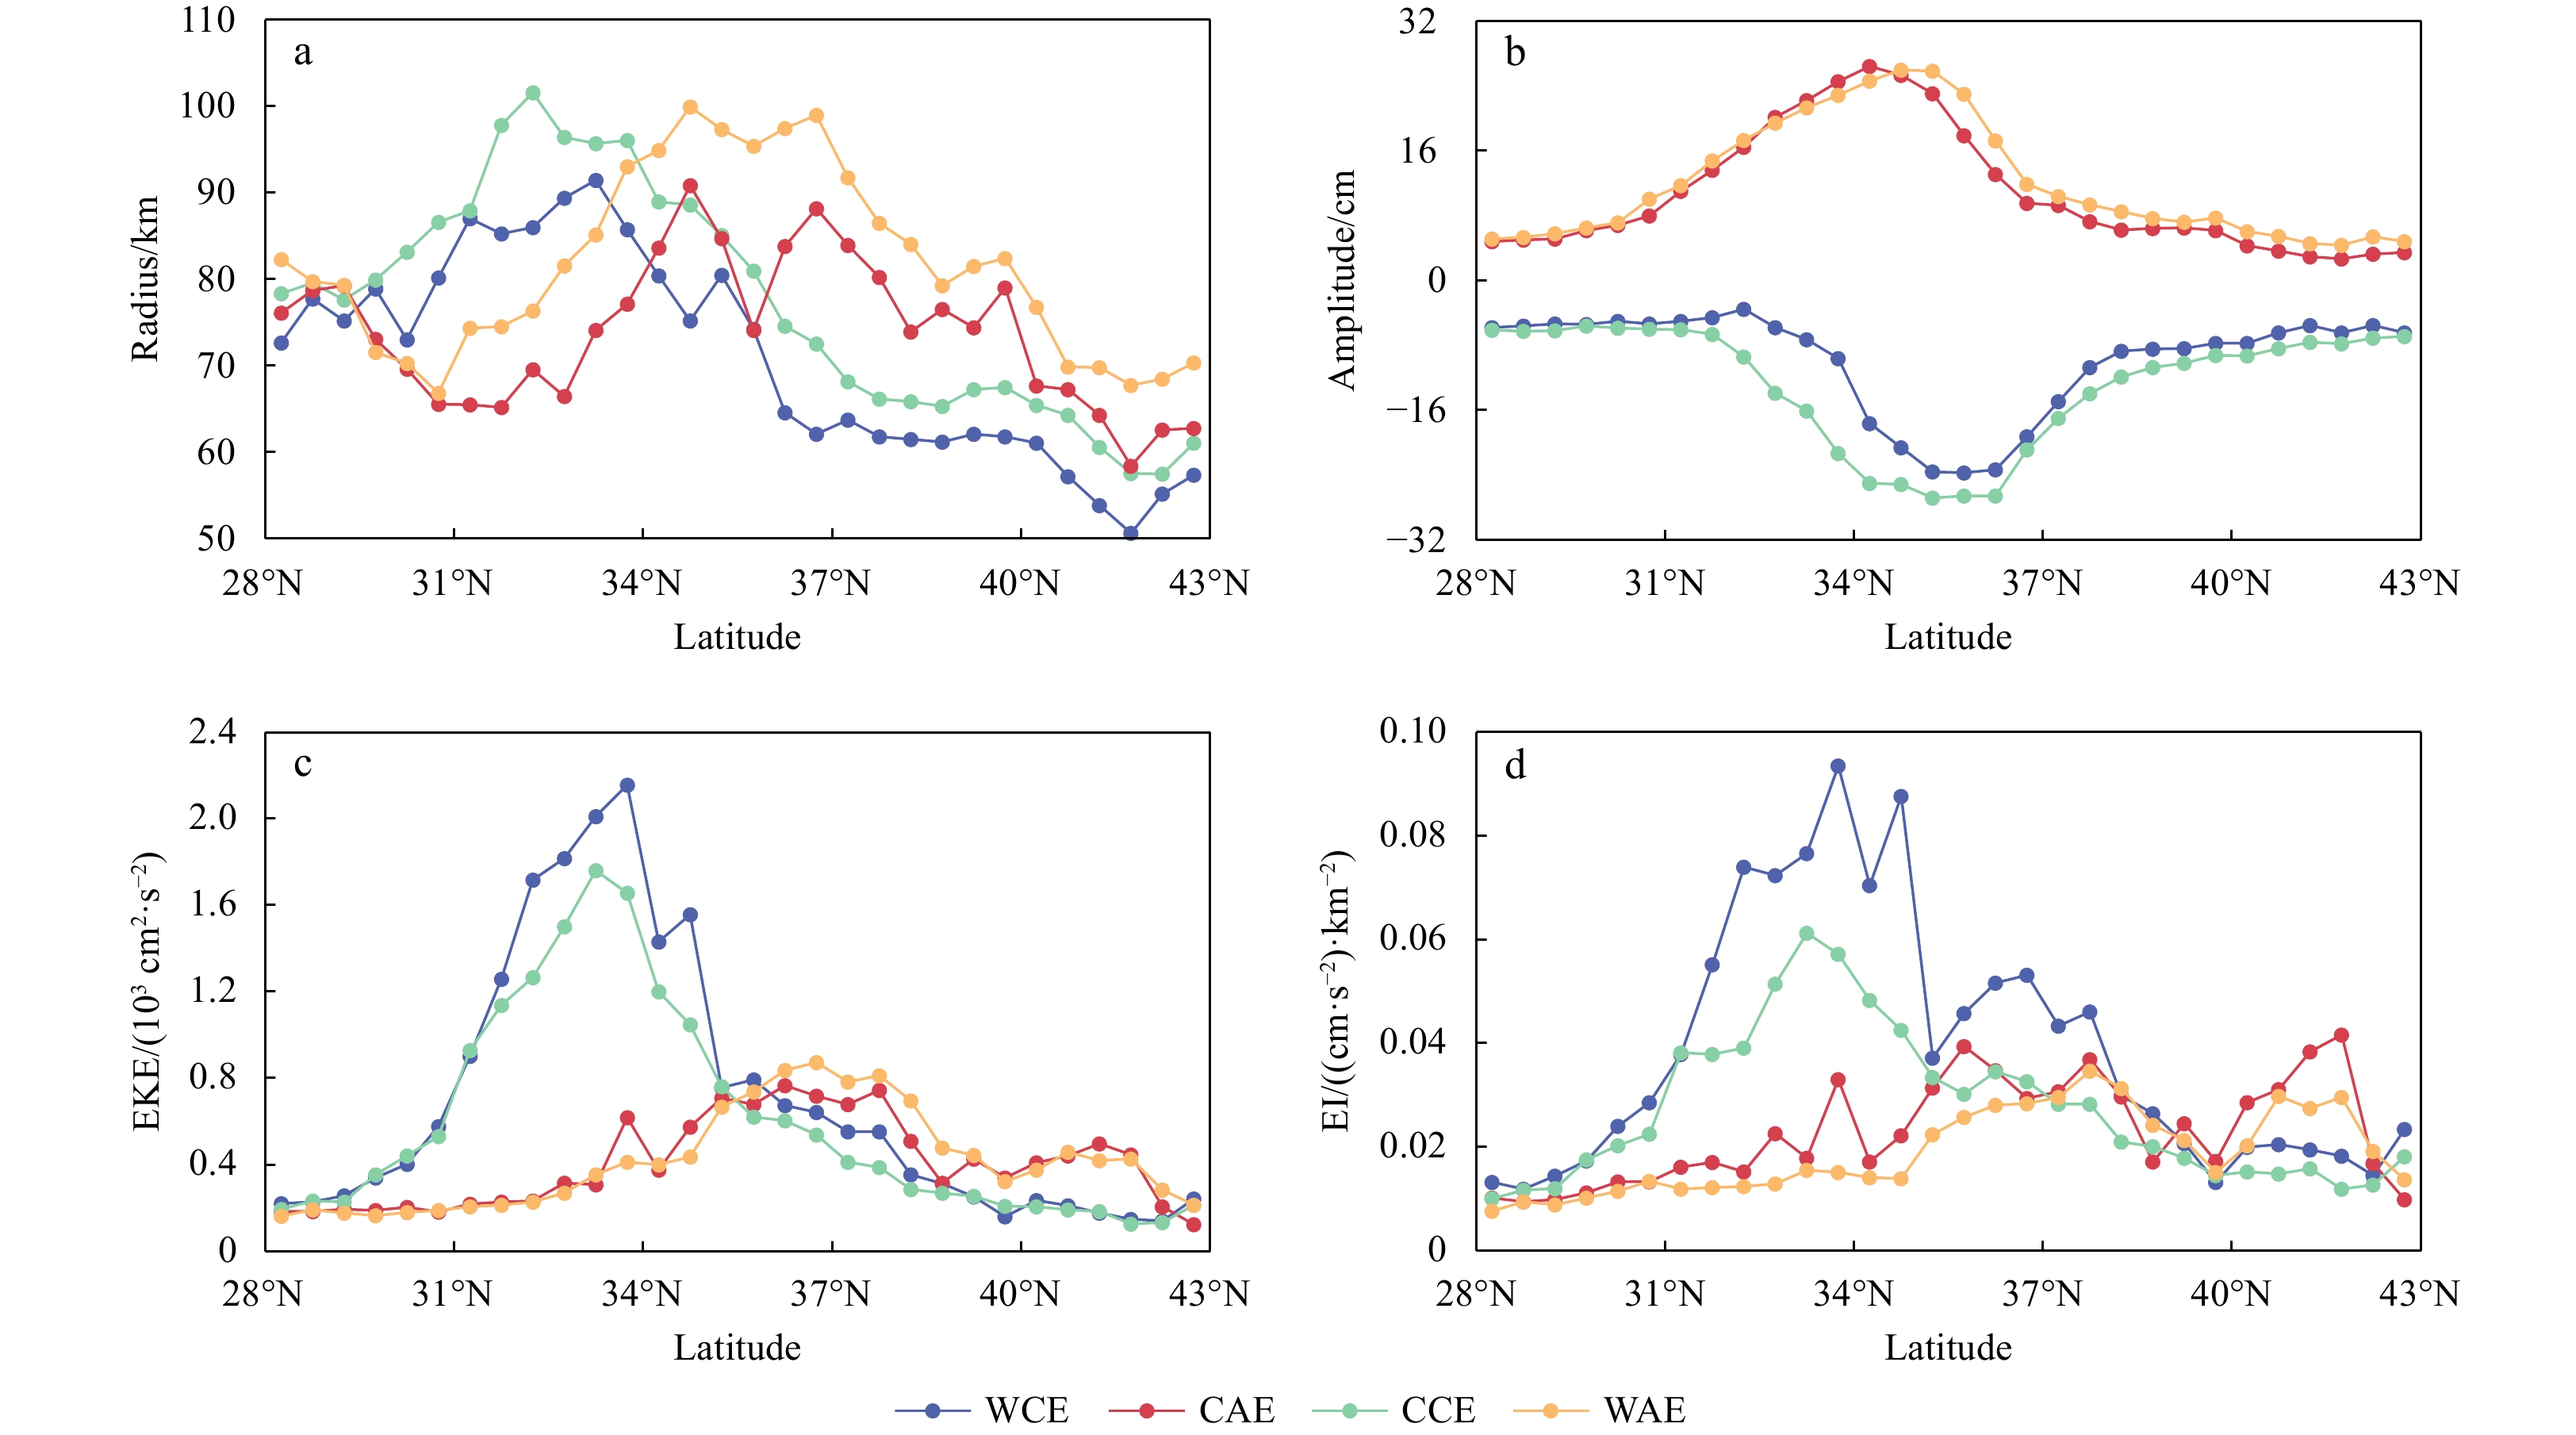
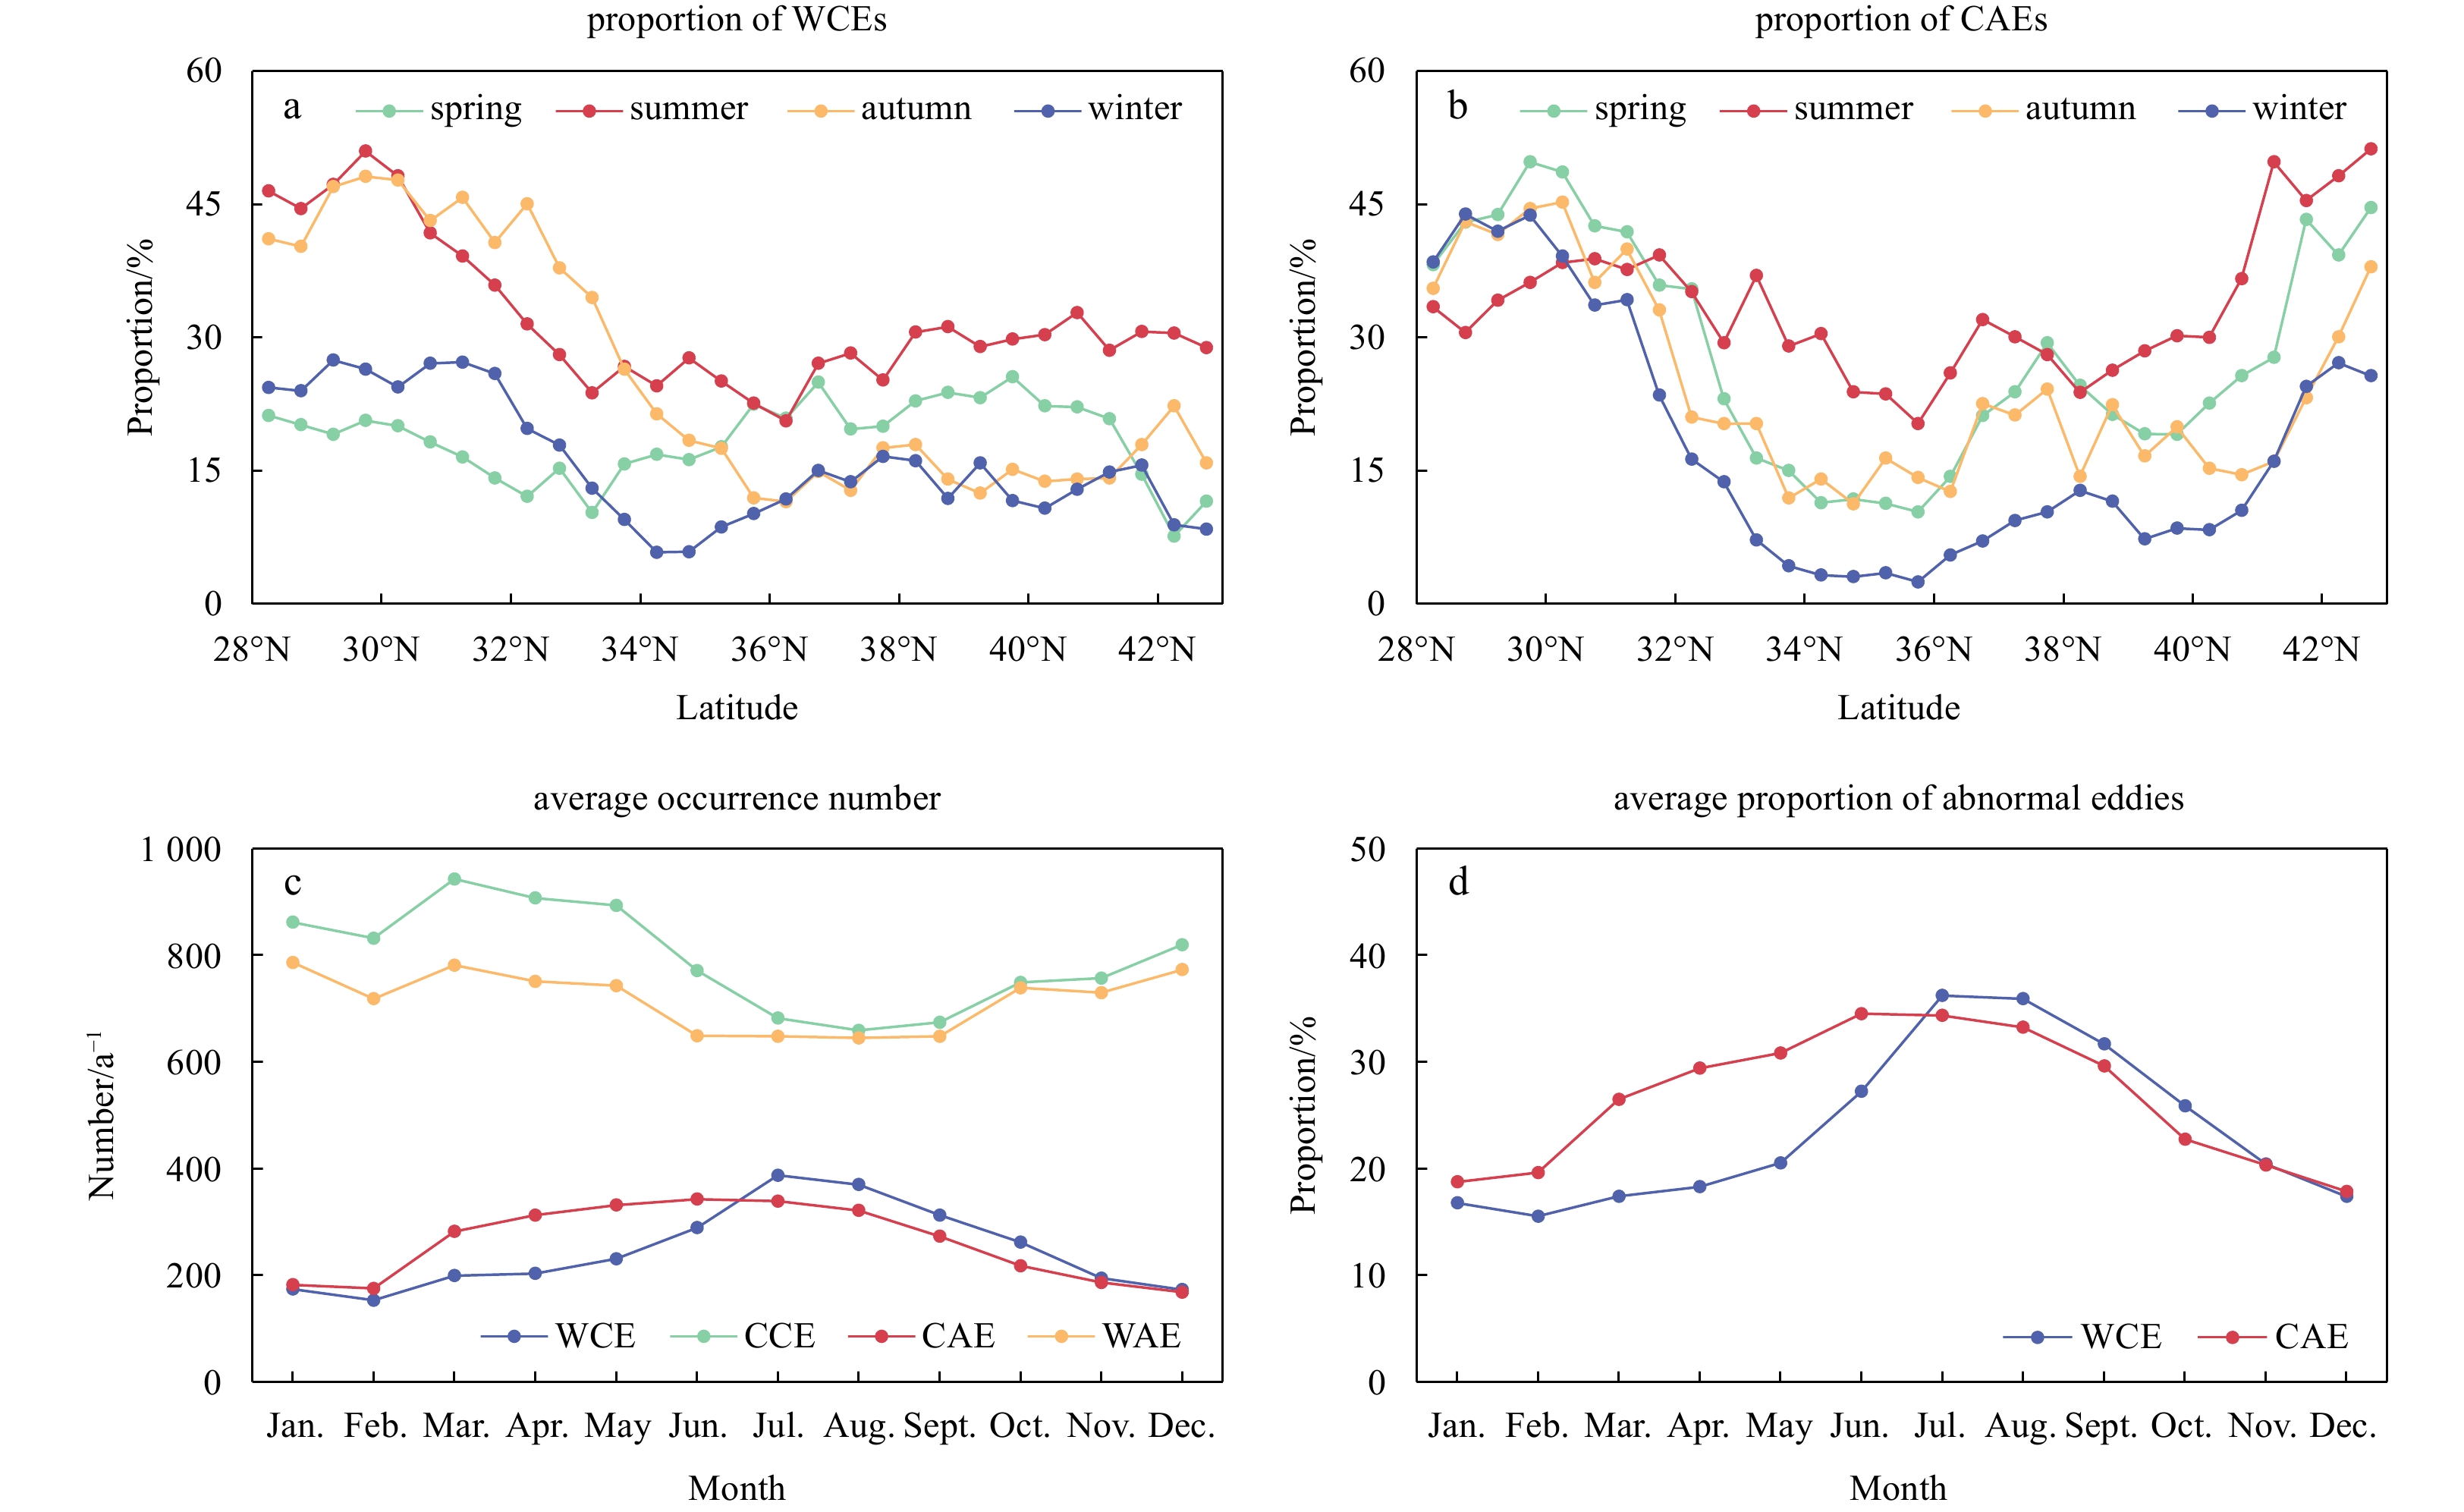
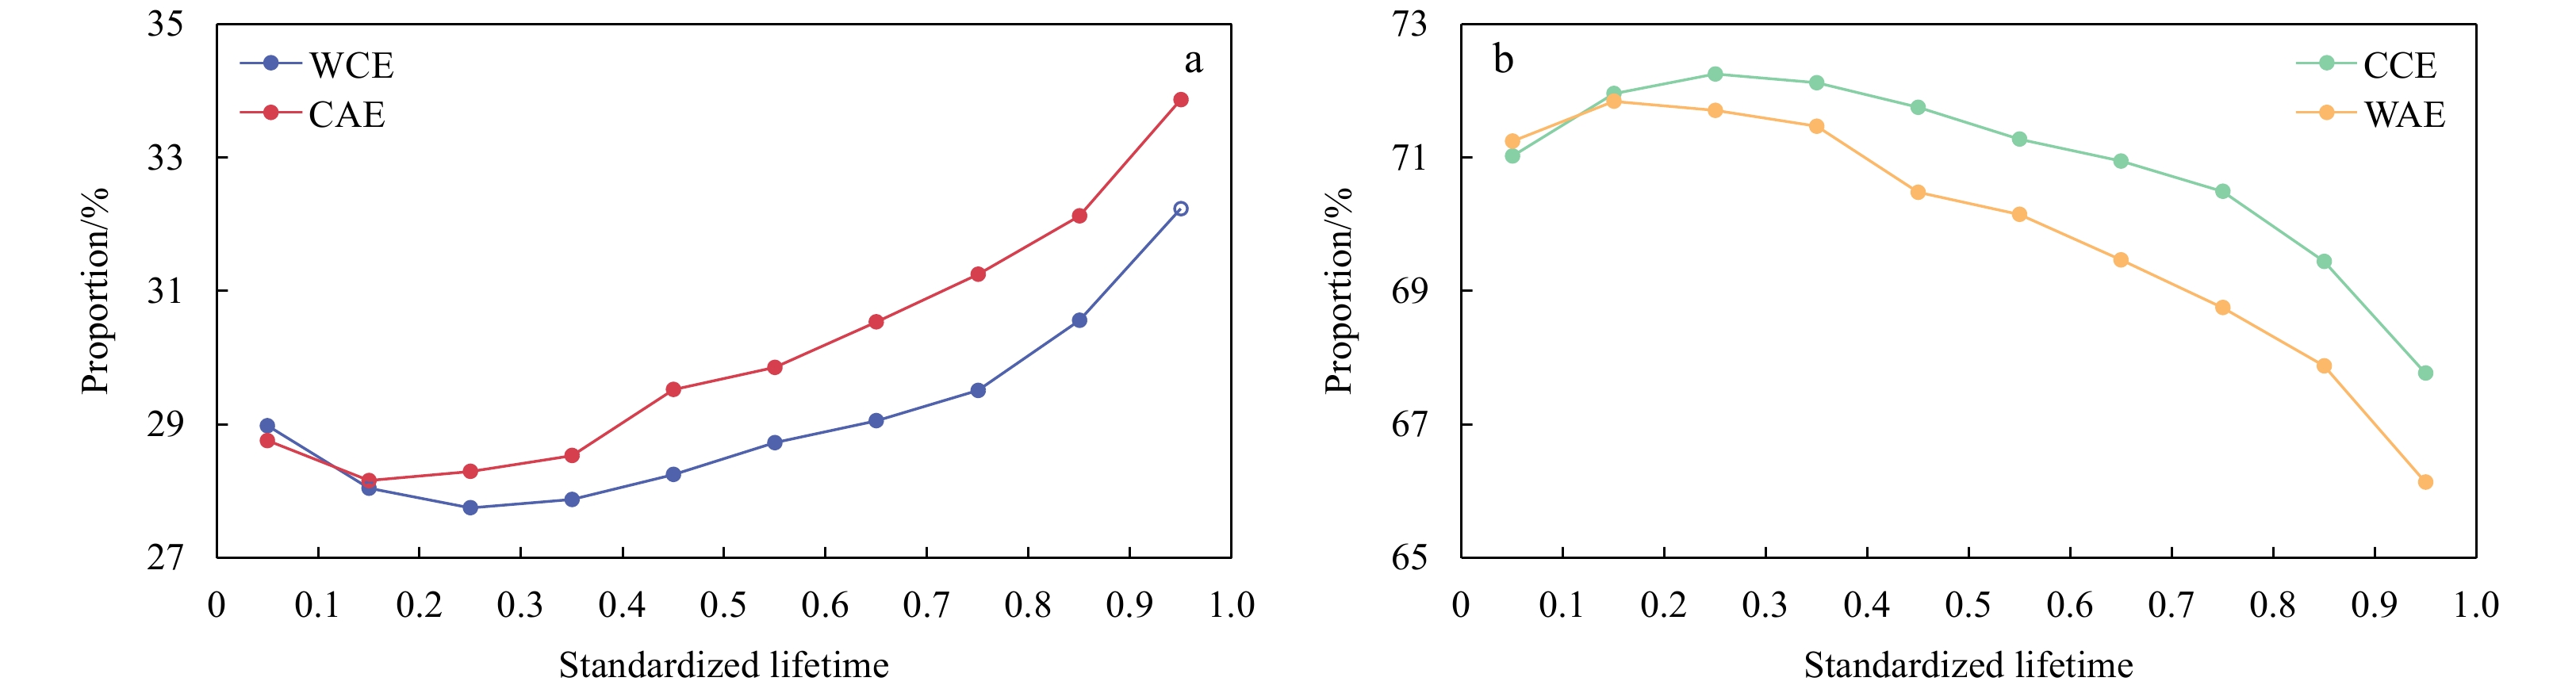
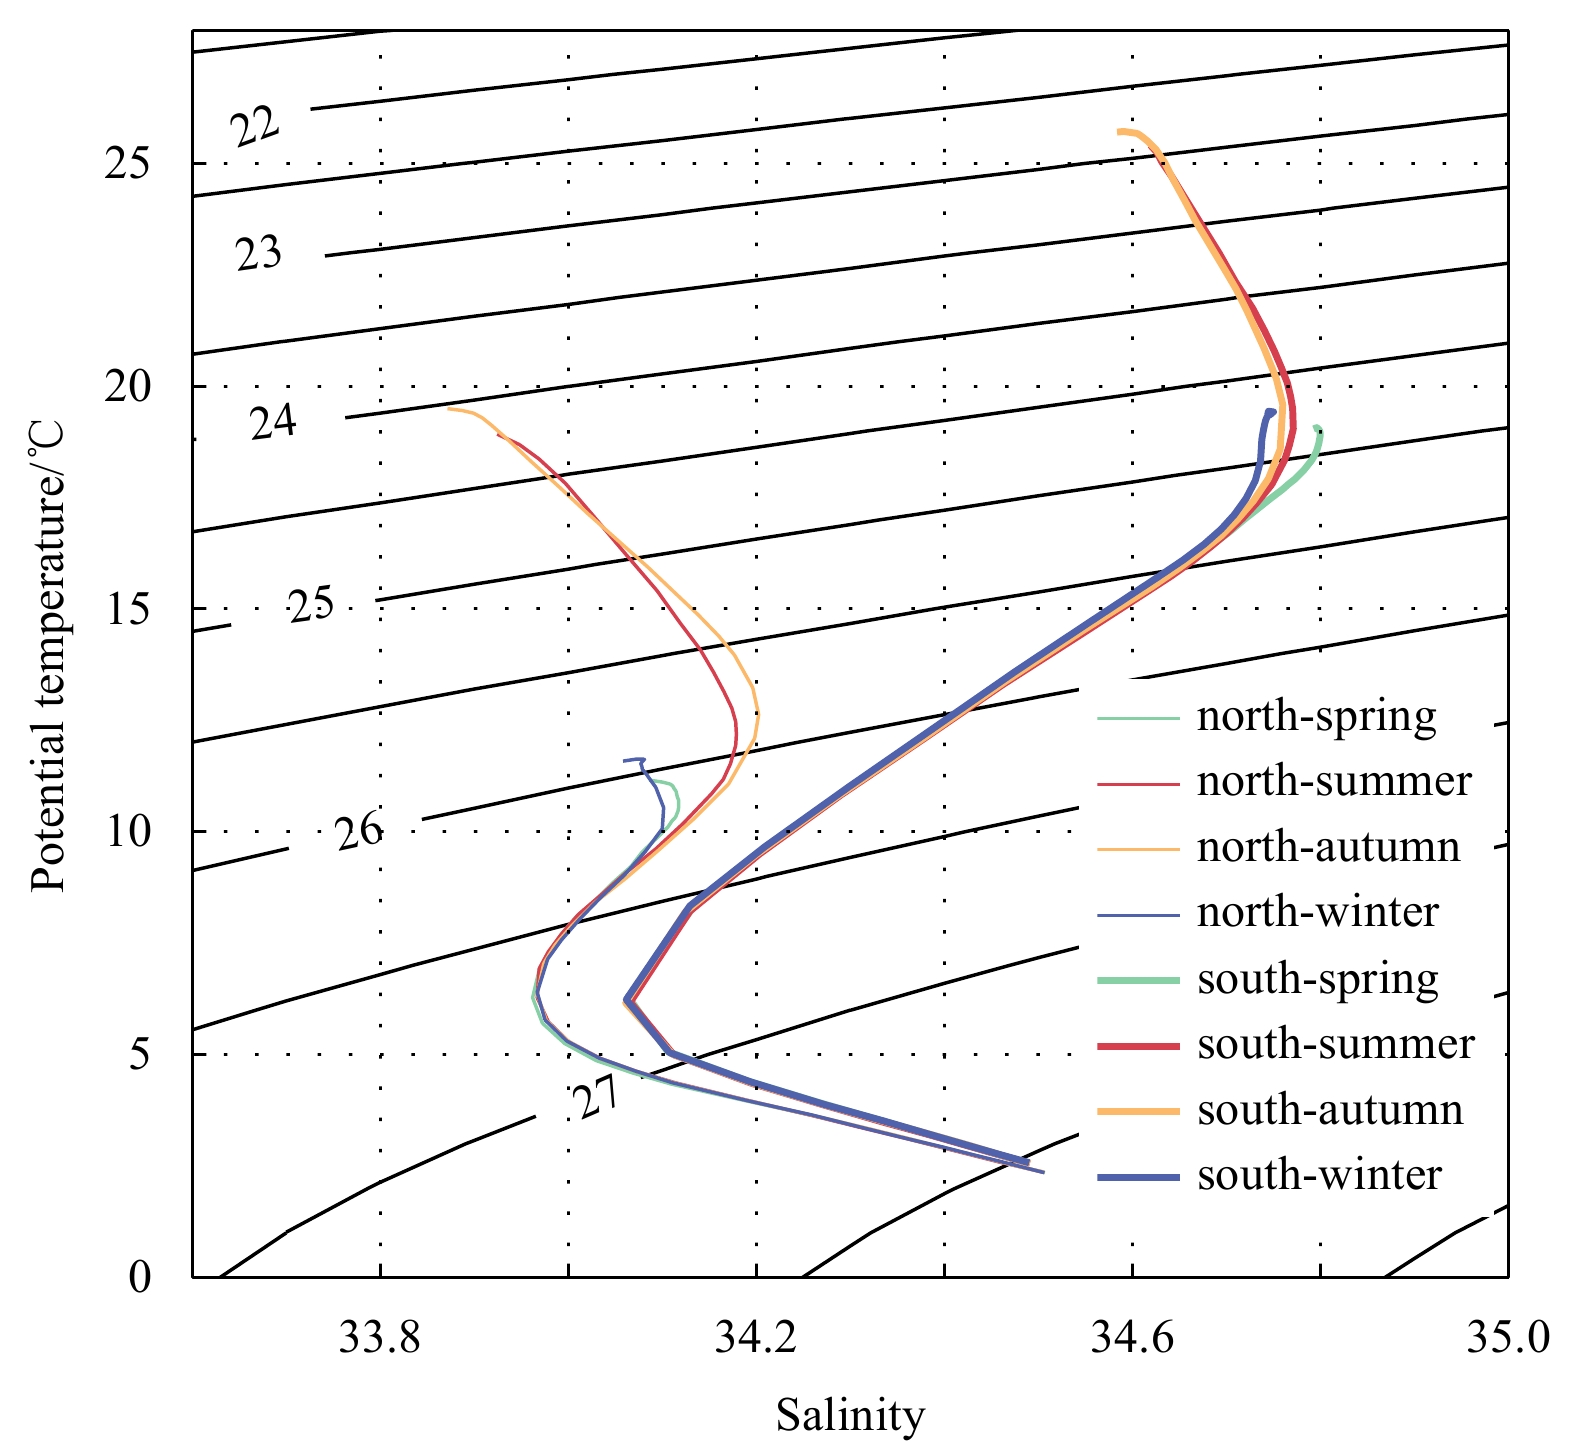
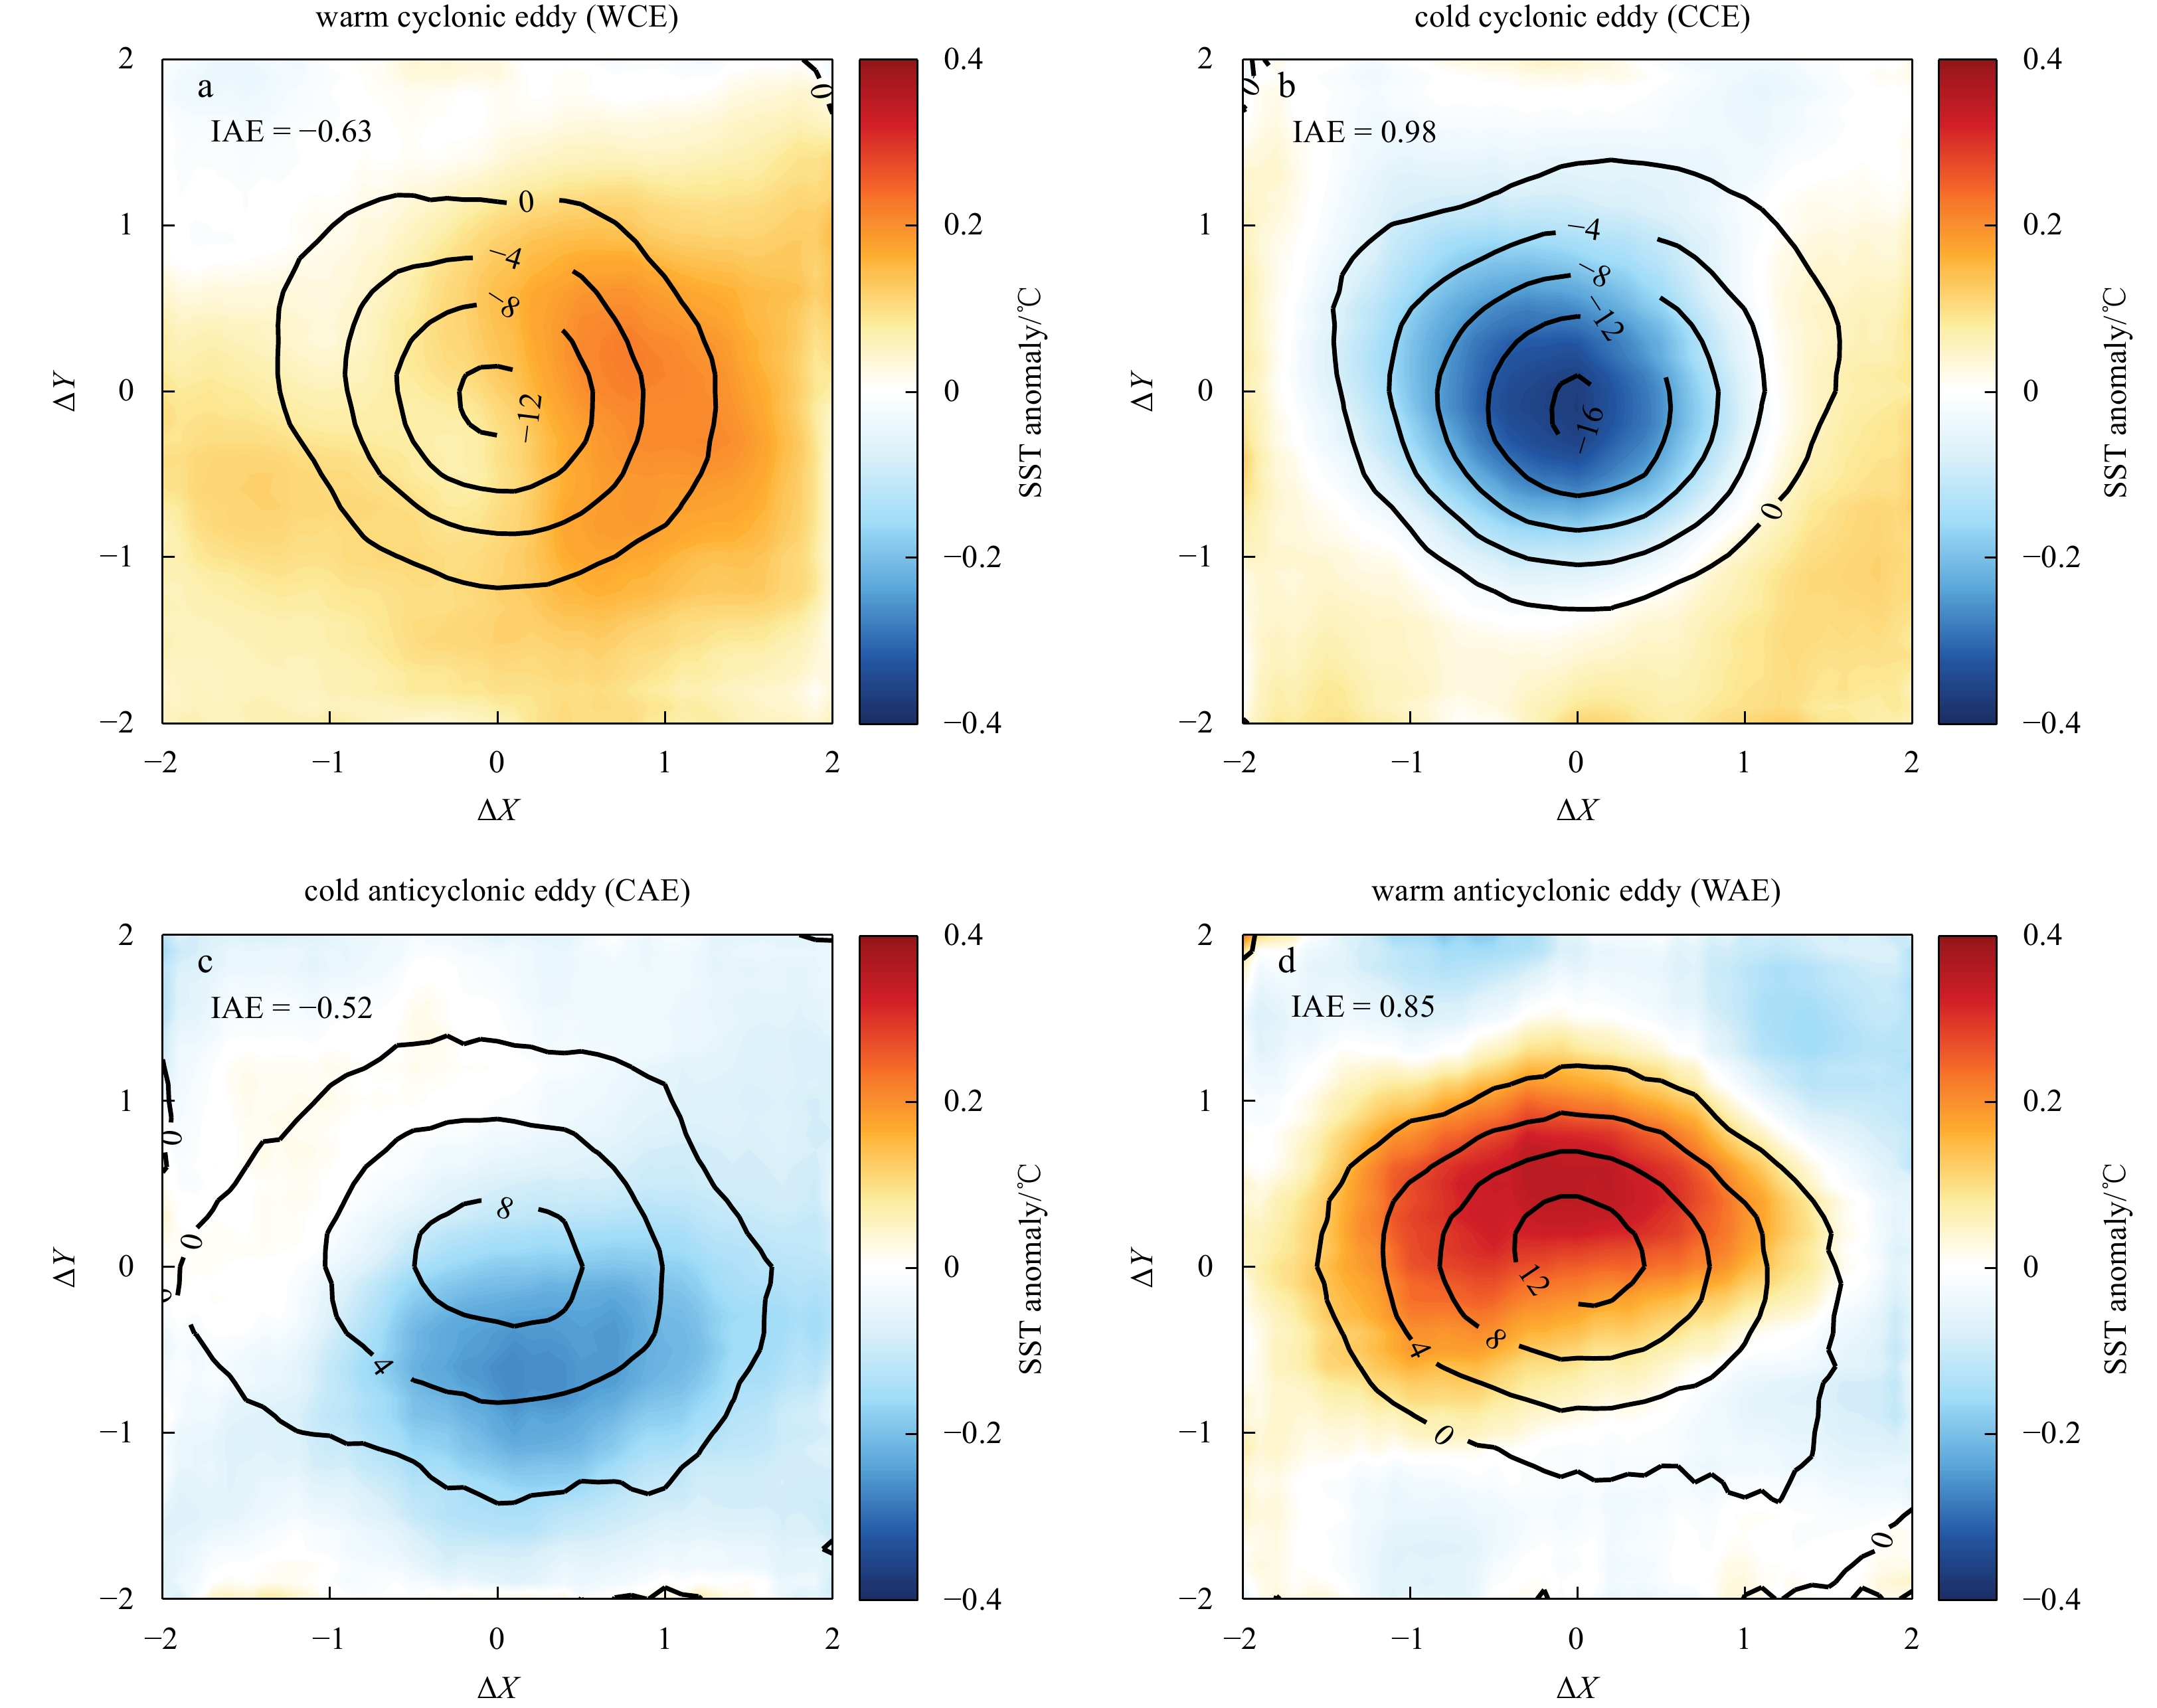
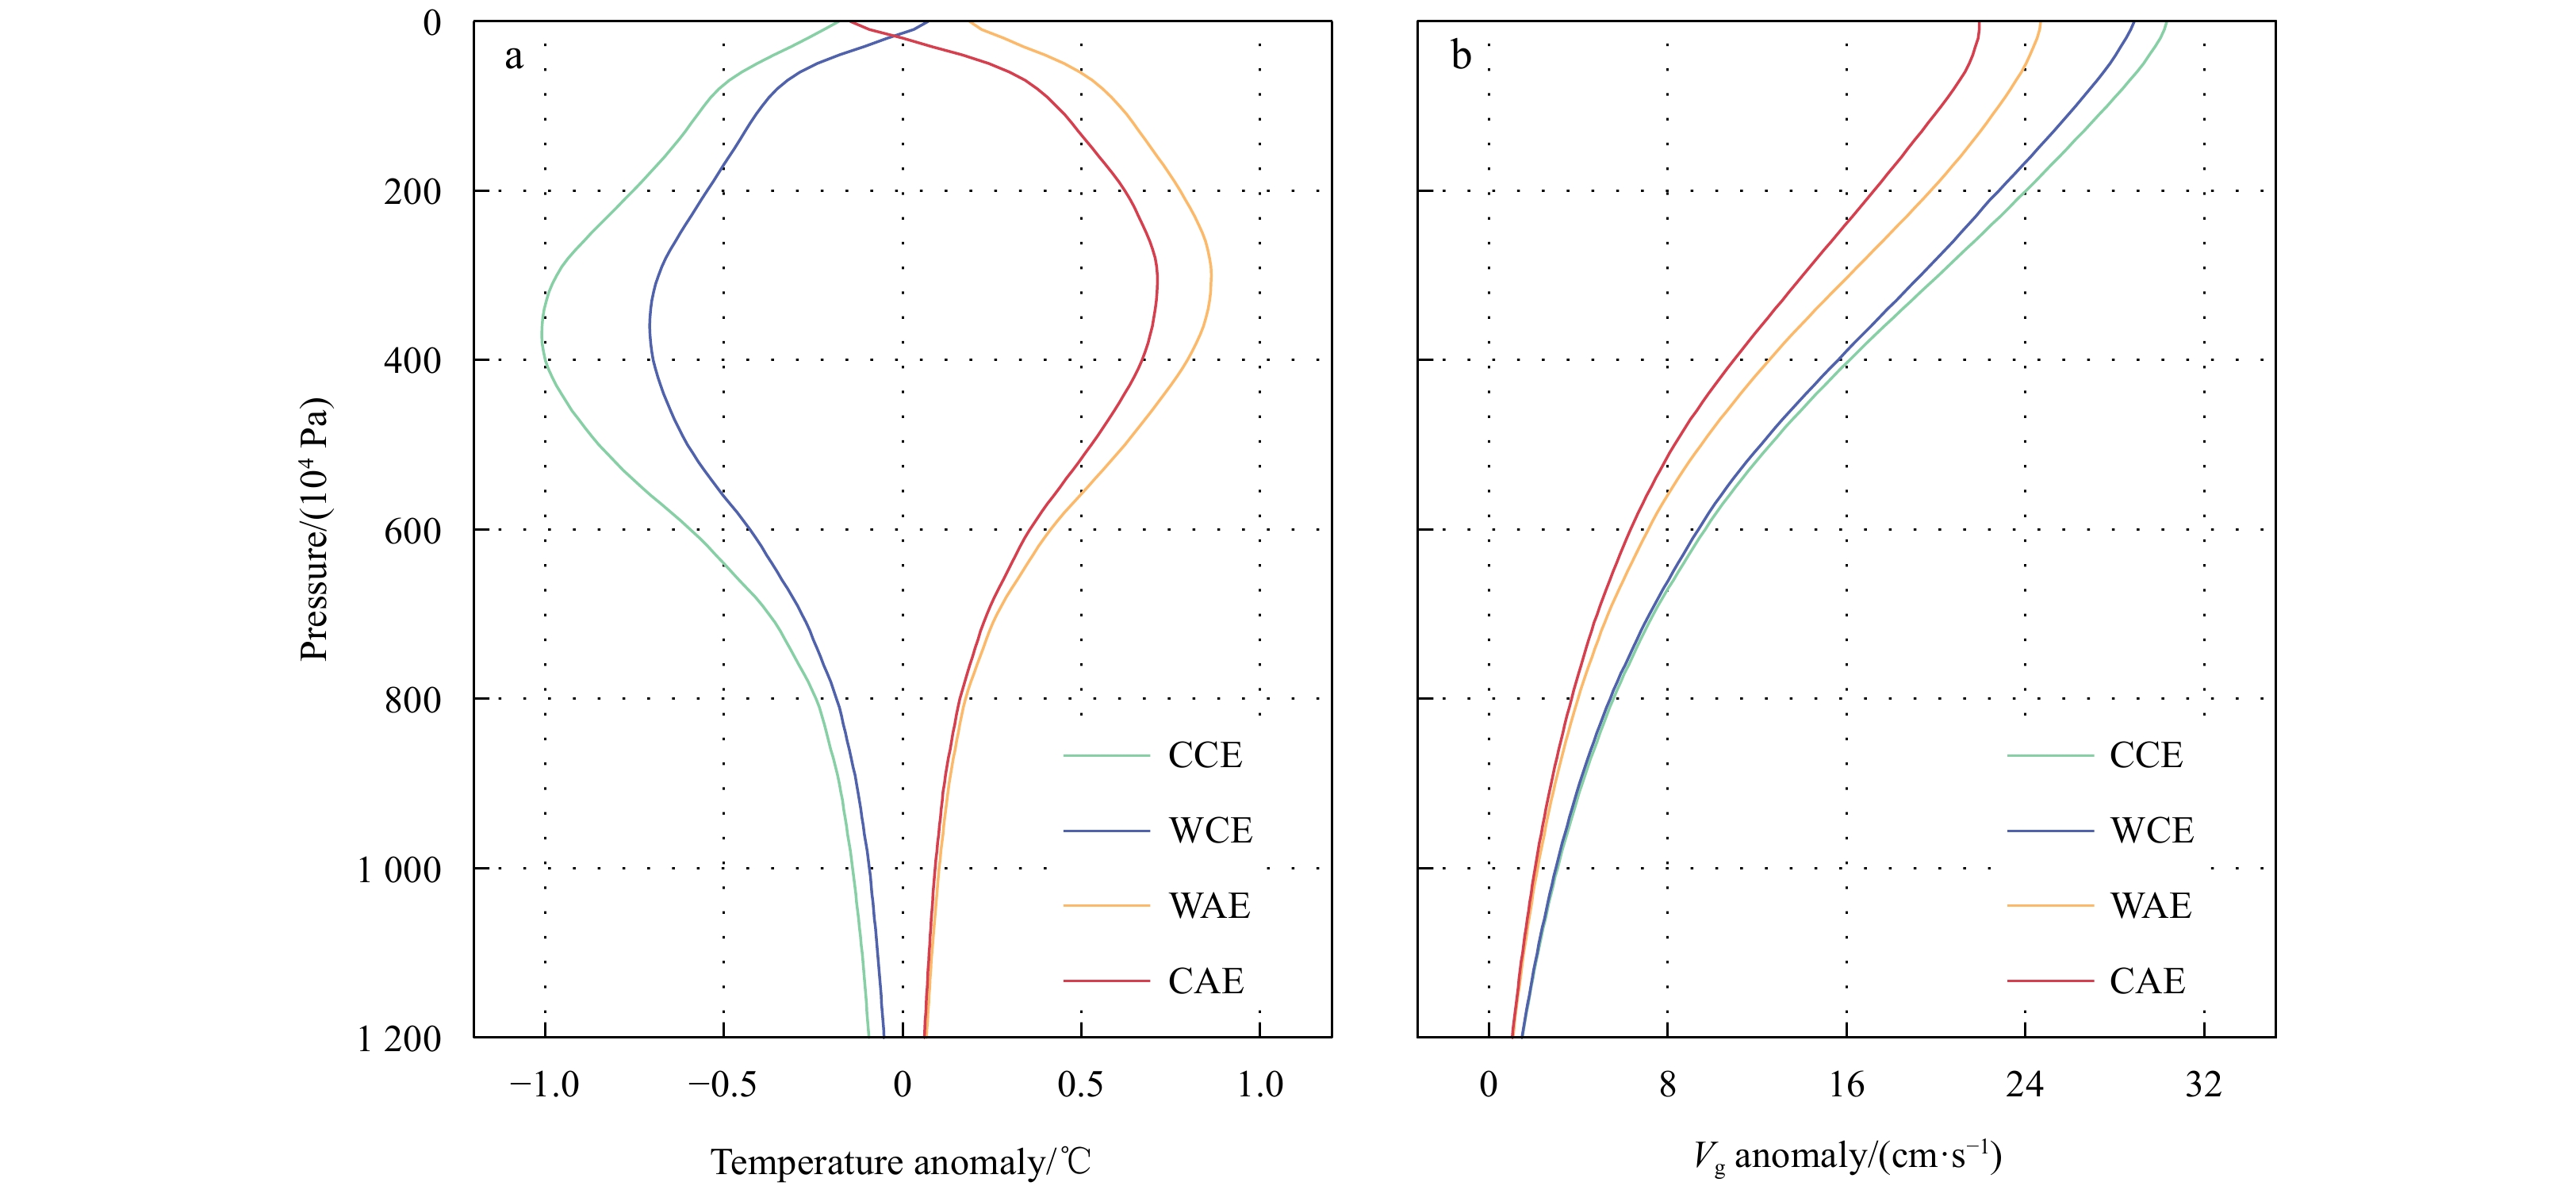
Except for conventional mesoscale eddies, there are also abundant warm cyclonic eddies (WCEs) and cold anticyclonic eddies (CAEs) in the global ocean. Based on the global mesoscale eddy trajectory atlas product, satellite altimetric and remote sensing datasets, and three-dimensional temperature/salinity dataset, spatiotemporal features of WCEs and CAEs are compared with traditional cold cyclonic eddies and warm anticyclonic eddies in the Kuroshio Extension (KE; 28°−43°N, 140°−170°E) region. Characteristics of abnormal eddies like radius, amplitude, eddy kinetic energy, and proportion in all eddies behave in significant asymmetry on the north and south sides of the KE jet. Unlike eddies in the general sense, temporal feature analysis reveals that it is more favorable to the formation and maintenance of WCEs and CAEs in summer and autumn, while winter is the opposite. The spatiotemporal variation of abnormal eddies is likely because the marine environment varying with time and space. Statistically, proportion of abnormal eddies increases rapidly in decaying stage during the whole eddy lifespan, resulting in smaller average radius, amplitude, sea surface temperature anomaly and sea surface height anomaly compared to normal ones. The three-dimensional composite structures for four types of eddies expose that the difference between abnormal and conventional eddies is not just limited to the sea surface, but also exists within the water below the sea surface. Vertical structures also indicate that the anomalous temperature signal is confined in the water from the sea surface to layers at about 30 m in the KE region.
Except for conventional mesoscale eddies, there are also abundant warm cyclonic eddies (WCEs) and cold anticyclonic eddies (CAEs) in the global ocean. Based on the global mesoscale eddy trajectory atlas product, satellite altimetric and remote sensing datasets, and three-dimensional temperature/salinity dataset, spatiotemporal features of WCEs and CAEs are compared with traditional cold cyclonic eddies and warm anticyclonic eddies in the Kuroshio Extension (KE; 28°−43°N, 140°−170°E) region. Characteristics of abnormal eddies like radius, amplitude, eddy kinetic energy, and proportion in all eddies behave in significant asymmetry on the north and south sides of the KE jet. Unlike eddies in the general sense, temporal feature analysis reveals that it is more favorable to the formation and maintenance of WCEs and CAEs in summer and autumn, while winter is the opposite. The spatiotemporal variation of abnormal eddies is likely because the marine environment varying with time and space. Statistically, proportion of abnormal eddies increases rapidly in decaying stage during the whole eddy lifespan, resulting in smaller average radius, amplitude, sea surface temperature anomaly and sea surface height anomaly compared to normal ones. The three-dimensional composite structures for four types of eddies expose that the difference between abnormal and conventional eddies is not just limited to the sea surface, but also exists within the water below the sea surface. Vertical structures also indicate that the anomalous temperature signal is confined in the water from the sea surface to layers at about 30 m in the KE region.


2024, 43(5): 41-53.
doi: 10.1007/s13131-023-2299-6
Abstract:
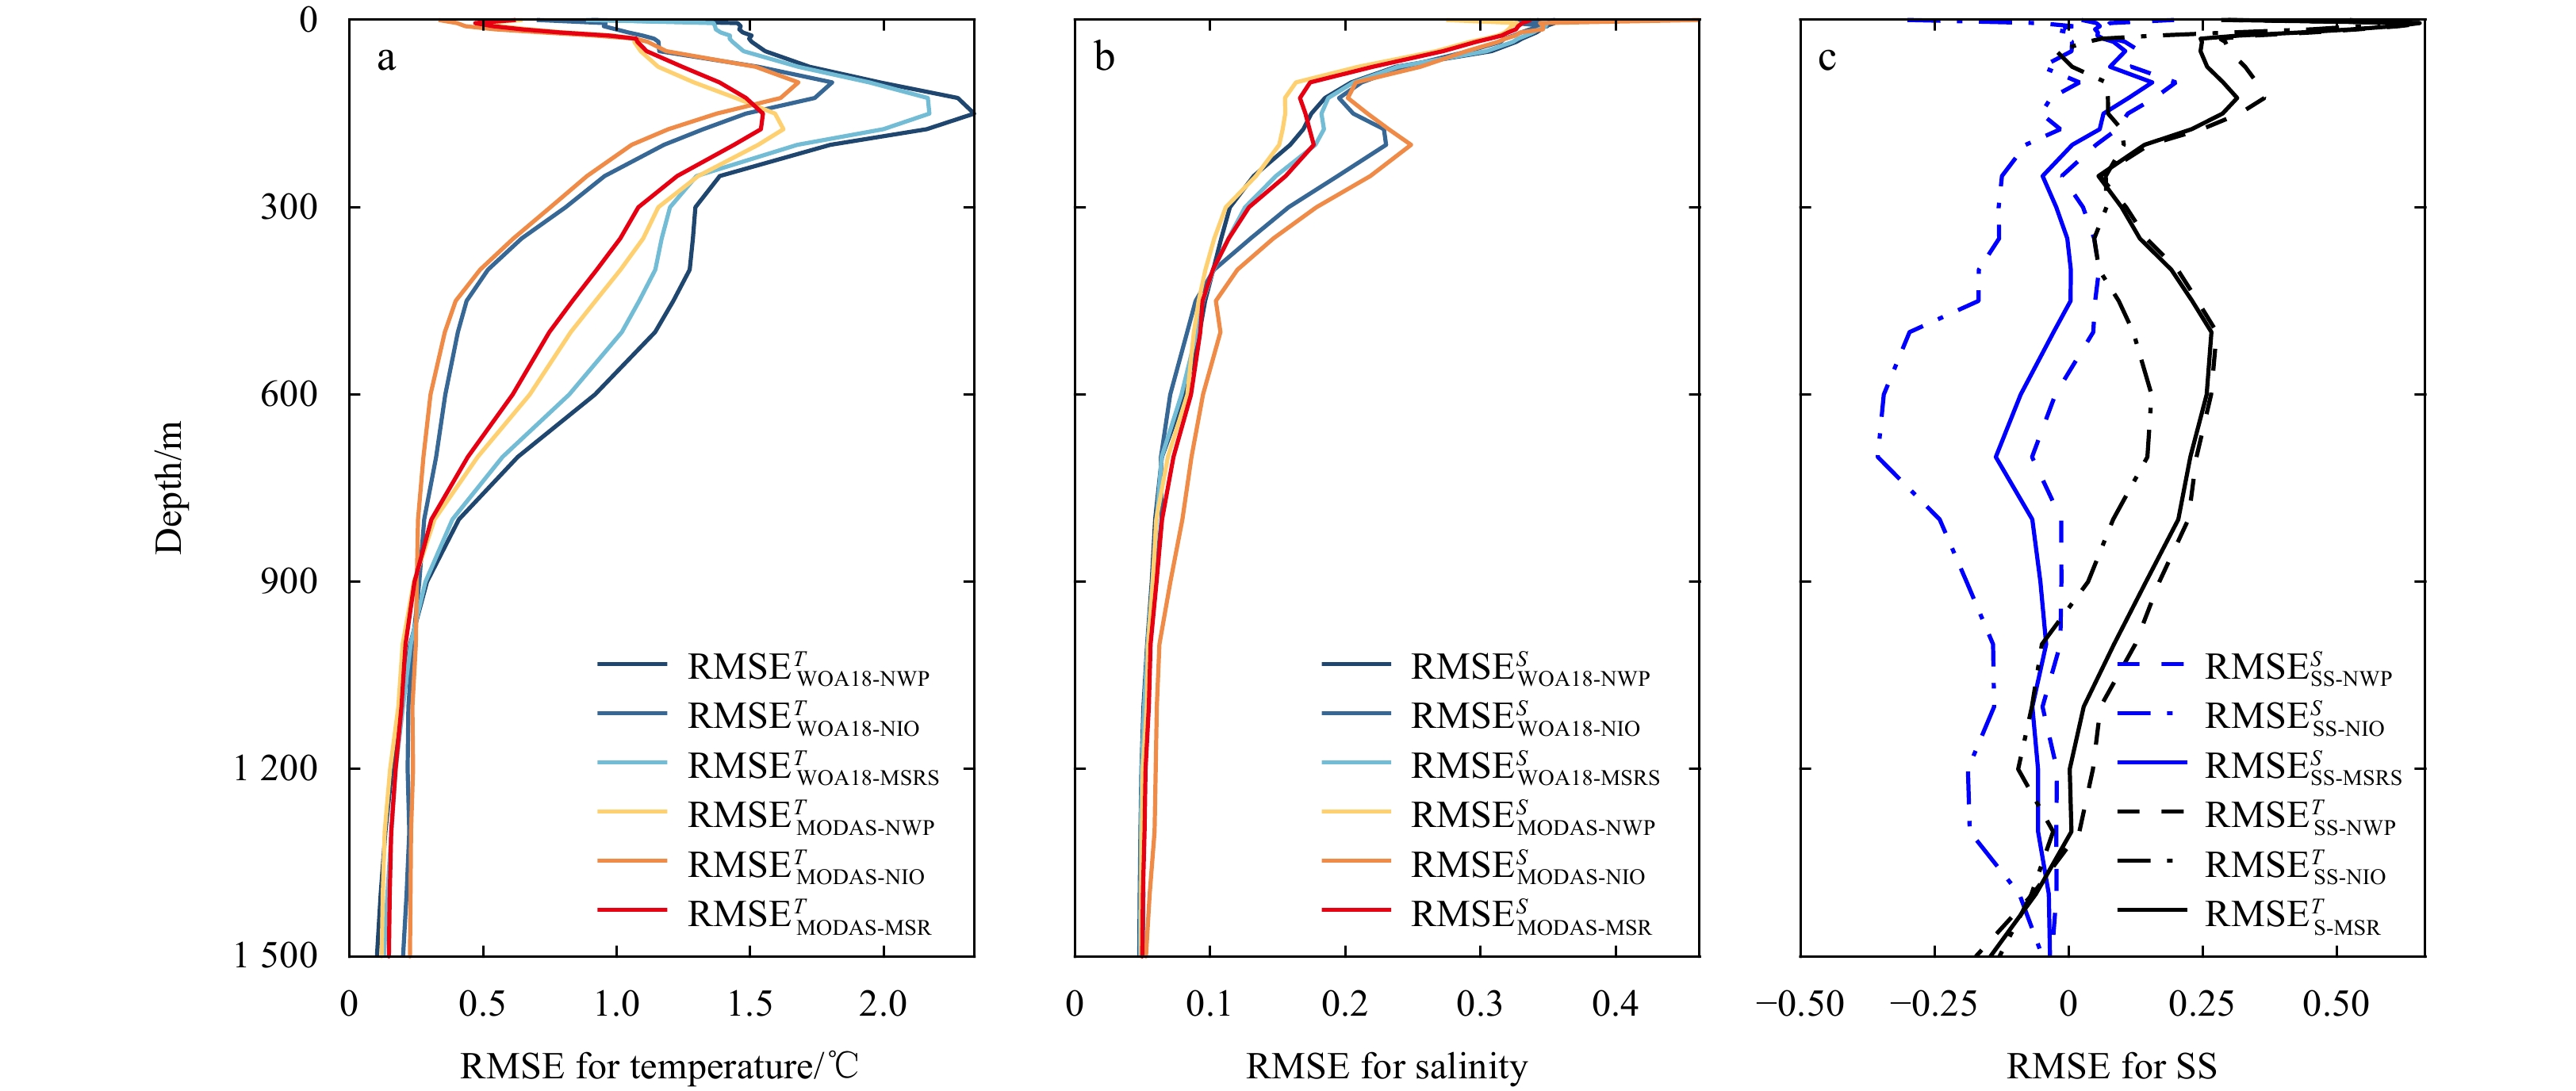
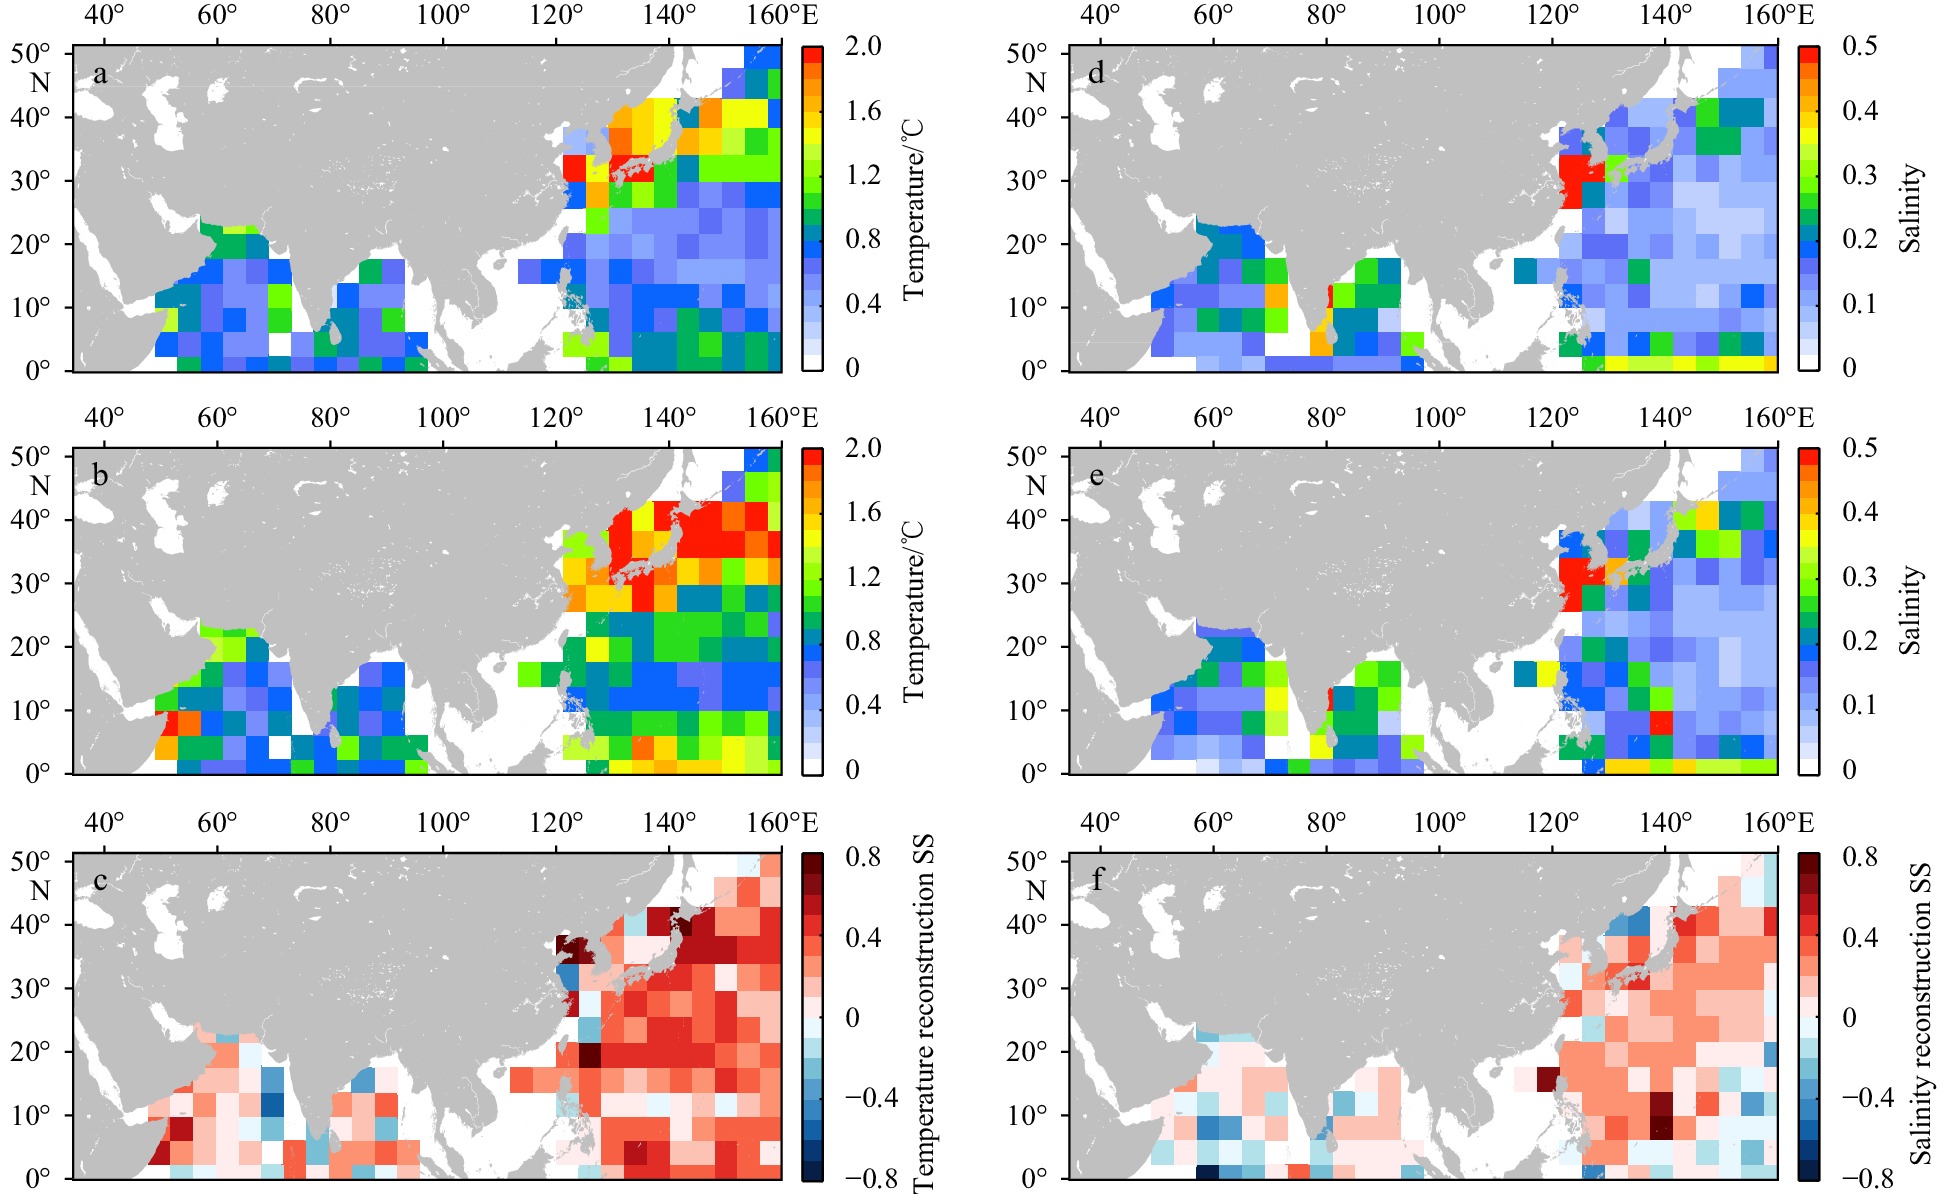
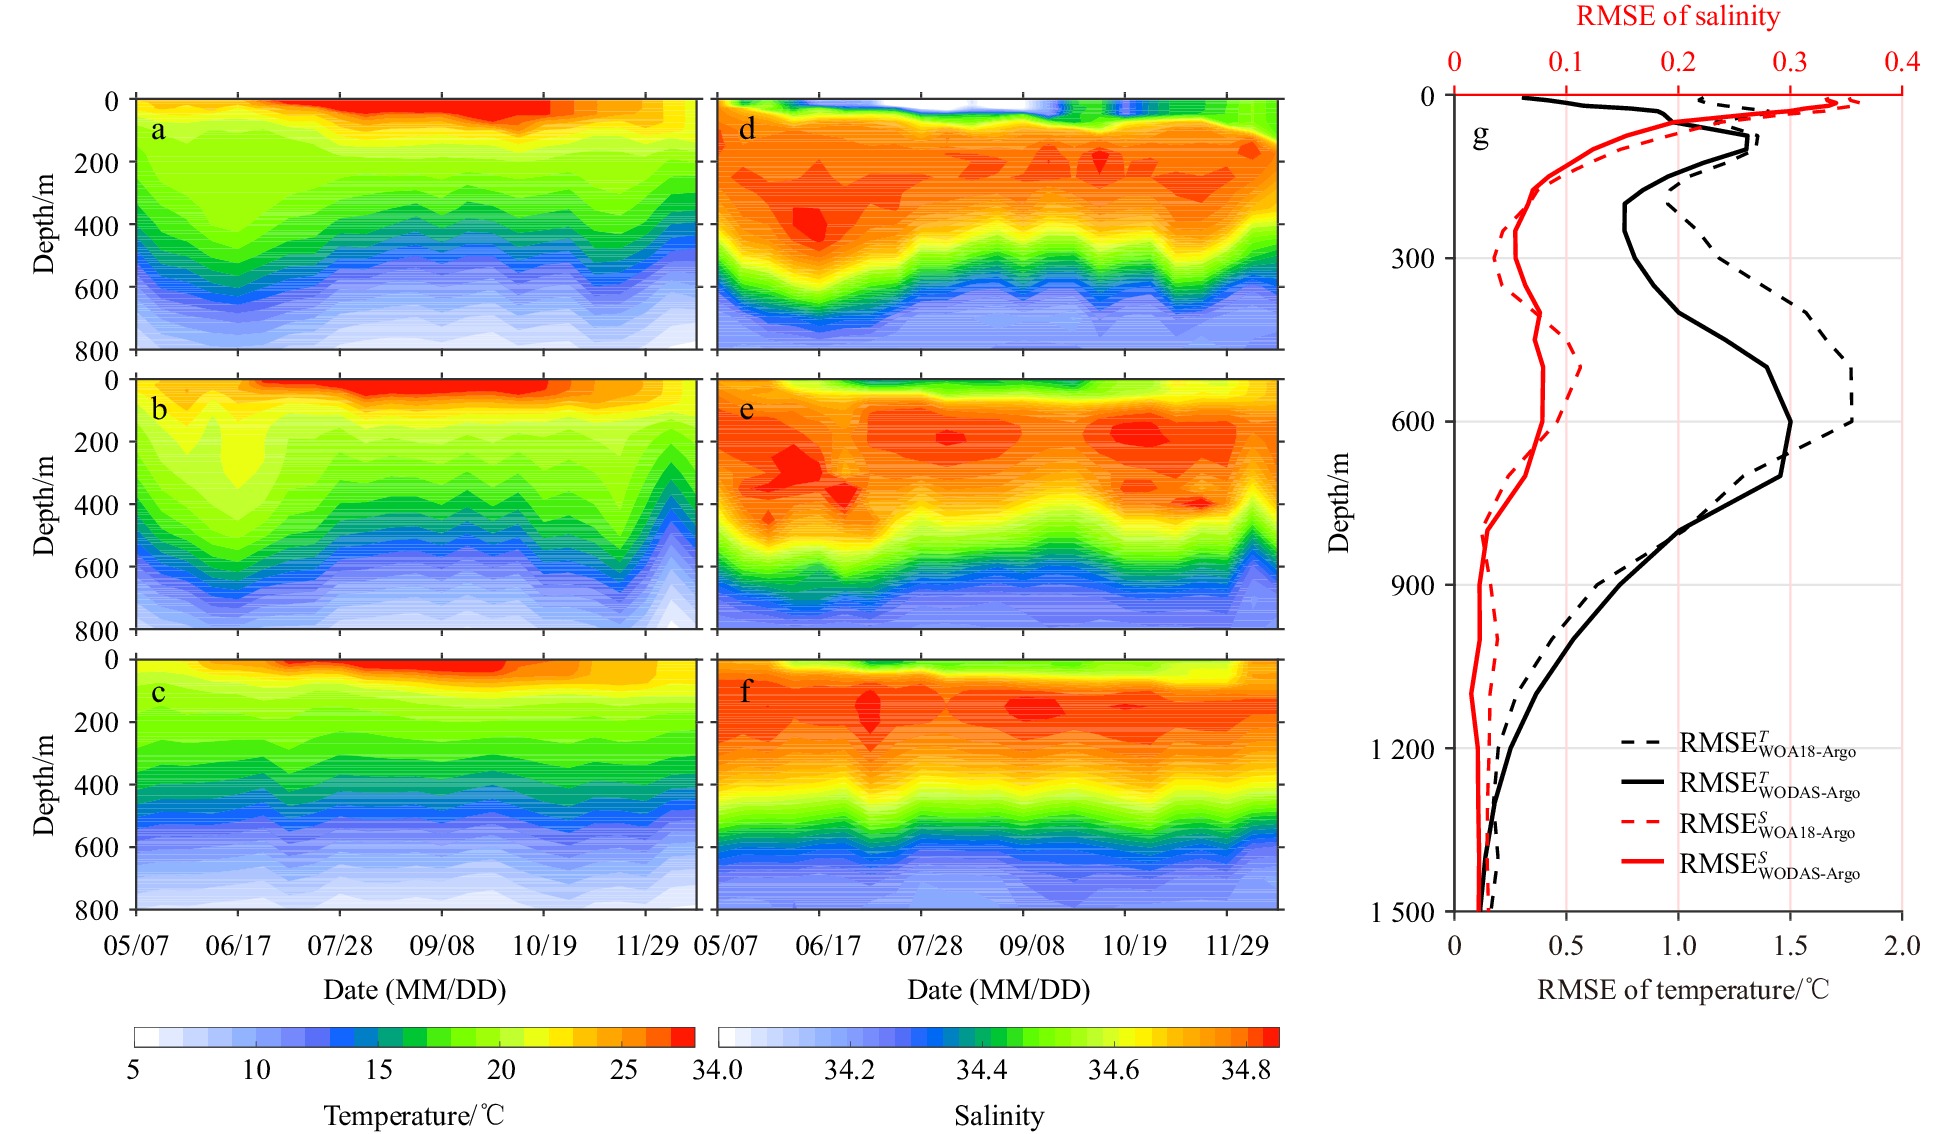
Estimated ocean subsurface fields derived from satellite observations provide potential data sources for operational marine environmental monitoring and prediction systems. This study employs a statistic regression reconstruction method, in combination with domestic autonomous sea surface height and sea surface temperature observations from the Haiyang-2 (HY-2) satellite fusion data, to establish an operational quasi-real-time three-dimensional (3D) temperature and salinity products over the Maritime Silk Road. These products feature a daily temporal resolution and a spatial resolution of 0.25° × 0.25° and exhibit stability and continuity. We have demonstrated the accuracy of the reconstructed thermohaline fields in capturing the 3D thermohaline variations through comprehensive statistical evaluations, after comparing them against Argo observations and ocean analysis data from 2022. The results illustrate that the reconstructed fields effectively represent seasonal variations in oceanic subsurface structures, along with structural changes resulting from mesoscale processes, and the upper ocean’s responses to tropical cyclones. Furthermore, the incorporation of HY-2 satellite observations notably enhances the accuracy of temperature and salinity reconstructions in the Northwest Pacific Ocean and marginally improves salinity reconstruction accuracy in the North Indian Ocean when compared to the World Ocean Atlas 2018 monthly climatology thermohaline fields. As a result, the reconstructed product holds promise for providing quasi-real-time 3D temperature and salinity field information to facilitate fast decision-making during emergencies, and also offers foundational thermohaline fields for operational ocean reanalysis and forecasting systems. These contributions enhance the safety and stability of ocean subsurface activities and navigation.
Estimated ocean subsurface fields derived from satellite observations provide potential data sources for operational marine environmental monitoring and prediction systems. This study employs a statistic regression reconstruction method, in combination with domestic autonomous sea surface height and sea surface temperature observations from the Haiyang-2 (HY-2) satellite fusion data, to establish an operational quasi-real-time three-dimensional (3D) temperature and salinity products over the Maritime Silk Road. These products feature a daily temporal resolution and a spatial resolution of 0.25° × 0.25° and exhibit stability and continuity. We have demonstrated the accuracy of the reconstructed thermohaline fields in capturing the 3D thermohaline variations through comprehensive statistical evaluations, after comparing them against Argo observations and ocean analysis data from 2022. The results illustrate that the reconstructed fields effectively represent seasonal variations in oceanic subsurface structures, along with structural changes resulting from mesoscale processes, and the upper ocean’s responses to tropical cyclones. Furthermore, the incorporation of HY-2 satellite observations notably enhances the accuracy of temperature and salinity reconstructions in the Northwest Pacific Ocean and marginally improves salinity reconstruction accuracy in the North Indian Ocean when compared to the World Ocean Atlas 2018 monthly climatology thermohaline fields. As a result, the reconstructed product holds promise for providing quasi-real-time 3D temperature and salinity field information to facilitate fast decision-making during emergencies, and also offers foundational thermohaline fields for operational ocean reanalysis and forecasting systems. These contributions enhance the safety and stability of ocean subsurface activities and navigation.


2024, 43(5): 54-64.
doi: 10.1007/s13131-024-2324-9
Abstract:
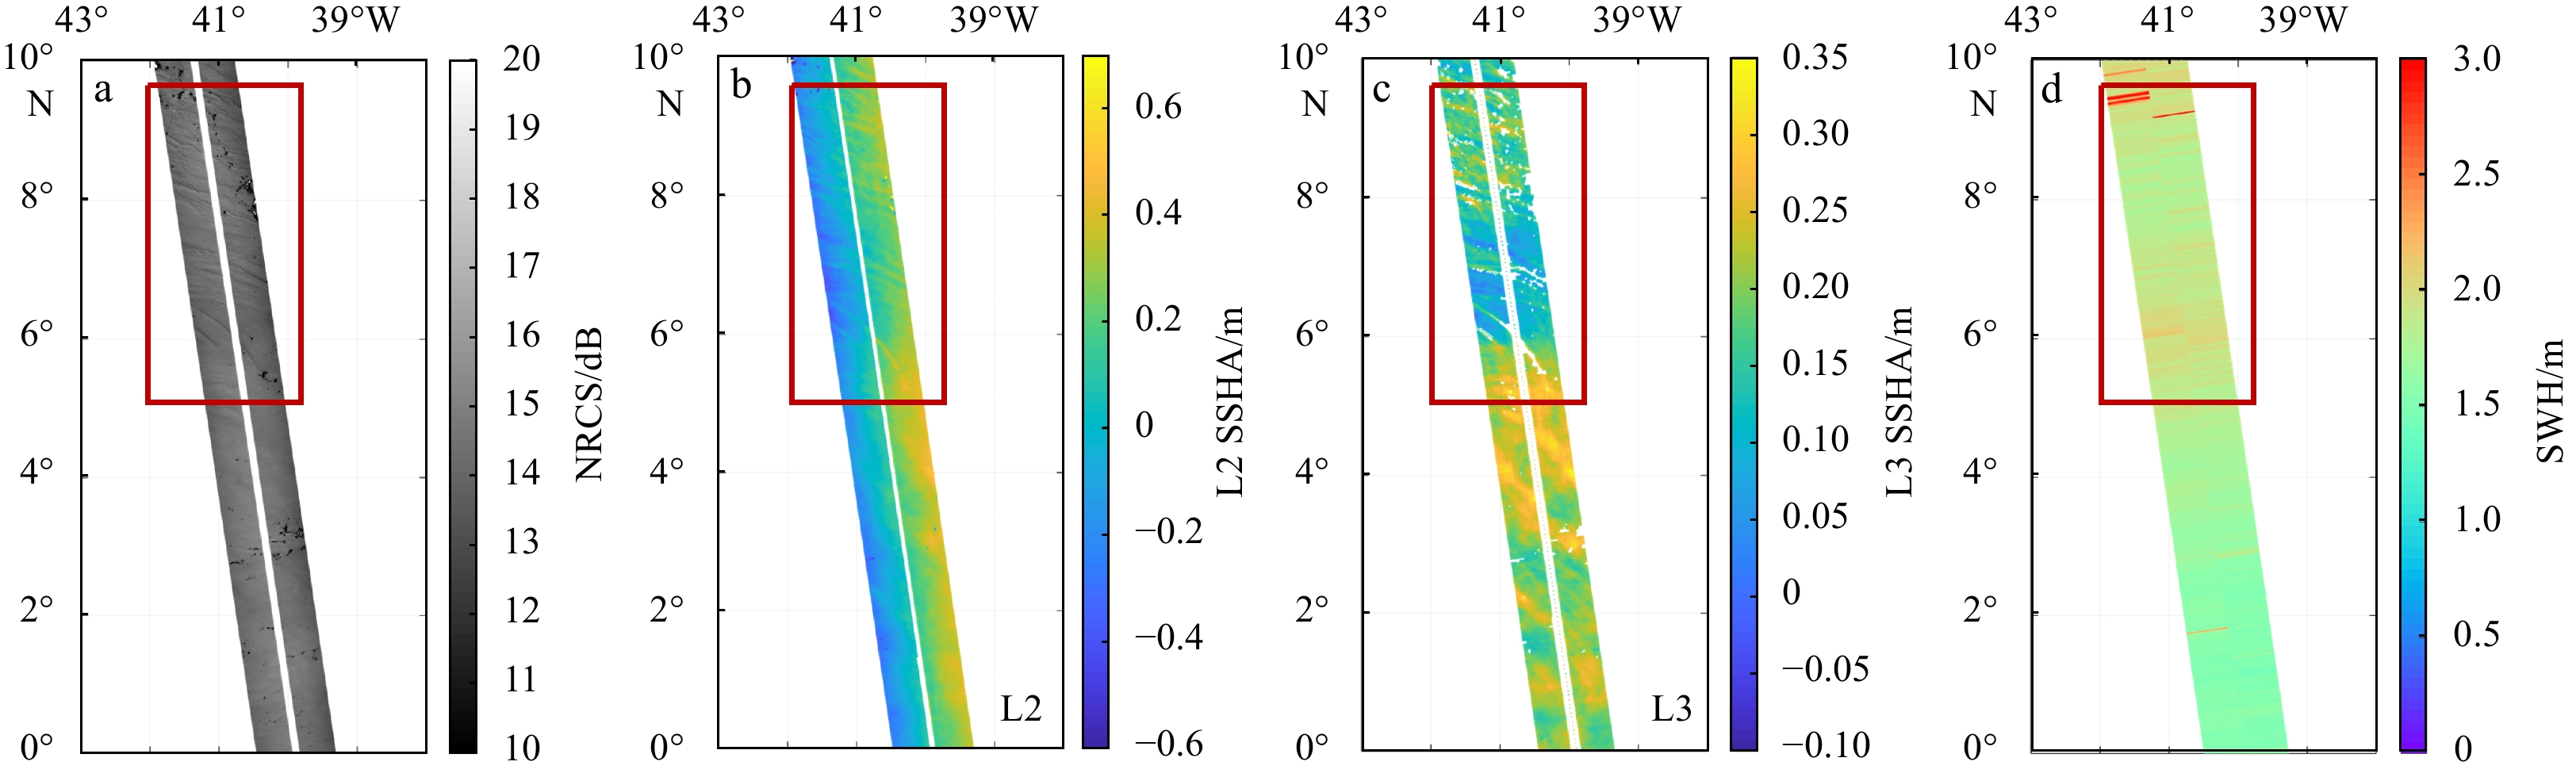
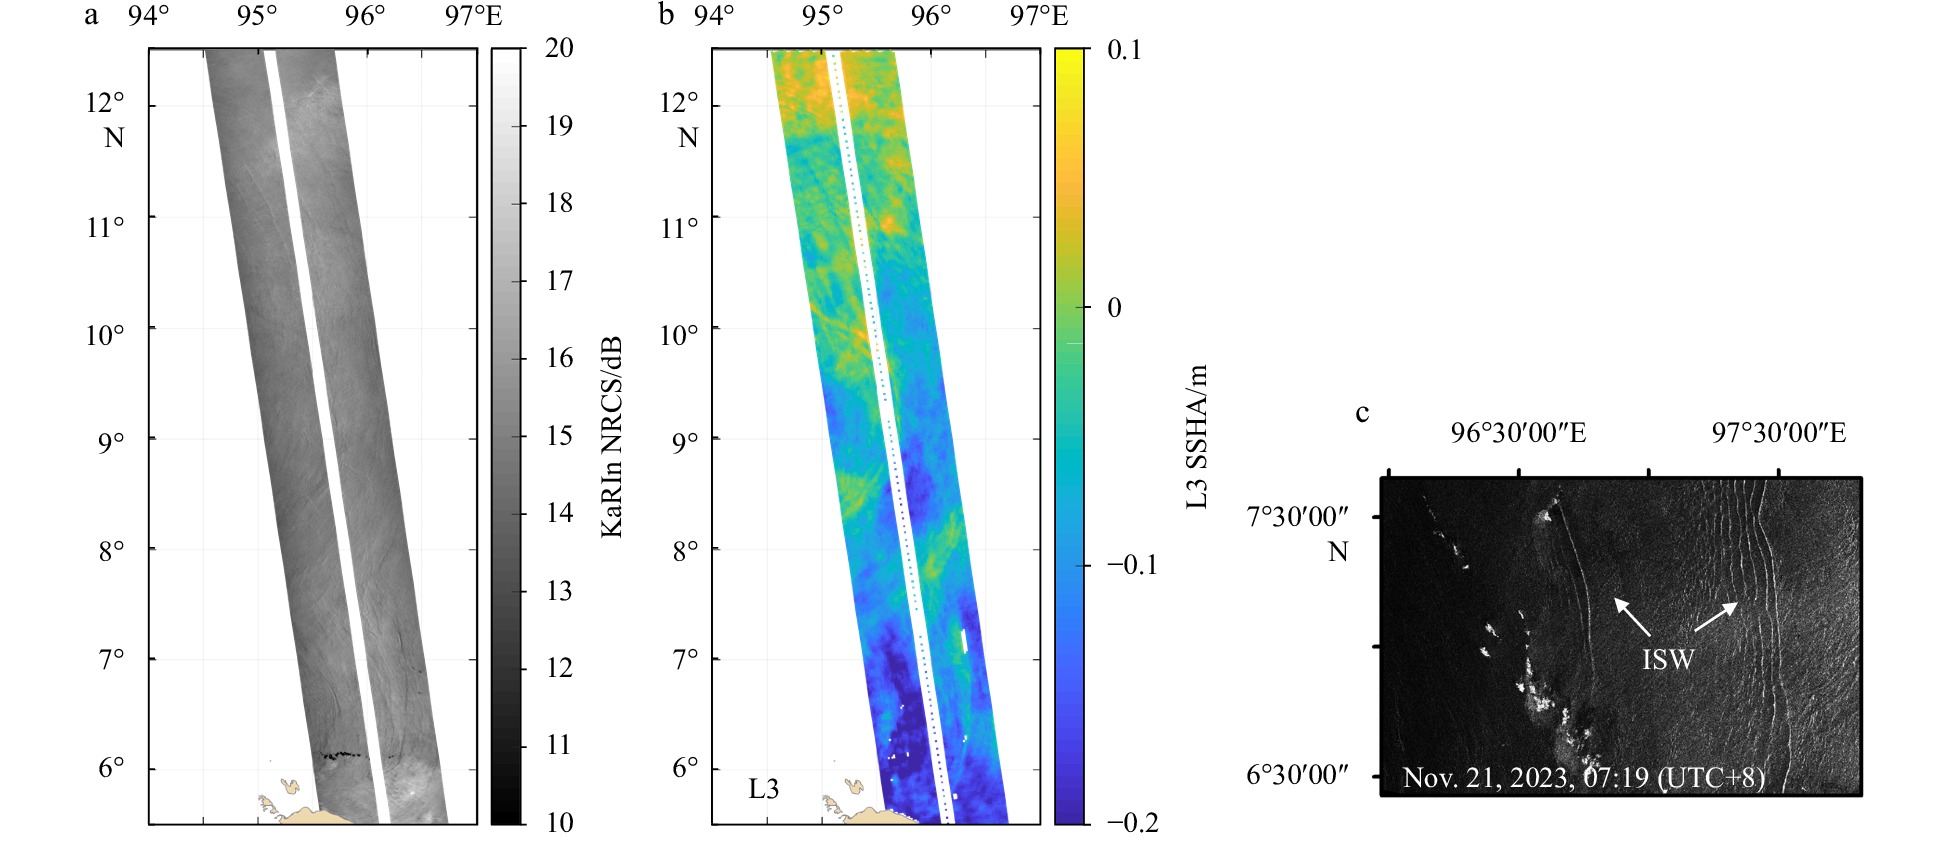
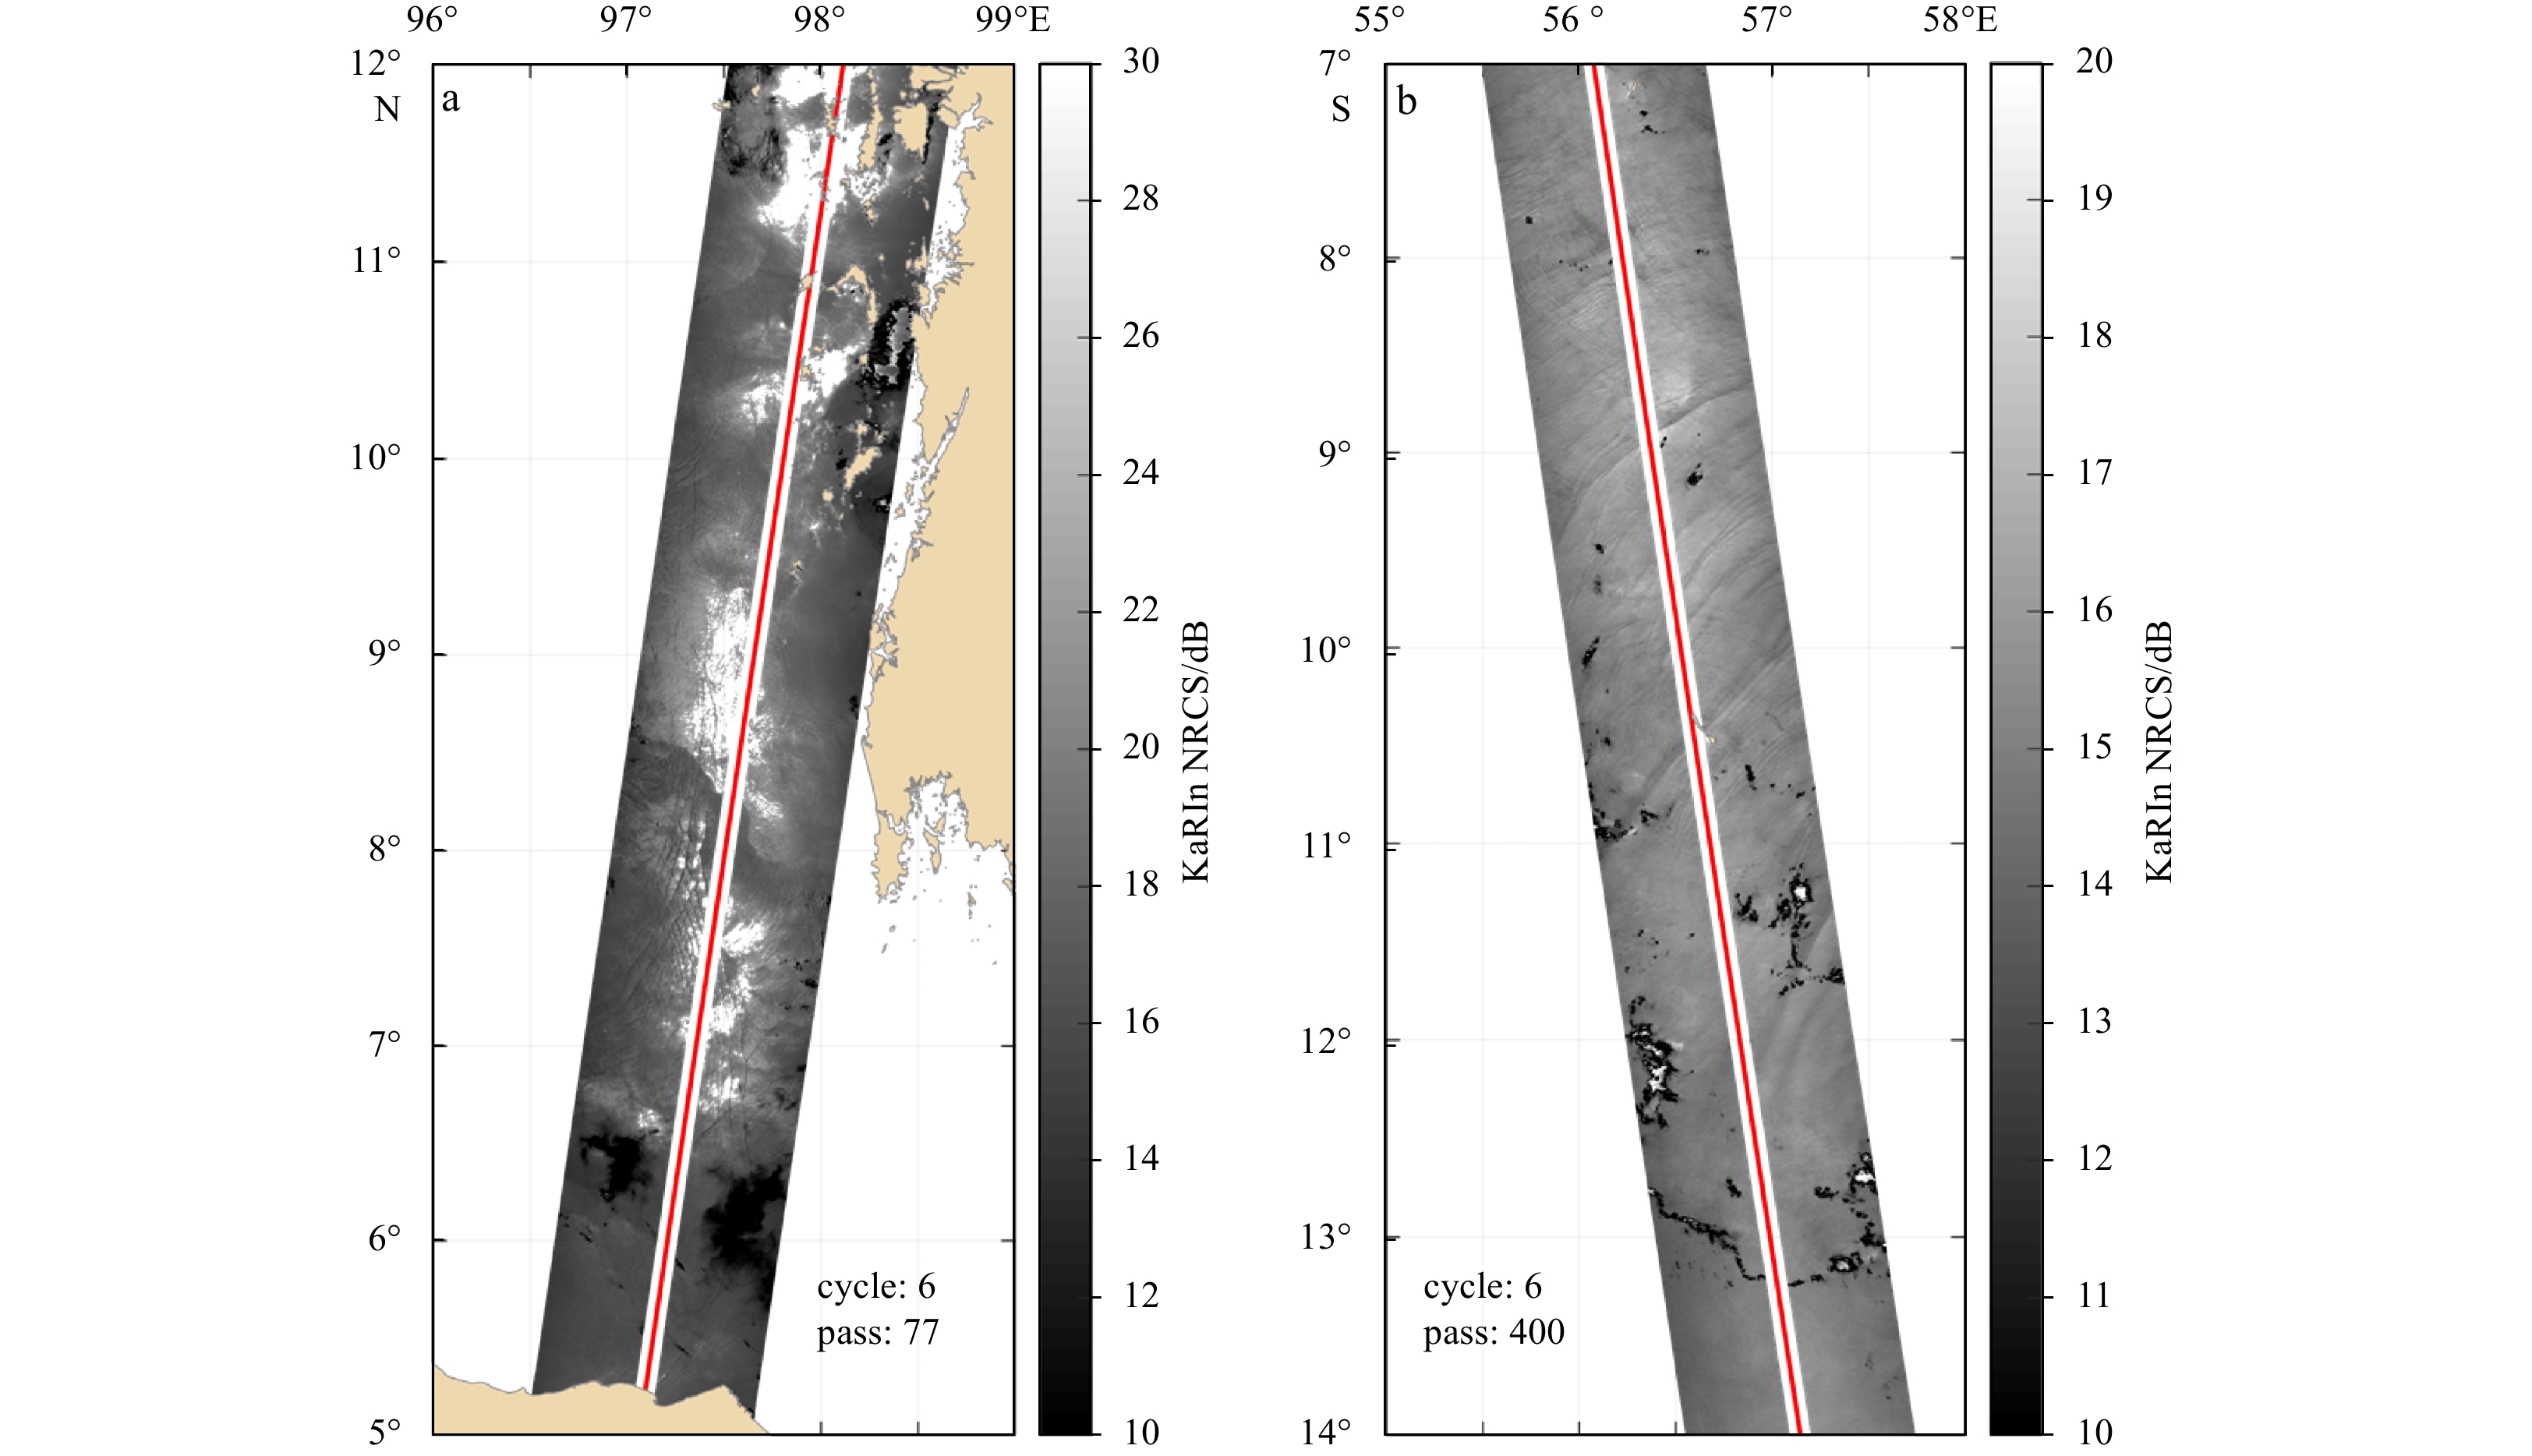
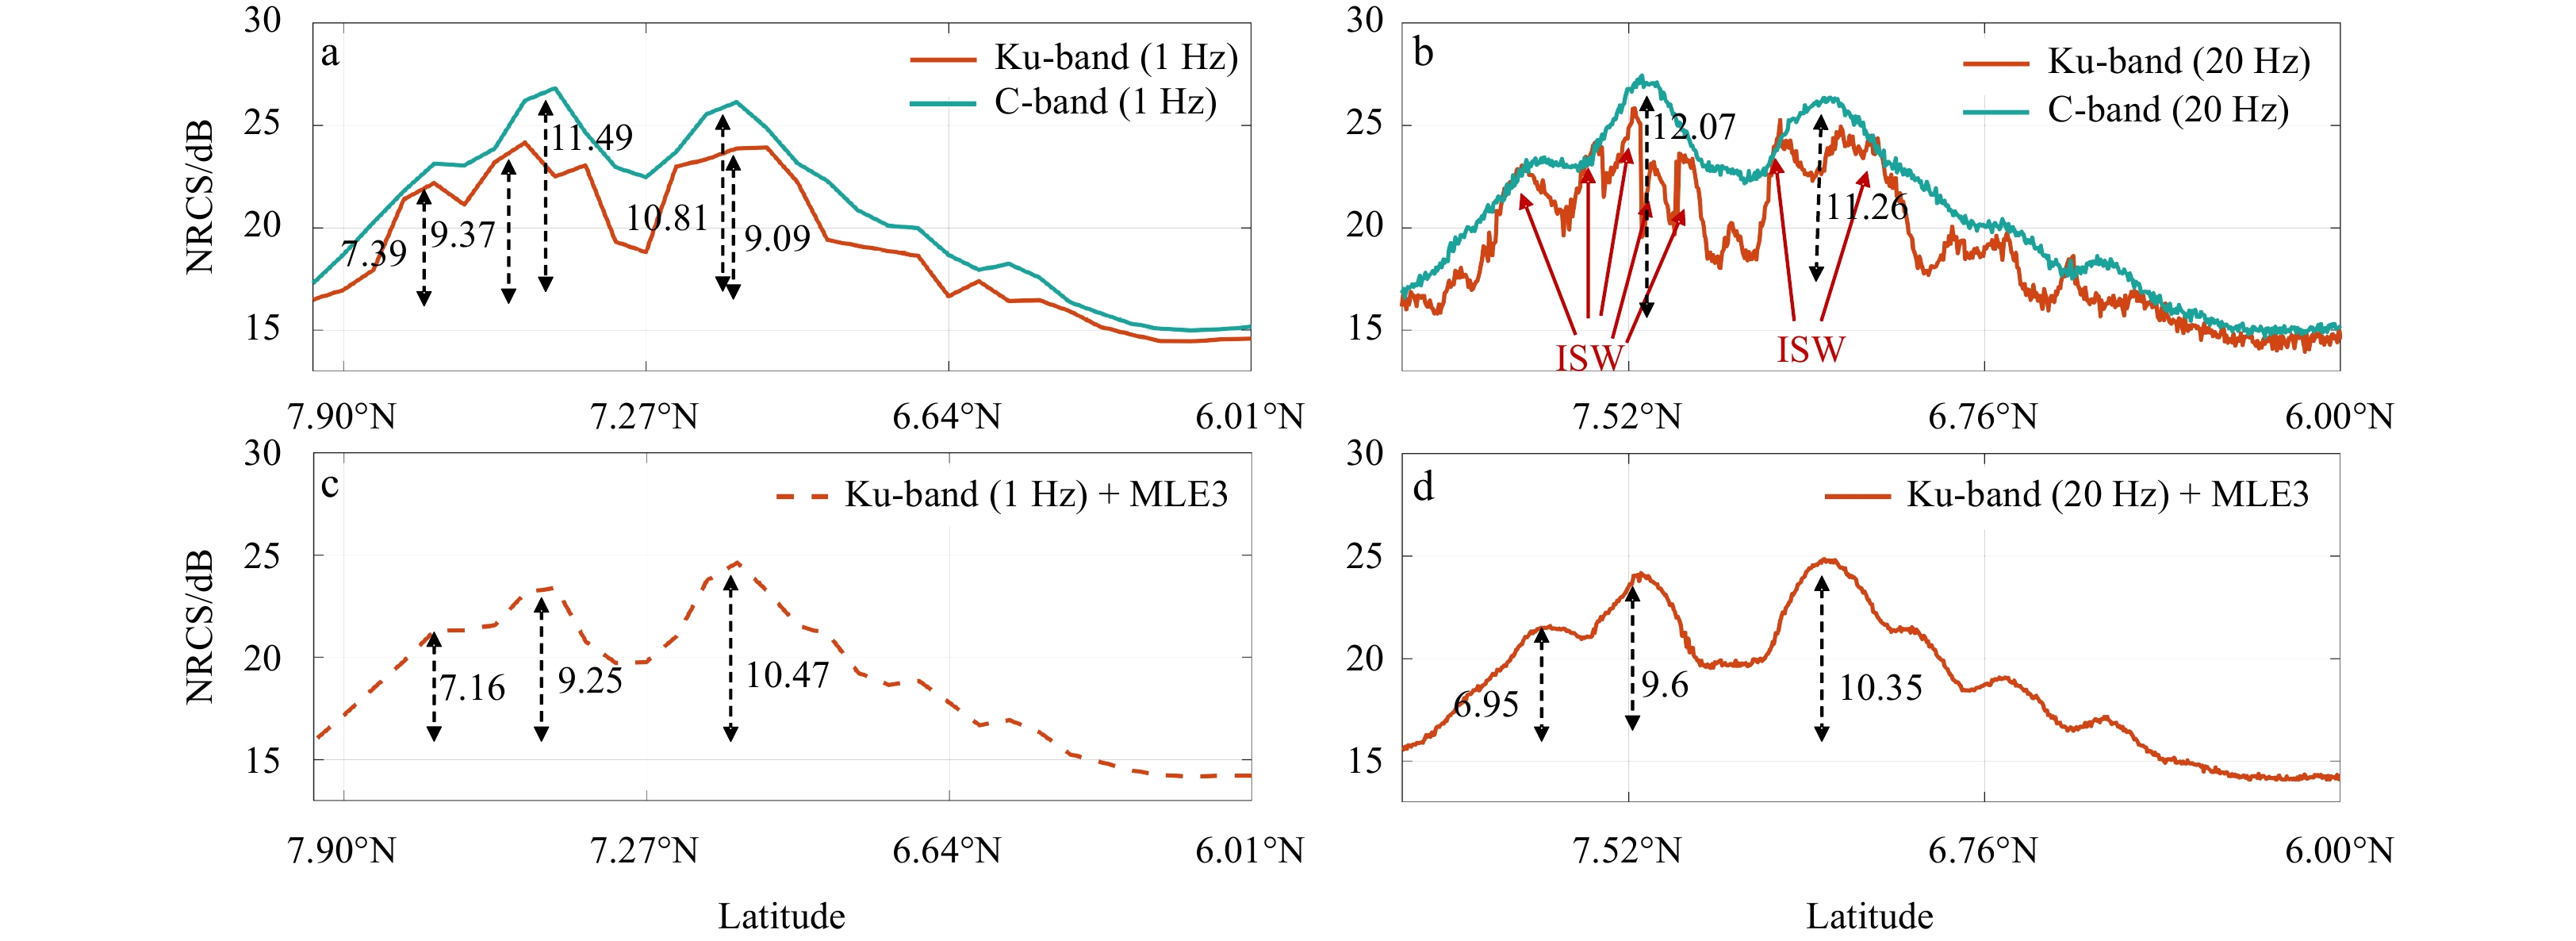
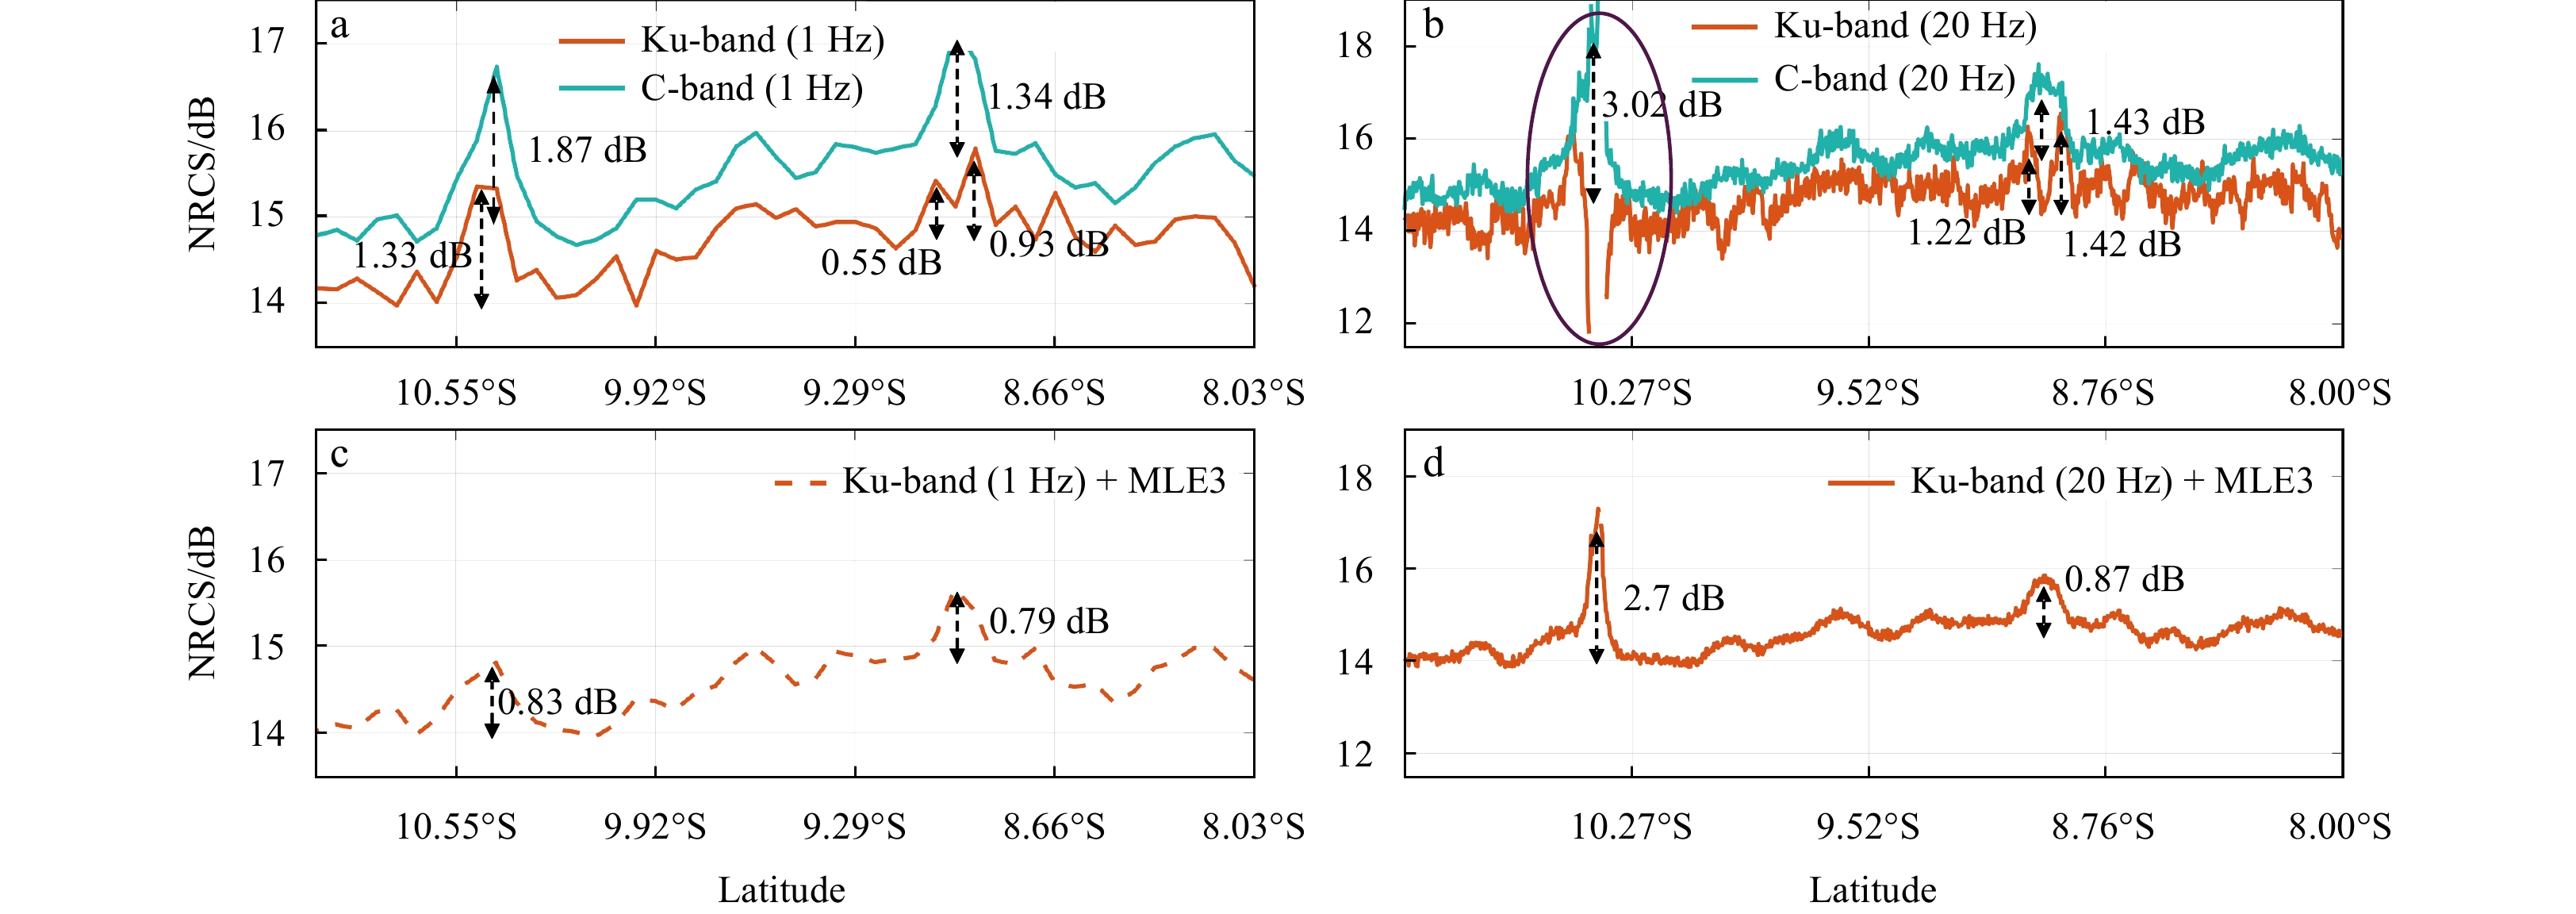
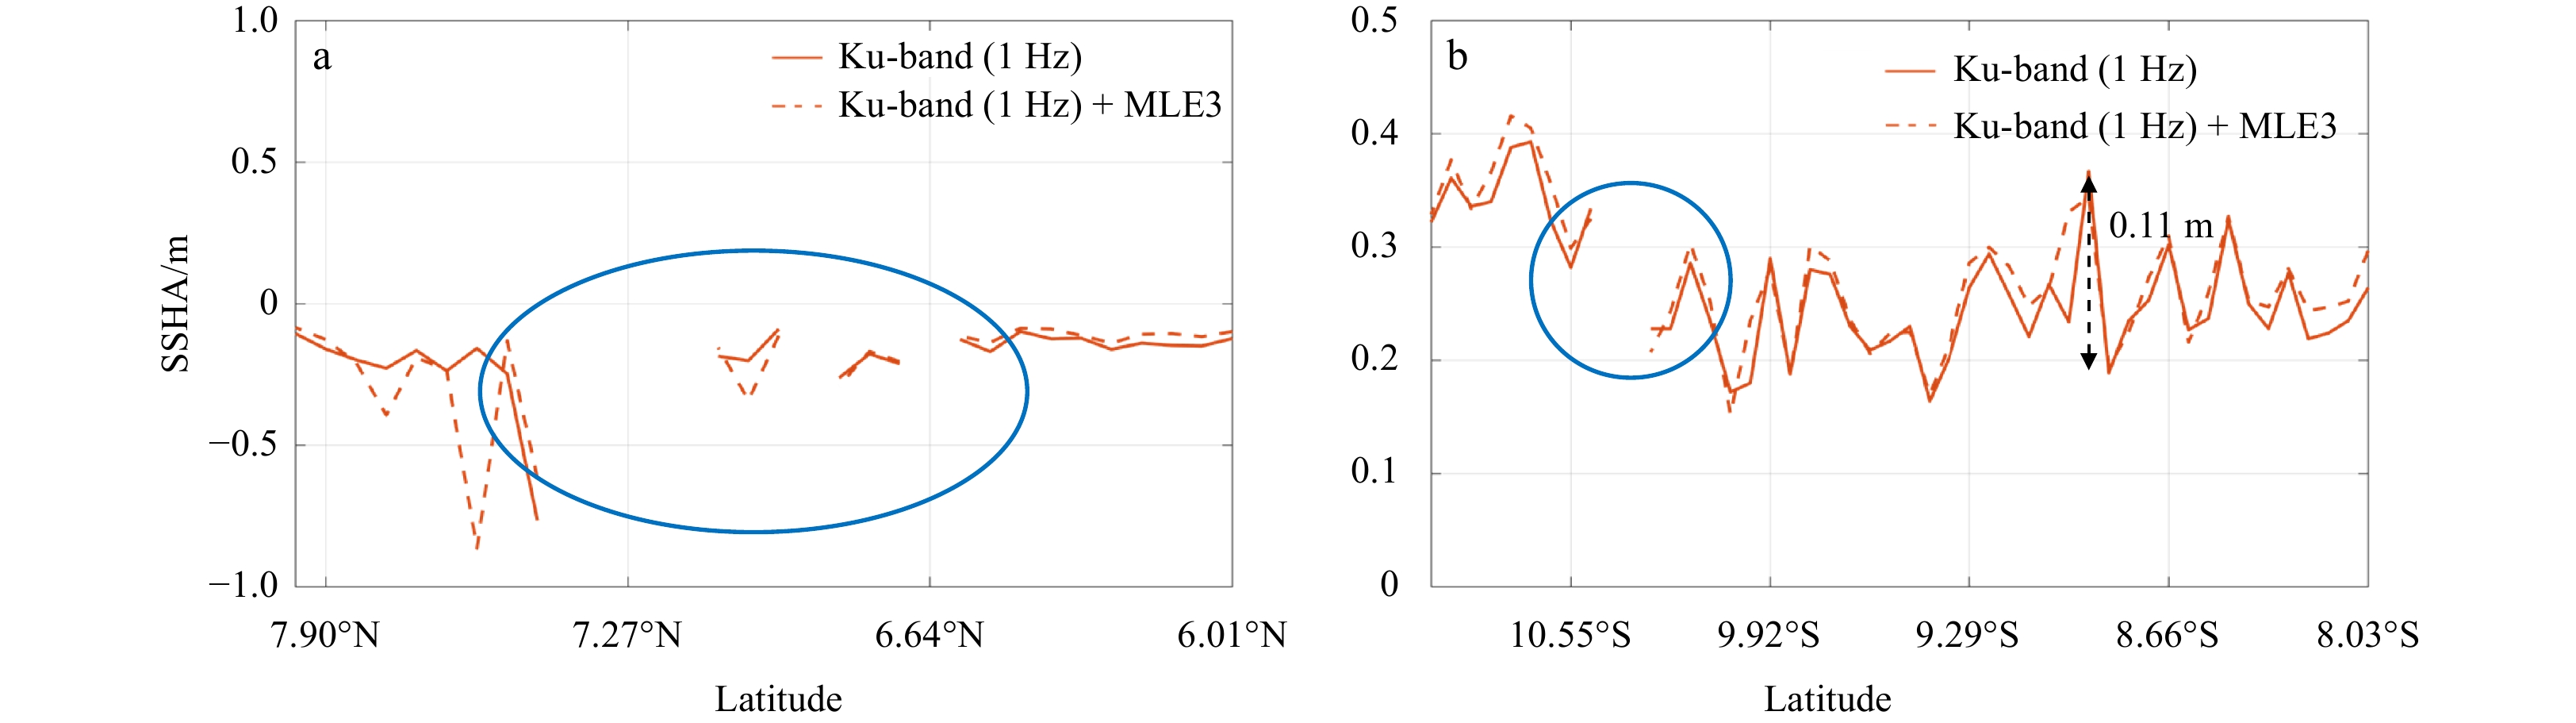
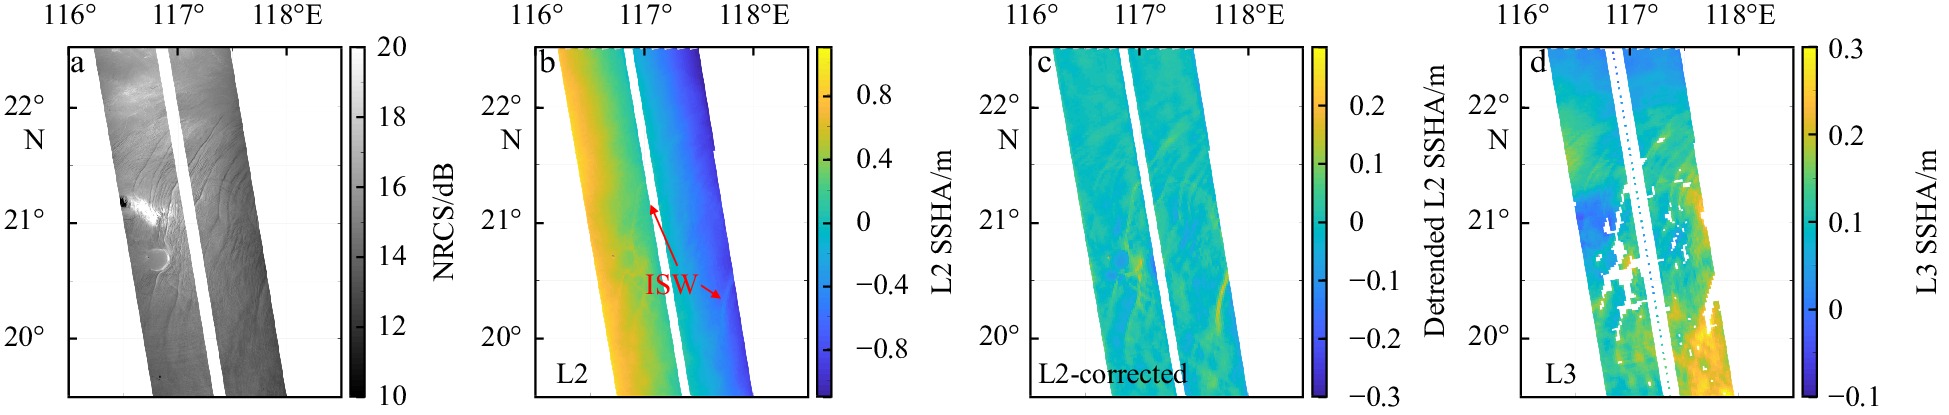
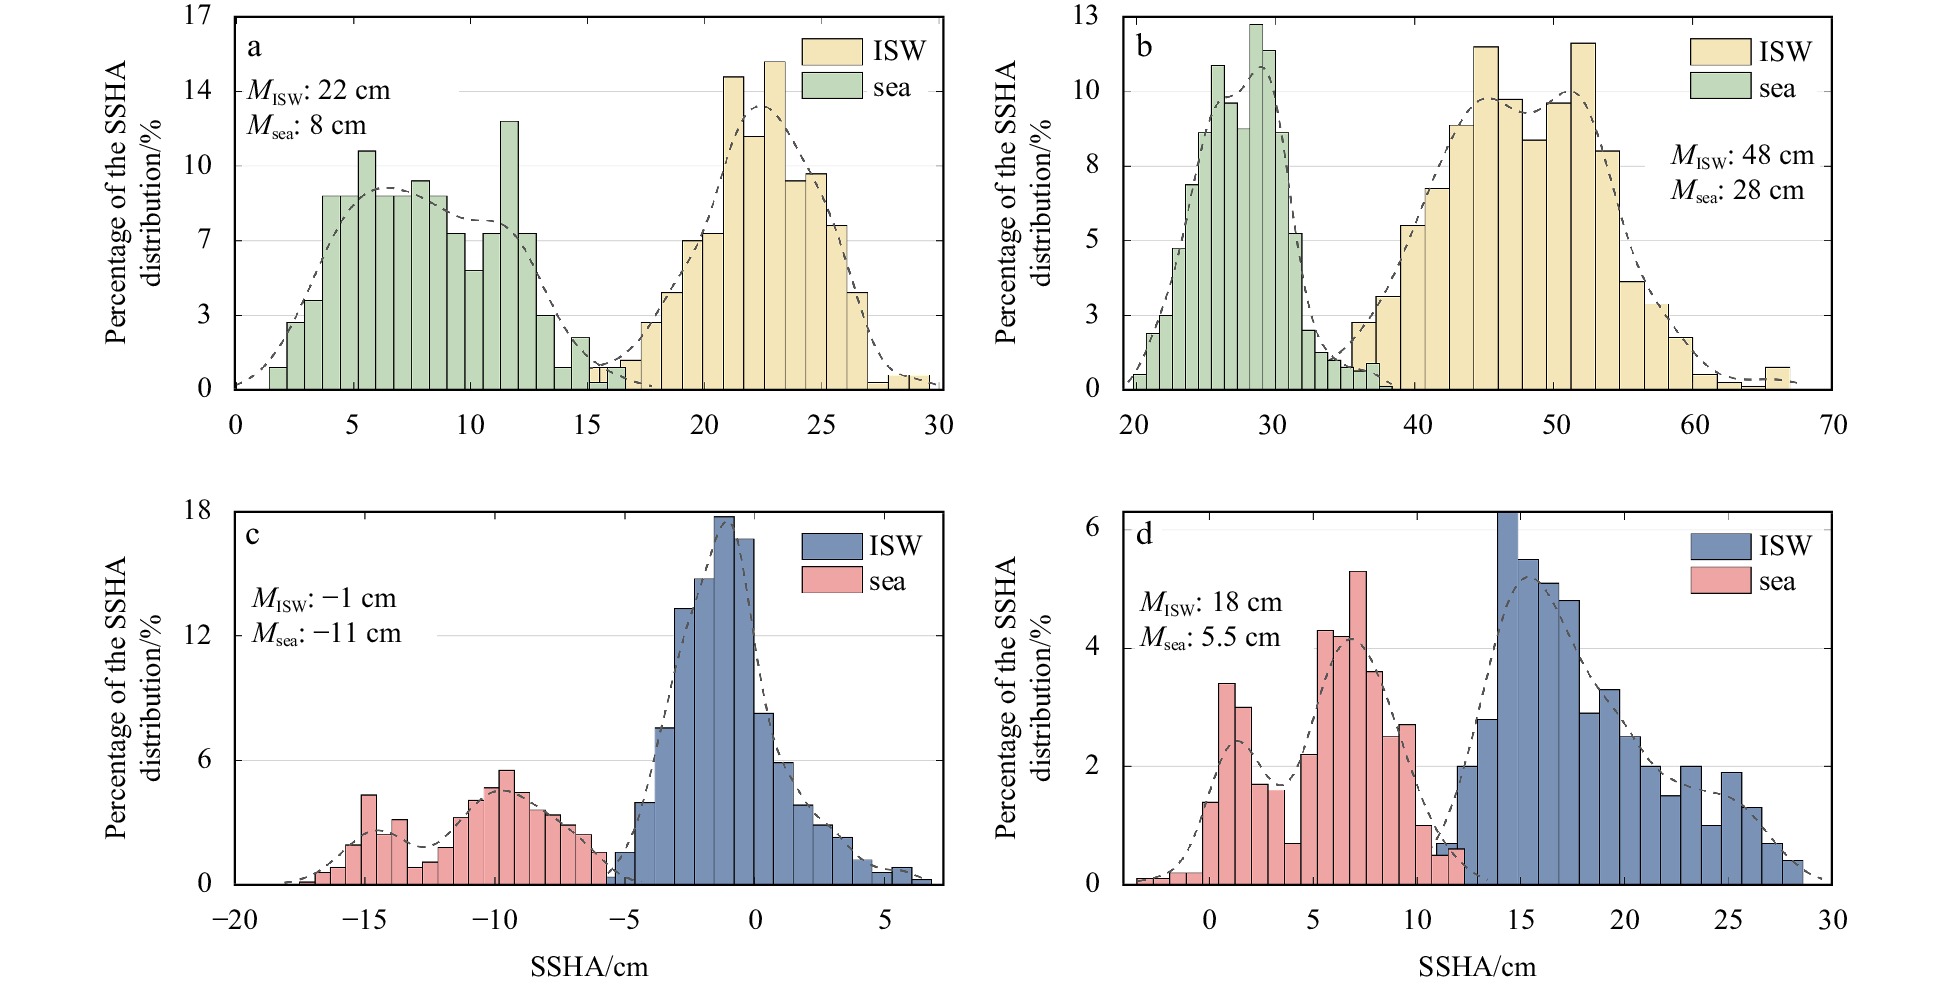
Surface Water and Ocean Topography (SWOT) is a next-generation radar altimeter that offers high resolution, wide swath, imaging capabilities. It has provided free public data worldwide since December 2023. This paper aims to preliminarily analyze the detection capabilities of the Ka-band radar interferometer (KaRIn) and Nadir altimeter (NALT), which are carried out by SWOT for internal solitary waves (ISWs), and to gather other remote sensing images to validate SWOT observations. KaRIn effectively detects ISW surface features and generates surface height variation maps reflecting the modulations induced by ISWs. However, its swath width does not completely cover the entire wave packet, and the resolution of L2/L3 level products (about 2 km) cannot be used to identify ISWs with smaller wavelengths. Additionally, significant wave height (SWH) images exhibit blocky structures that are not suitable for ISW studies; sea surface height anomaly (SSHA) images display systematic left-right banding. We optimize this imbalance using detrending methods; however, more precise treatment should commence with L1-level data. Quantitative analysis based on L3-level SSHA data indicates that the average SSHA variation induced by ISWs ranges from 10 cm to 20 cm. NALTs disturbed by ISWs record unusually elevated SWH and SSHA values, rendering the data unsuitable for analysis and necessitating targeted corrections in future retracking algorithms. For the normalized radar cross section, Ku-band and four-parameter maximum likelihood estimation retracking demonstrated greater sensitivity to minor changes in the sea surface, making them more suitable for ISW detection. In conclusion, SWOT demonstrates outstanding capabilities in ISW detection, significantly advancing research on the modulation of the sea surface by ISWs and remote sensing imaging mechanisms.
Surface Water and Ocean Topography (SWOT) is a next-generation radar altimeter that offers high resolution, wide swath, imaging capabilities. It has provided free public data worldwide since December 2023. This paper aims to preliminarily analyze the detection capabilities of the Ka-band radar interferometer (KaRIn) and Nadir altimeter (NALT), which are carried out by SWOT for internal solitary waves (ISWs), and to gather other remote sensing images to validate SWOT observations. KaRIn effectively detects ISW surface features and generates surface height variation maps reflecting the modulations induced by ISWs. However, its swath width does not completely cover the entire wave packet, and the resolution of L2/L3 level products (about 2 km) cannot be used to identify ISWs with smaller wavelengths. Additionally, significant wave height (SWH) images exhibit blocky structures that are not suitable for ISW studies; sea surface height anomaly (SSHA) images display systematic left-right banding. We optimize this imbalance using detrending methods; however, more precise treatment should commence with L1-level data. Quantitative analysis based on L3-level SSHA data indicates that the average SSHA variation induced by ISWs ranges from 10 cm to 20 cm. NALTs disturbed by ISWs record unusually elevated SWH and SSHA values, rendering the data unsuitable for analysis and necessitating targeted corrections in future retracking algorithms. For the normalized radar cross section, Ku-band and four-parameter maximum likelihood estimation retracking demonstrated greater sensitivity to minor changes in the sea surface, making them more suitable for ISW detection. In conclusion, SWOT demonstrates outstanding capabilities in ISW detection, significantly advancing research on the modulation of the sea surface by ISWs and remote sensing imaging mechanisms.


2024, 43(5): 65-77.
doi: 10.1007/s13131-024-2326-7
Abstract:
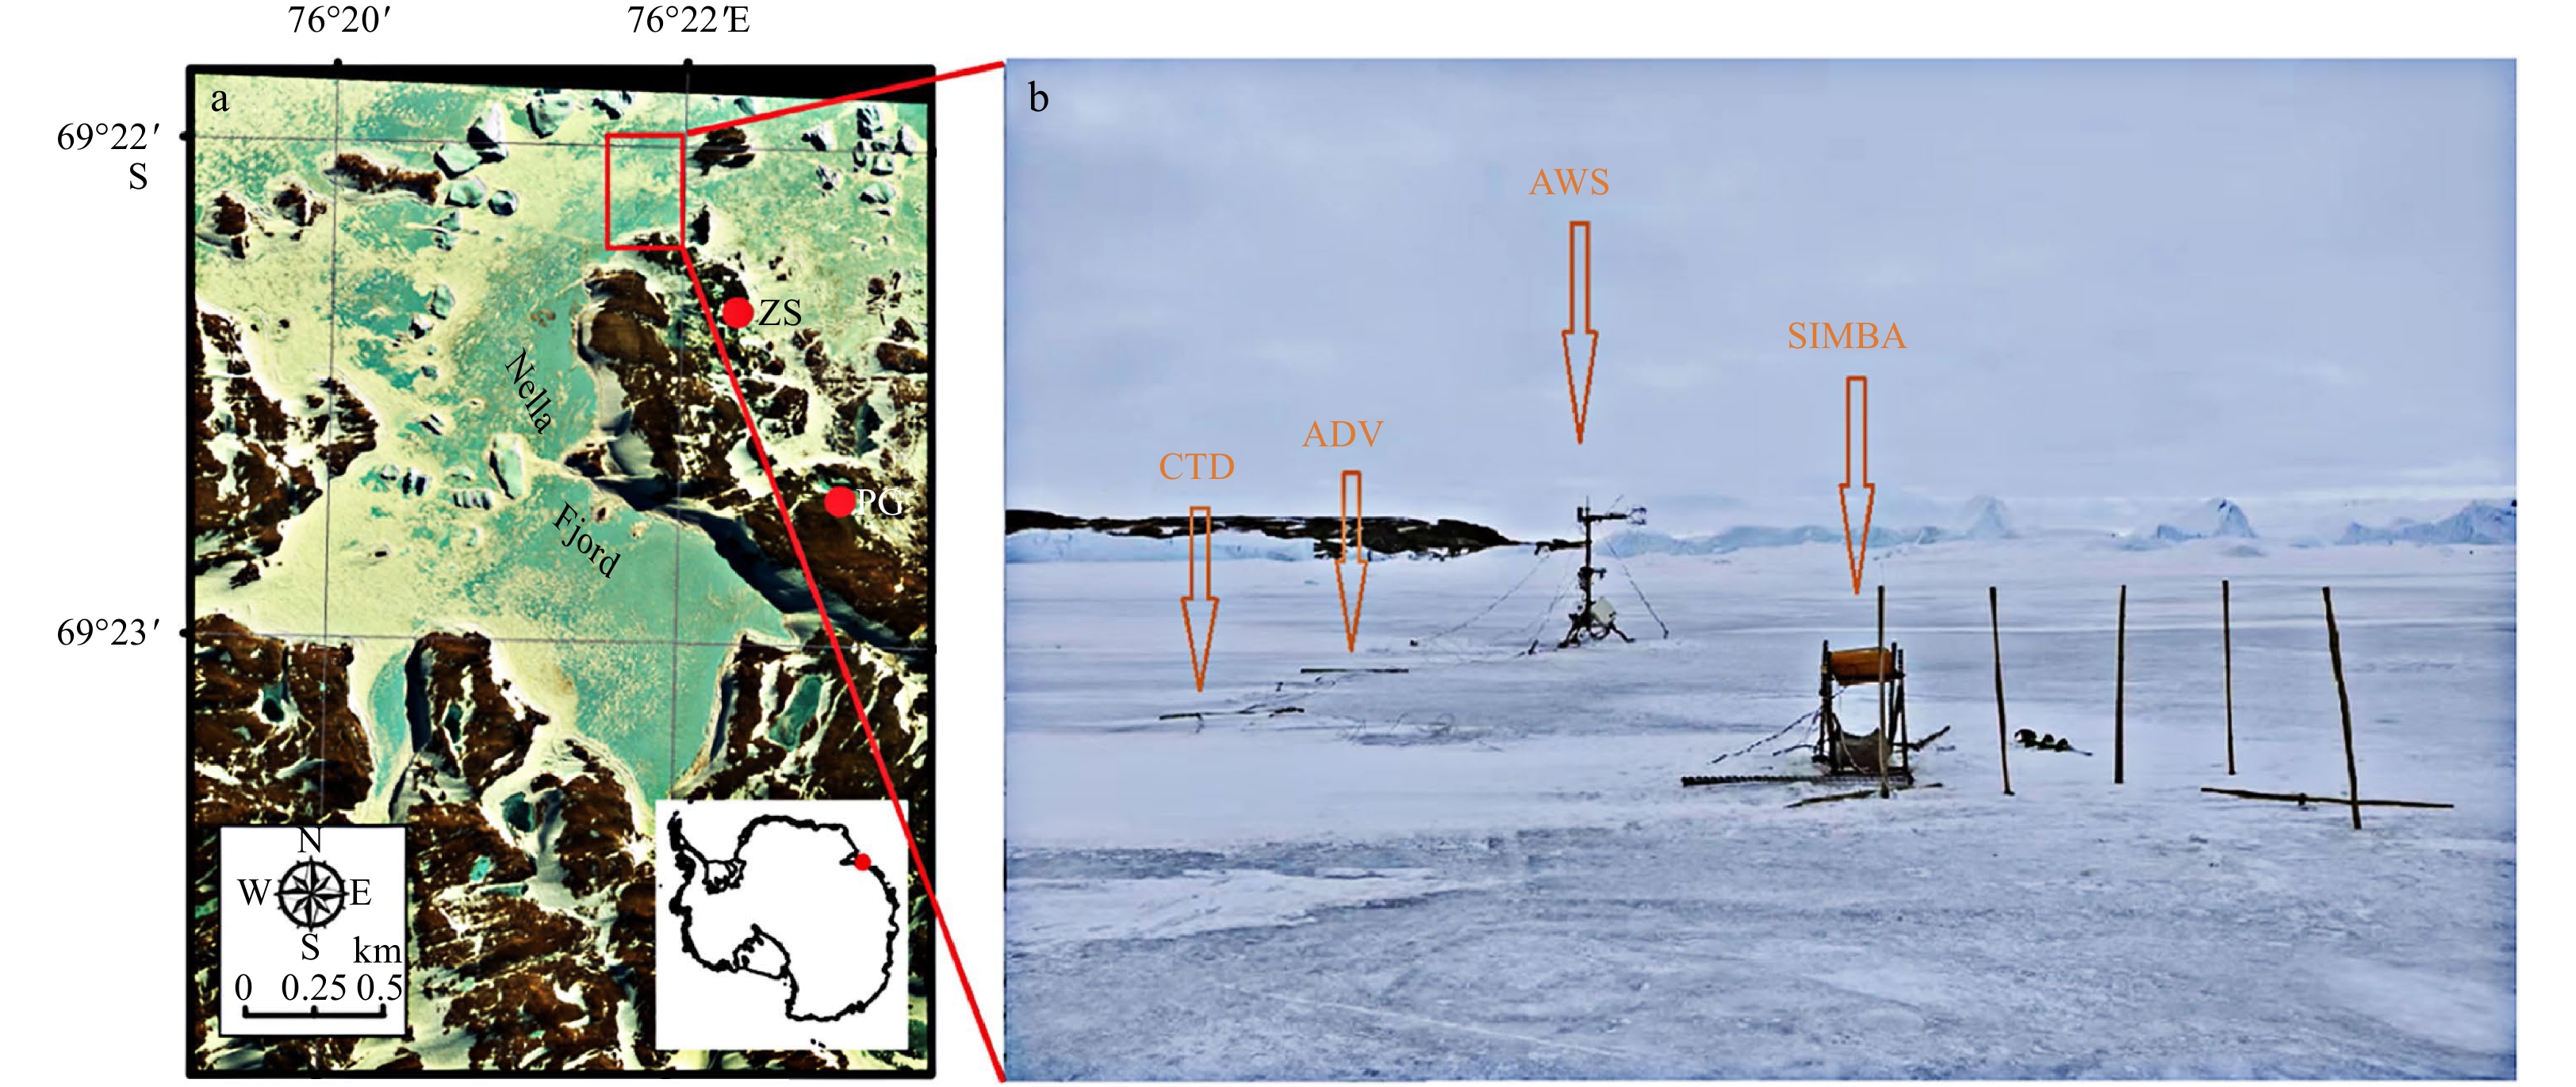
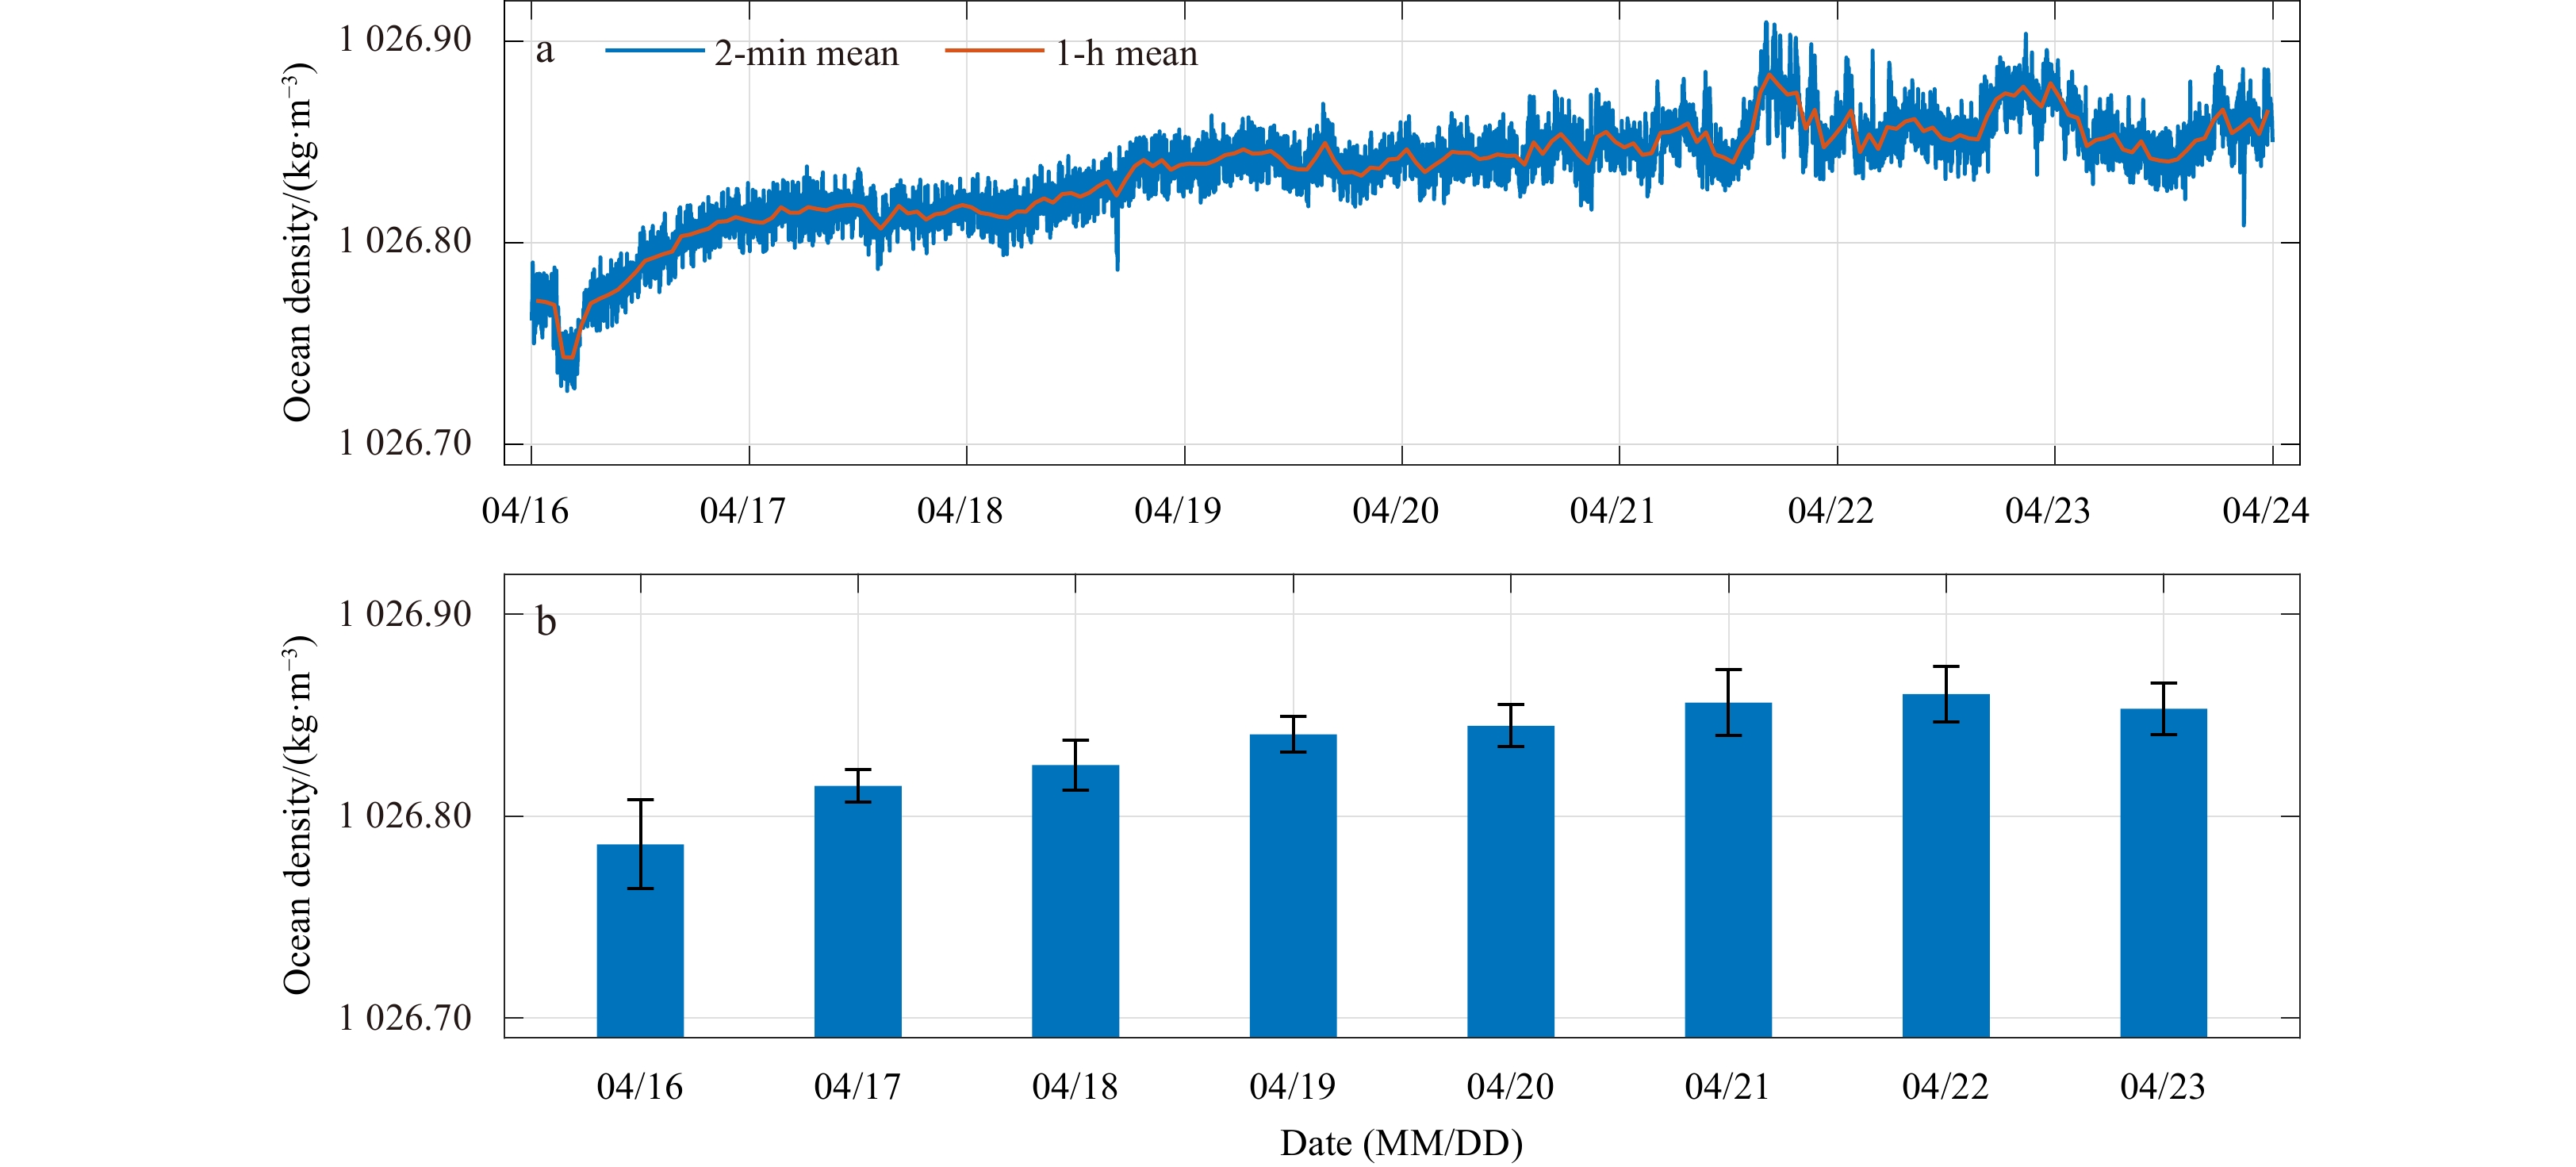
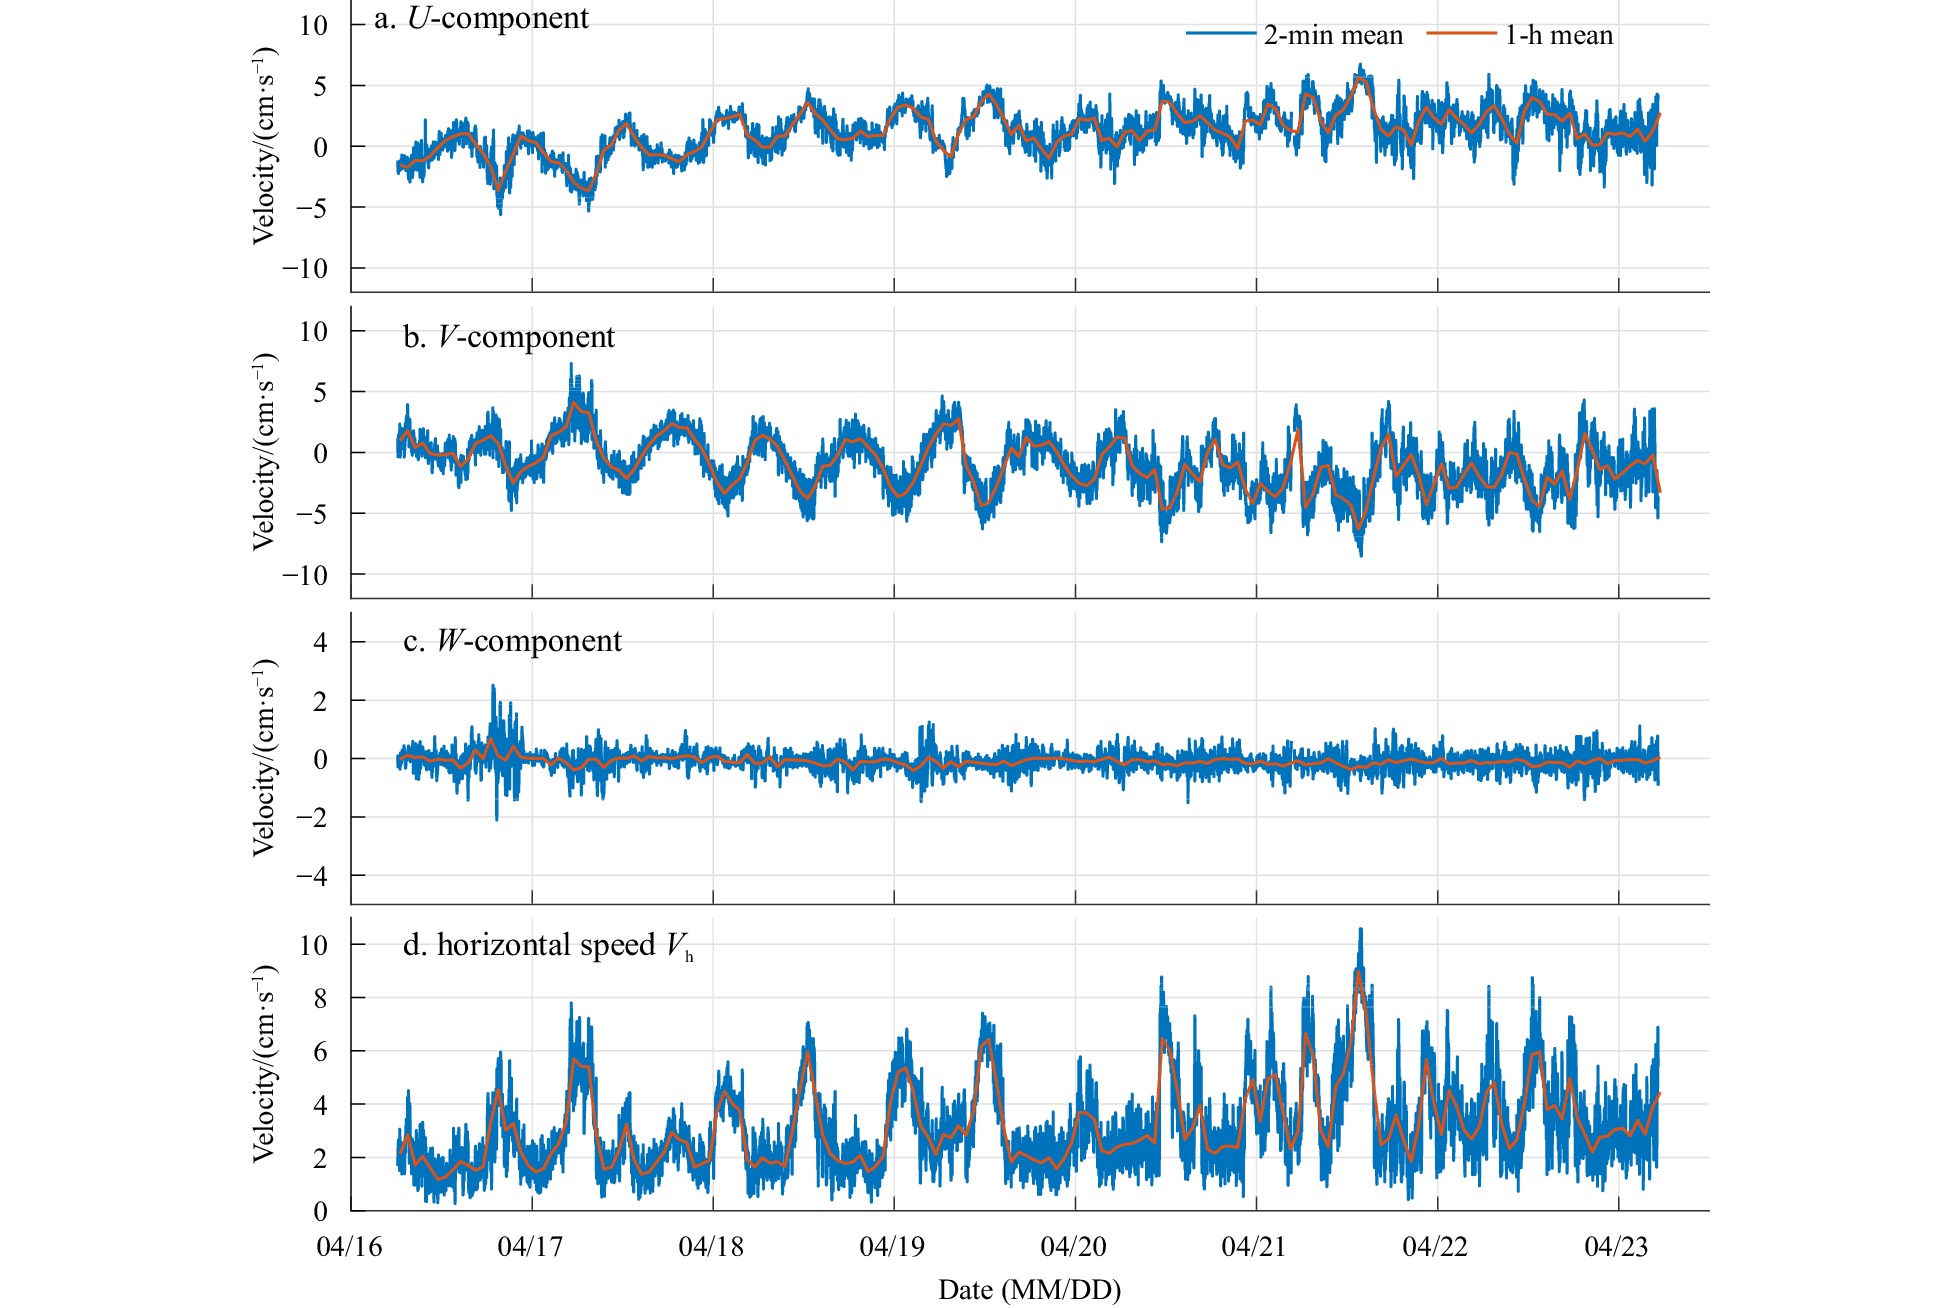
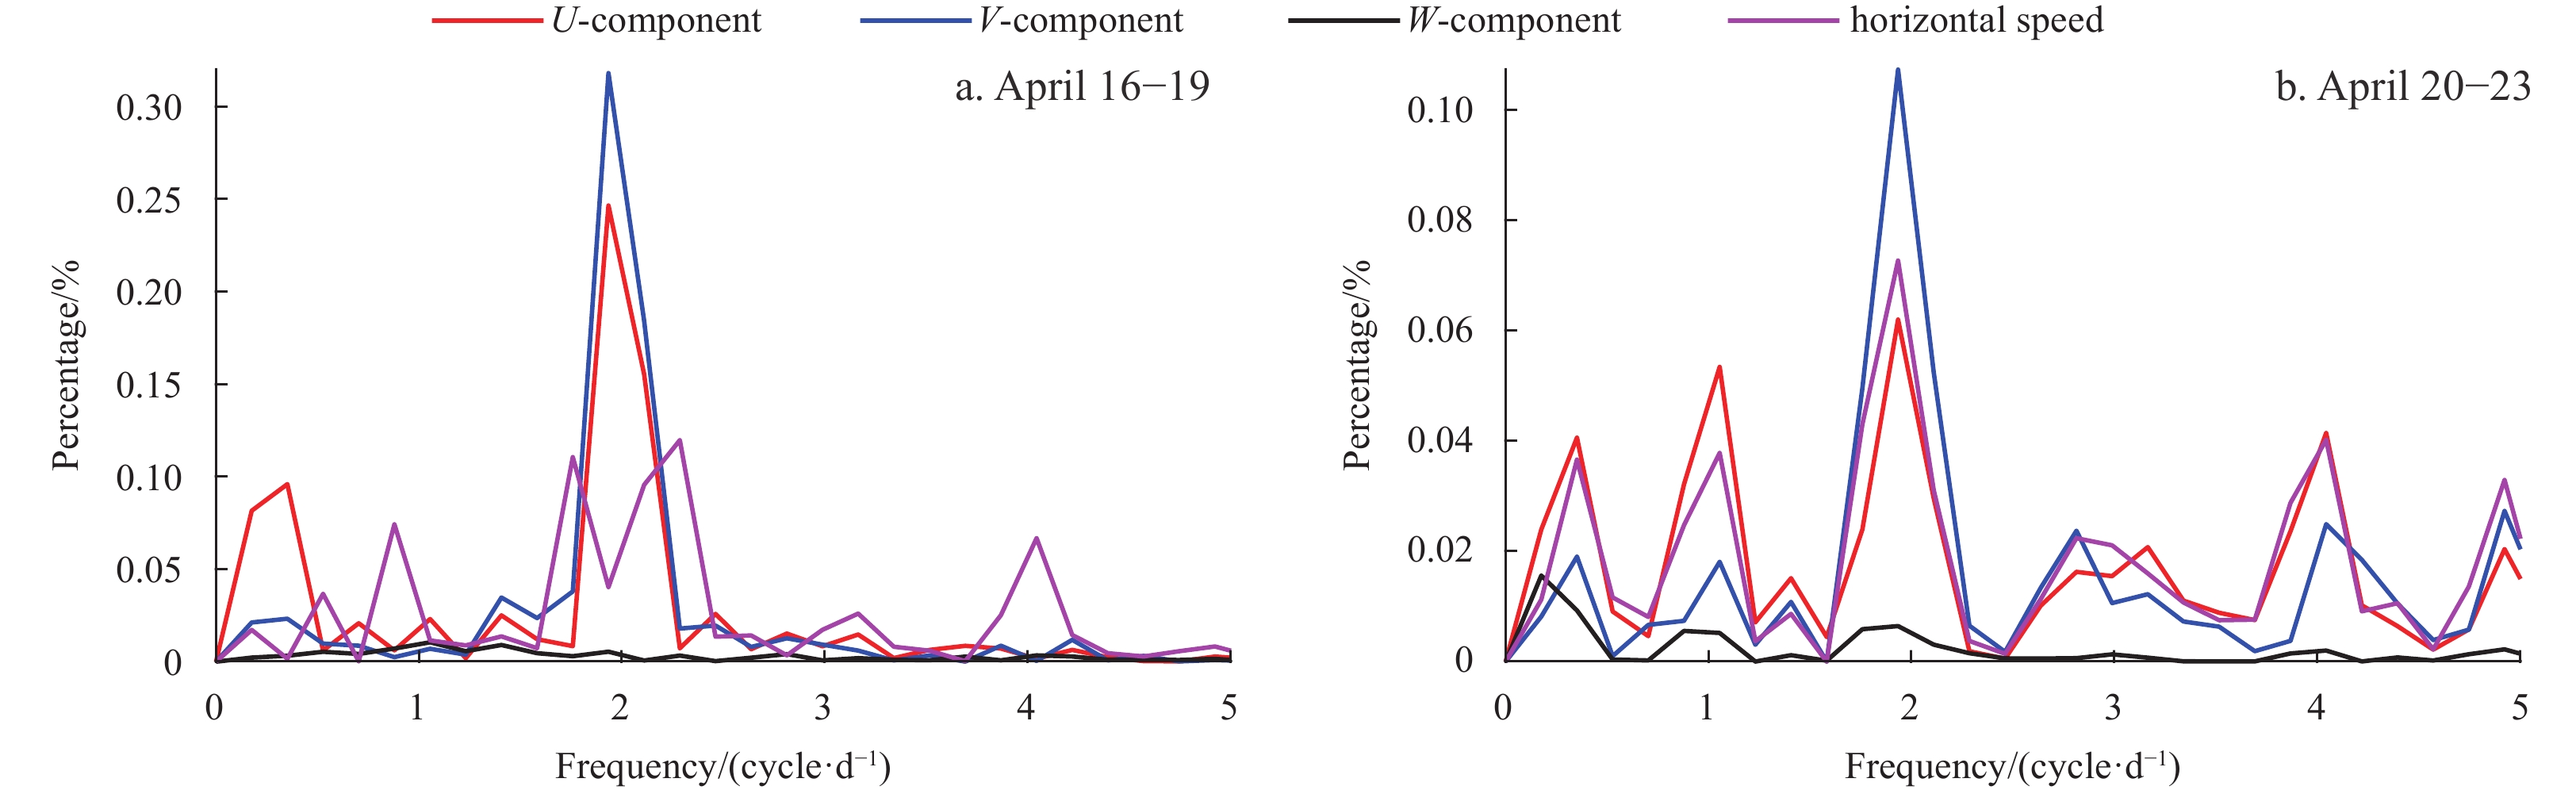
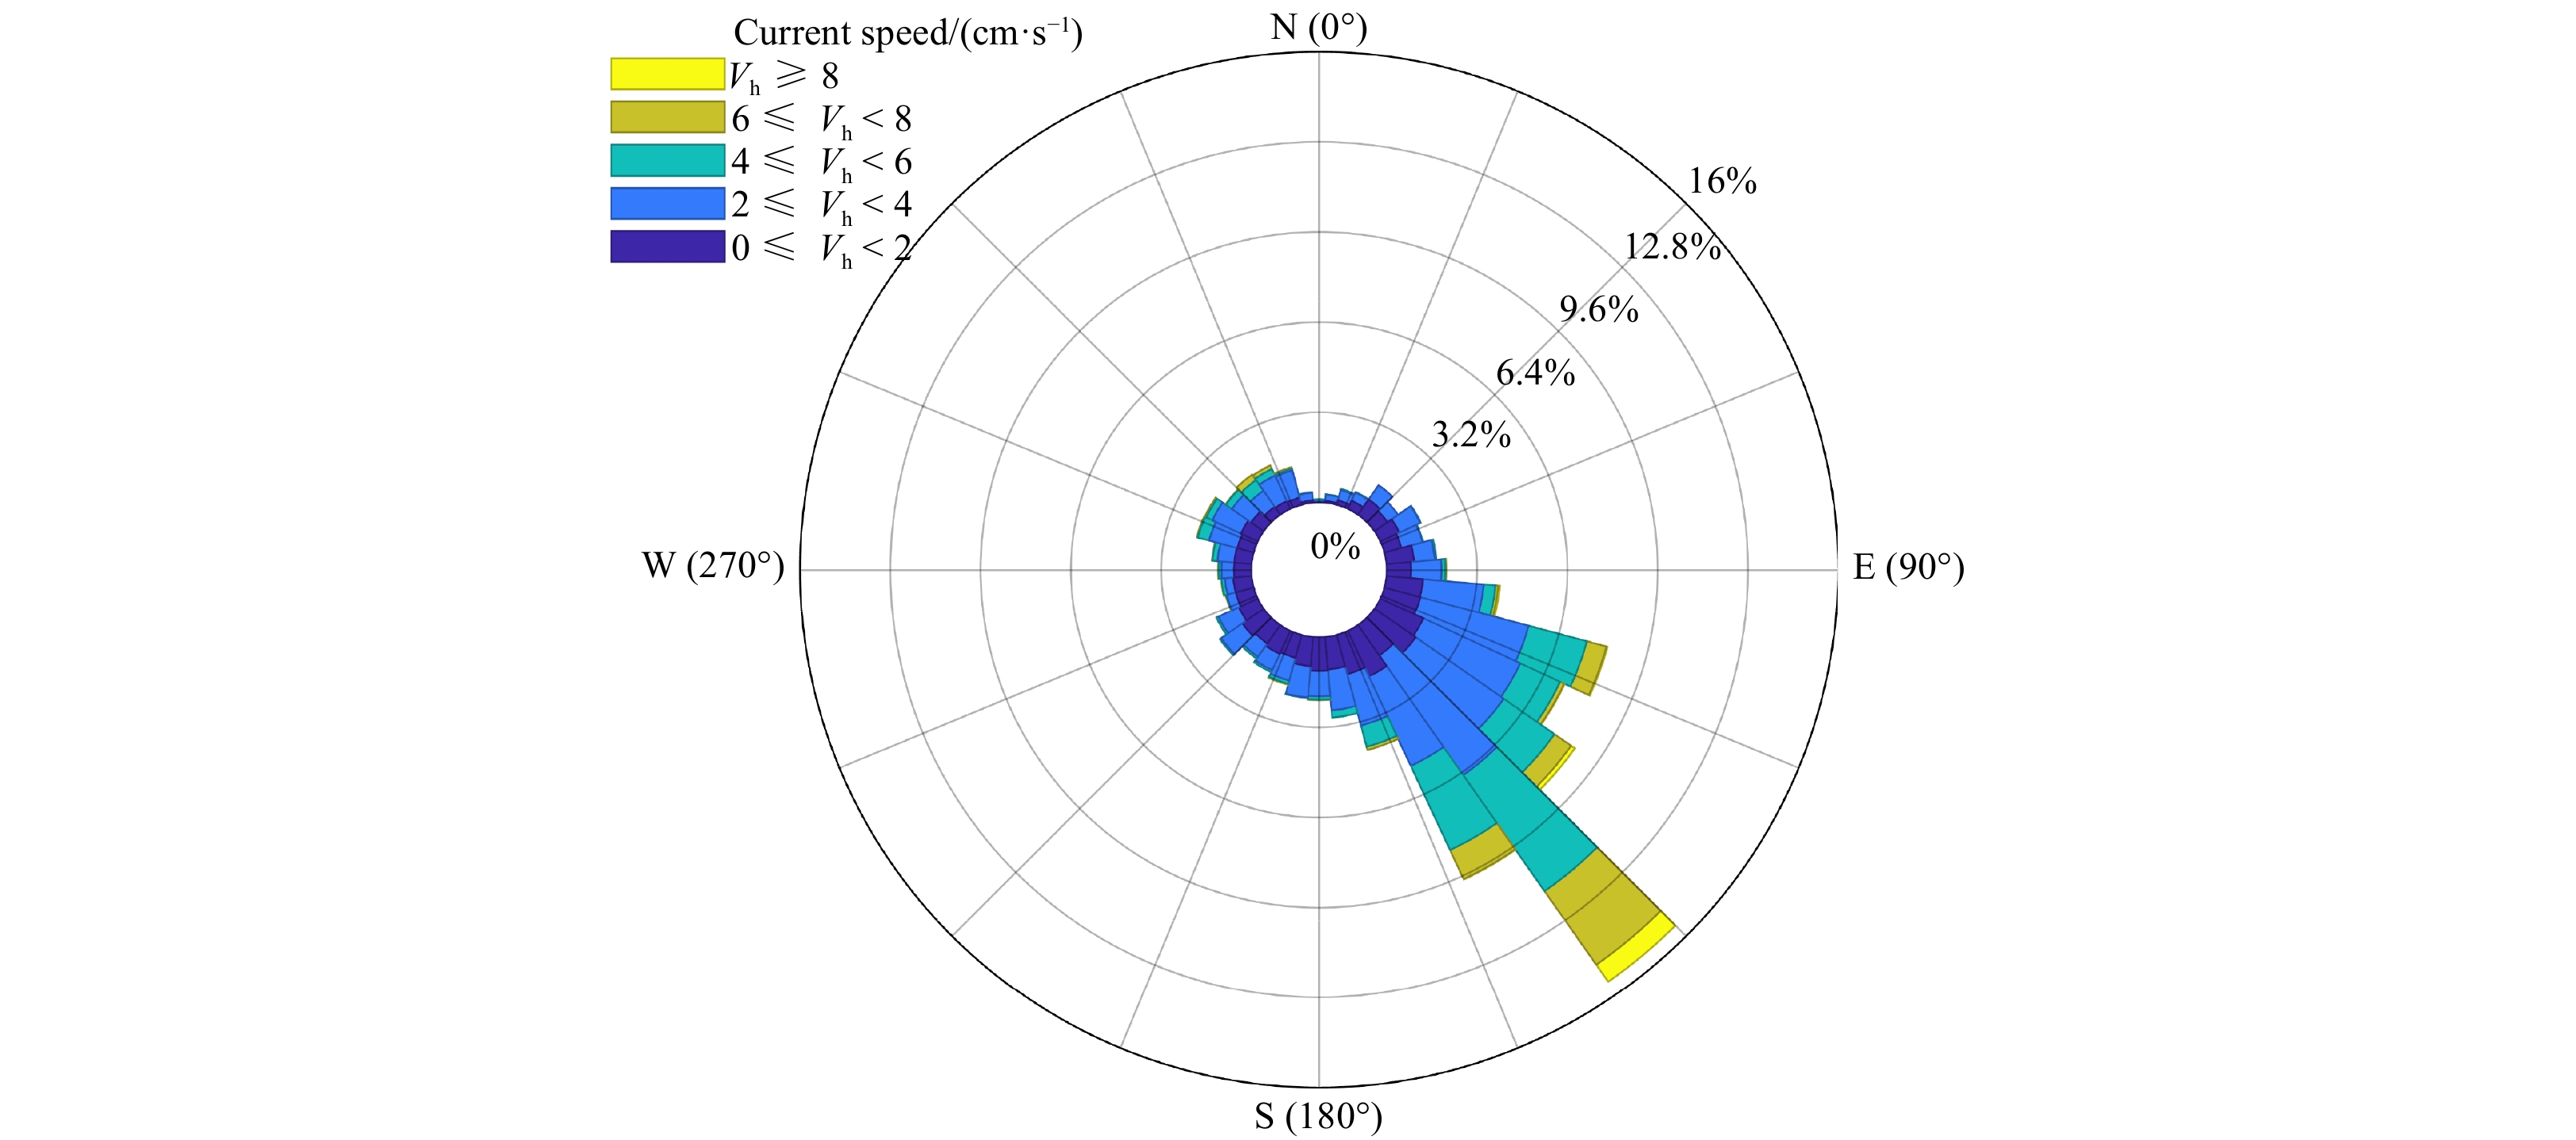
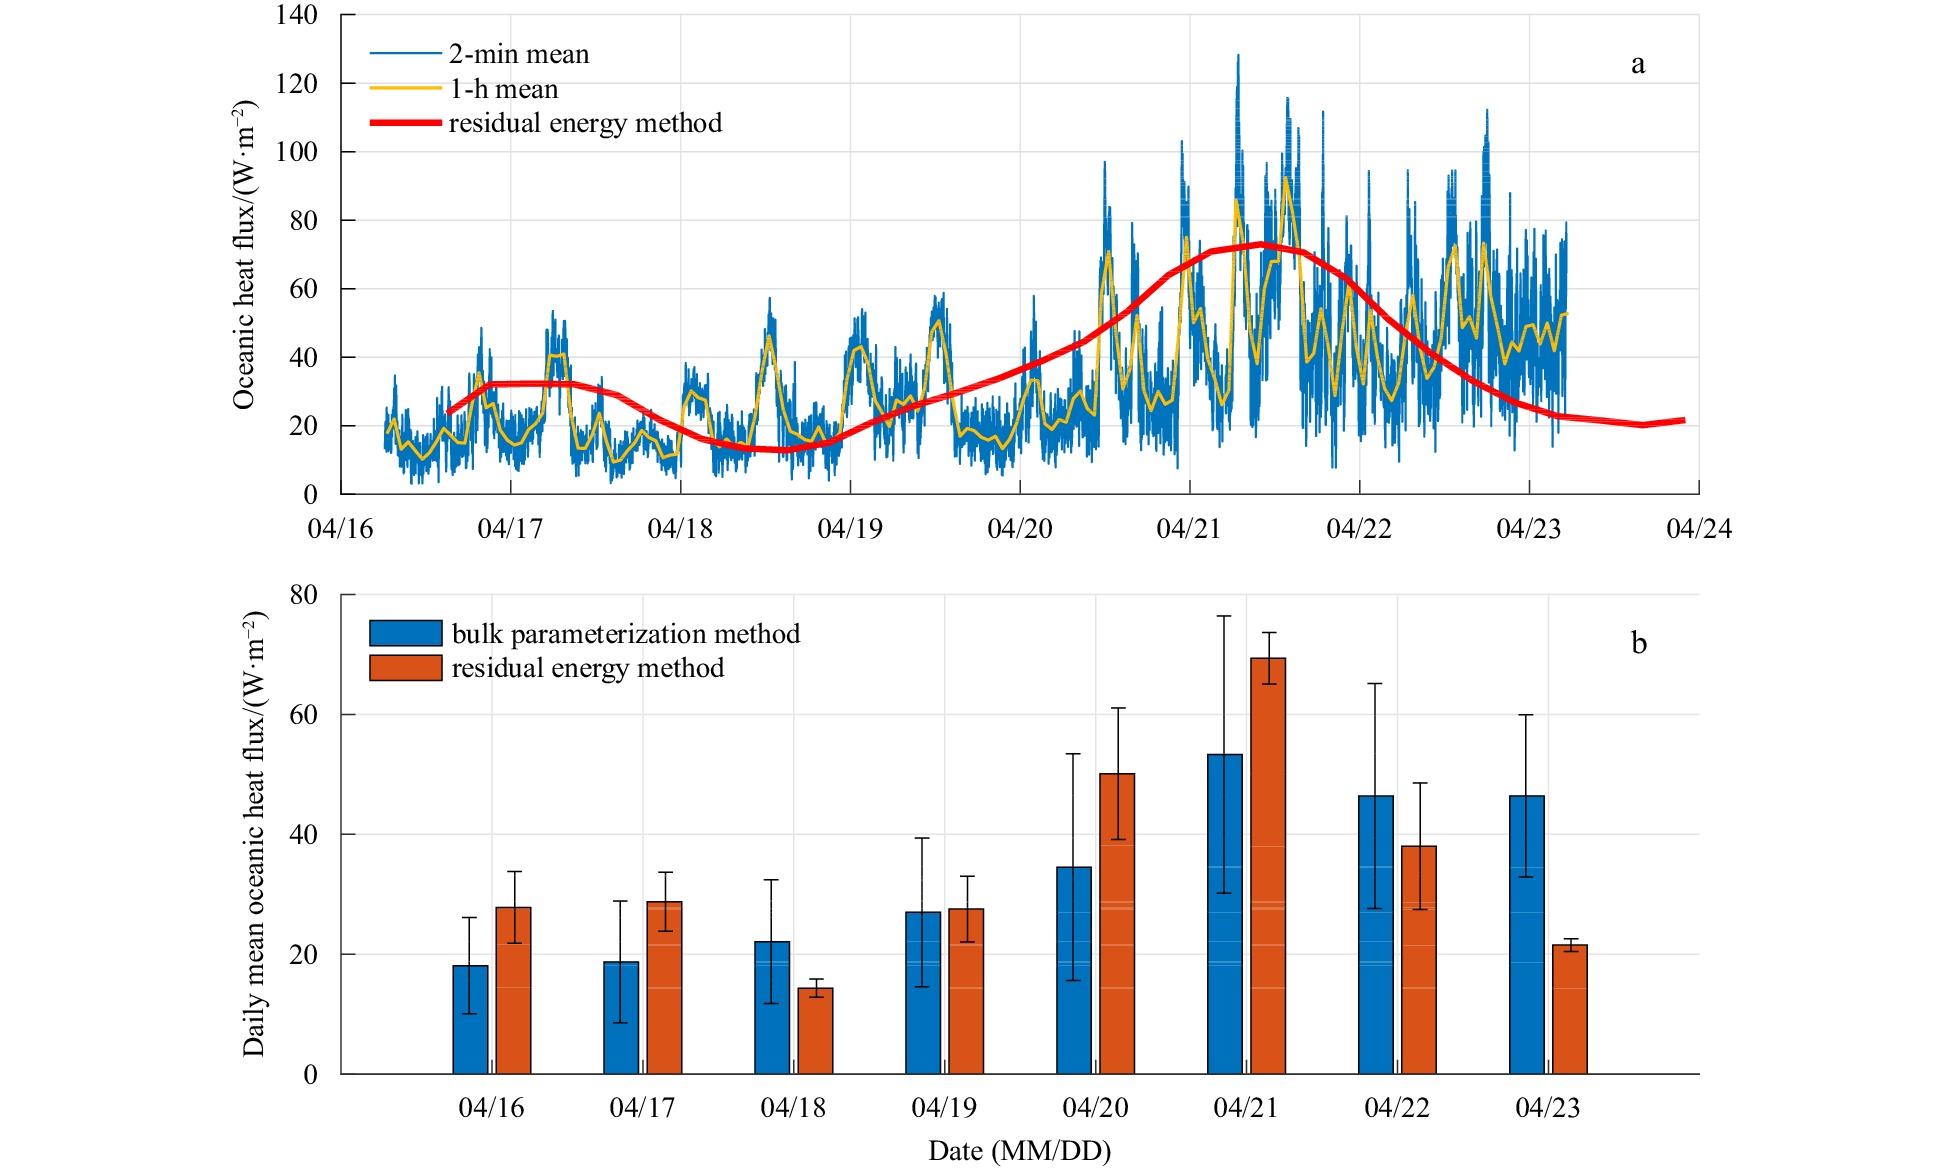
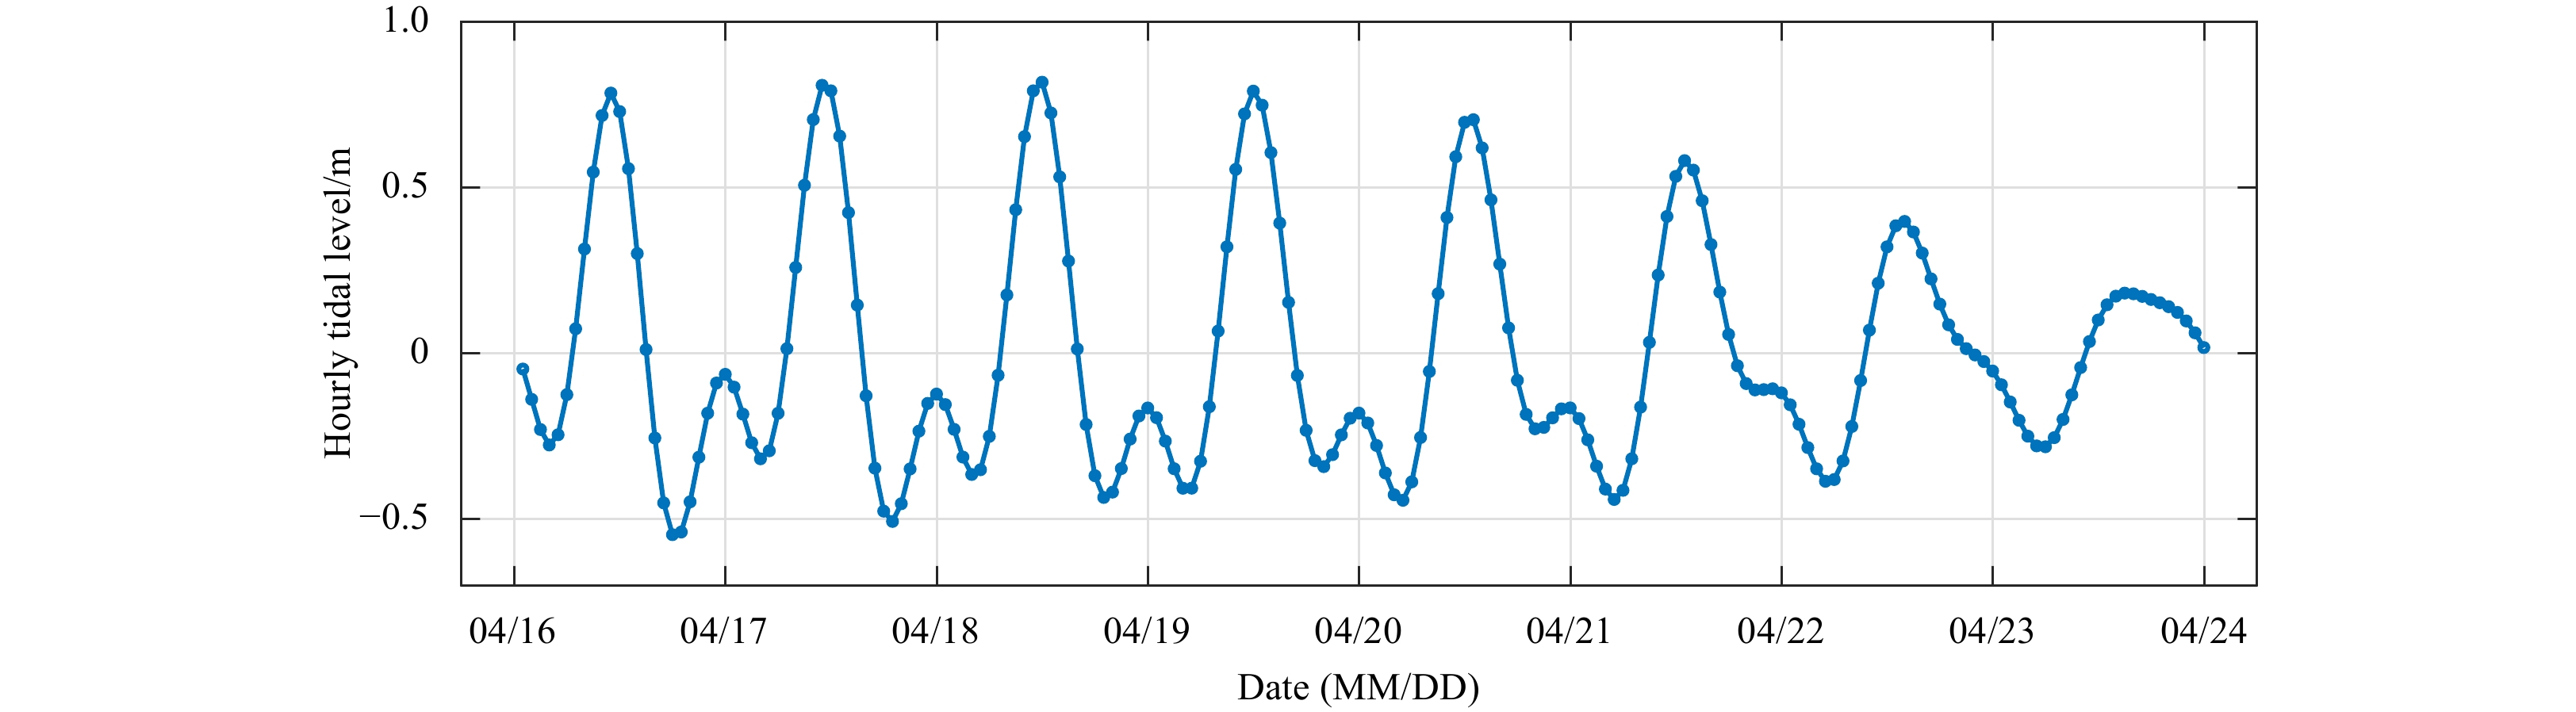
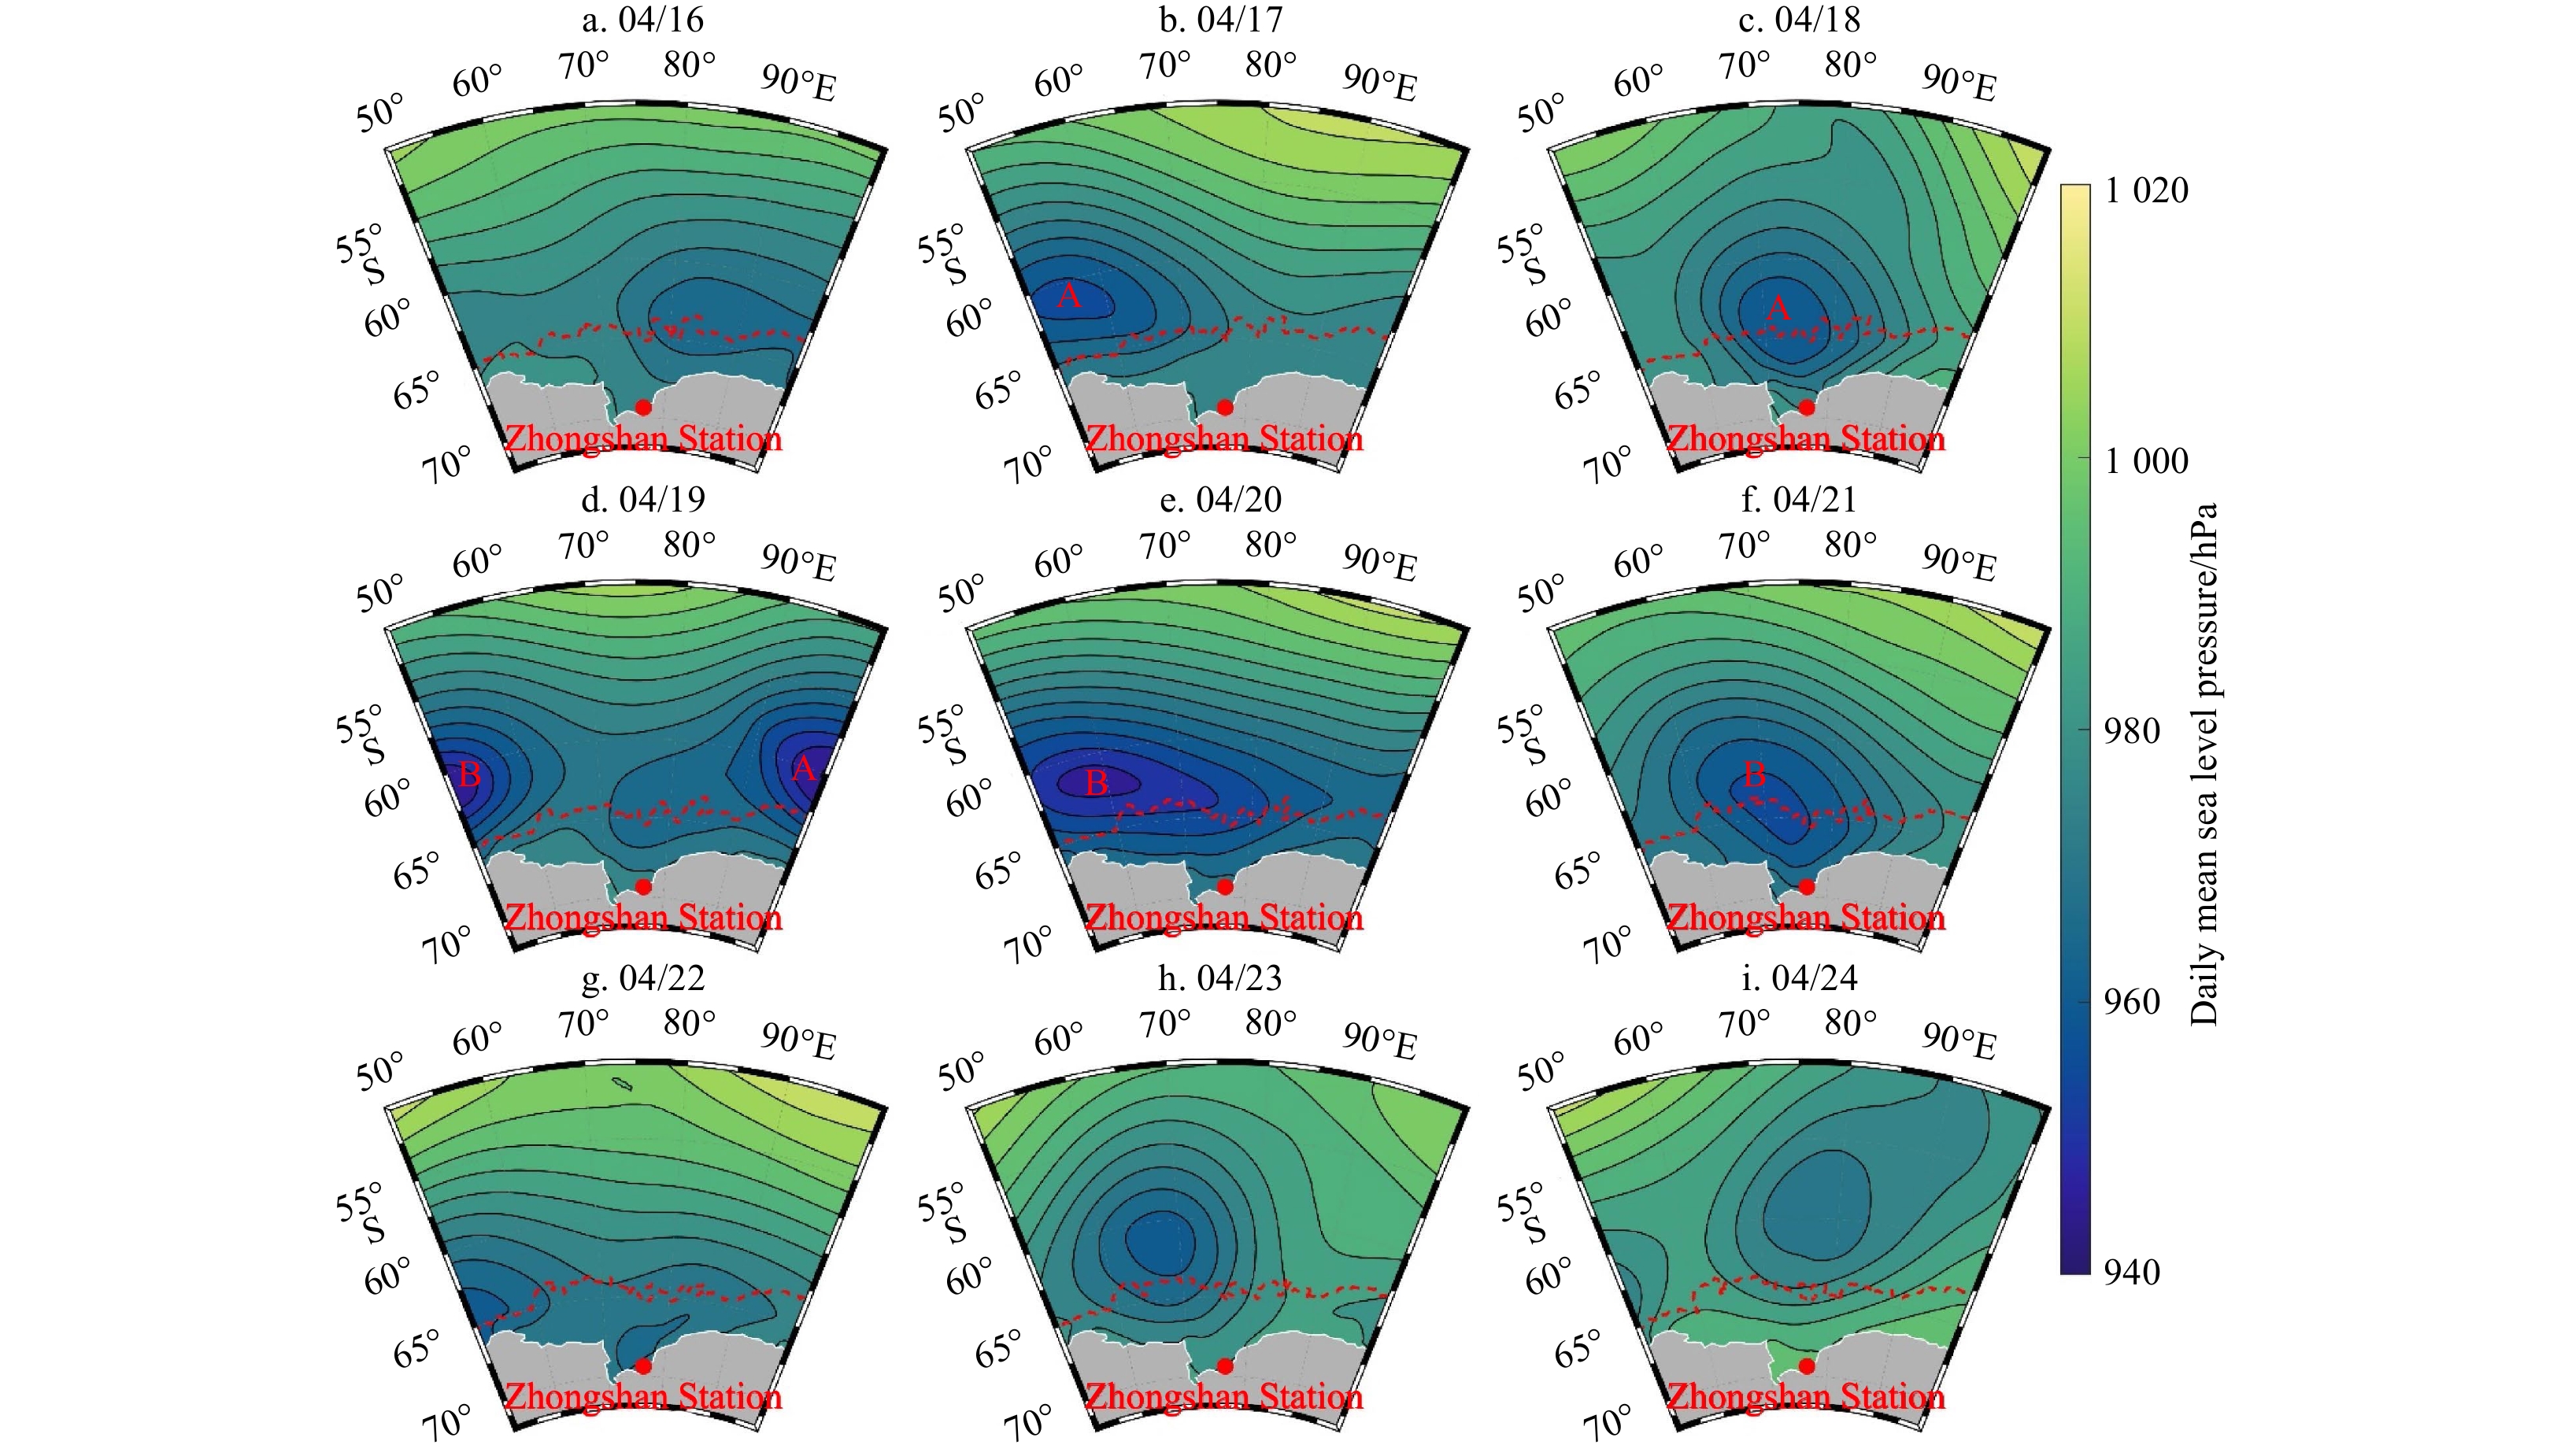
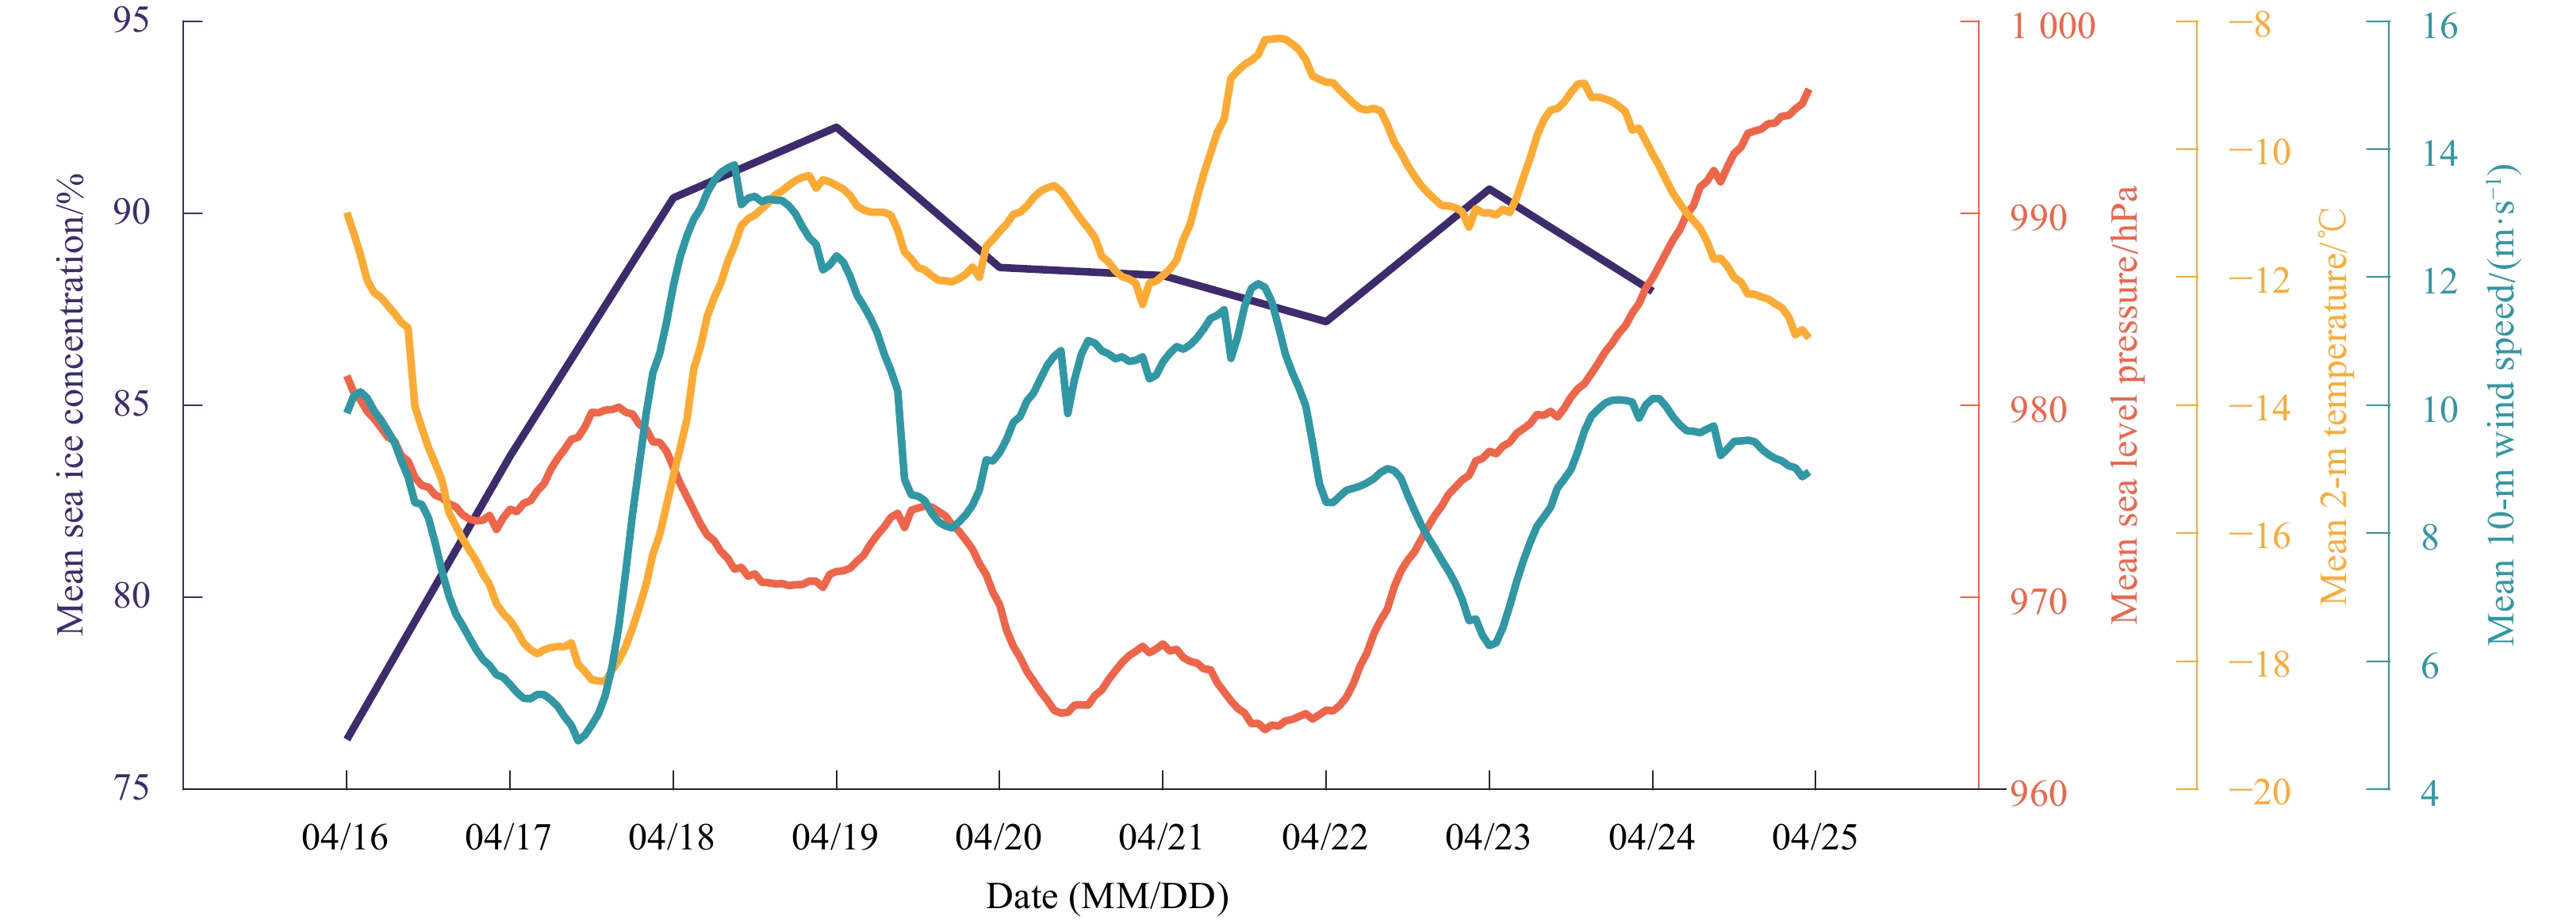
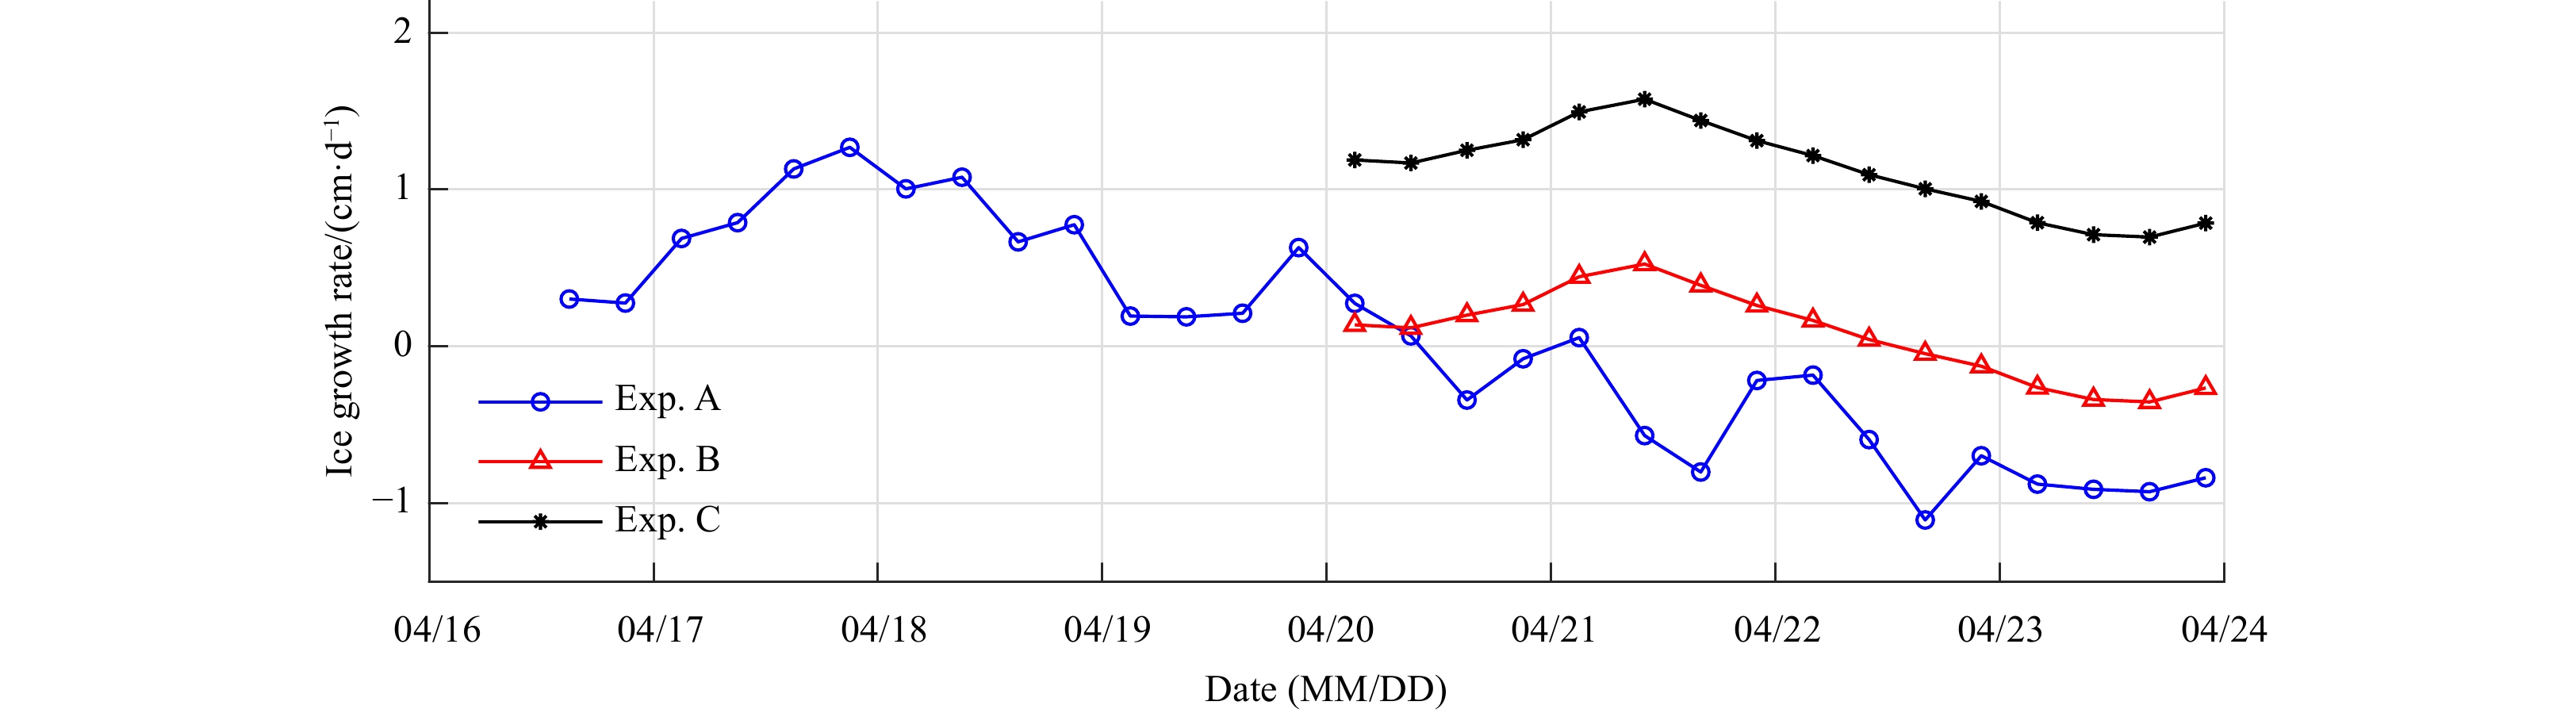
The ocean conditions beneath the ice cover play a key role in understanding the sea ice mass balance in the polar regions. An integrated high-frequency ice-ocean observation system, including Acoustic Doppler Velocimeter, Conductivity-Temperature-Depth Sensor, and Sea Ice Mass Balance Array (SIMBA), was deployed in the landfast ice region close to the Chinese Zhongshan Station in Antarctica. A sudden ocean warming of 0.14℃ (p < 0.01) was observed beneath early-frozen landfast ice, from (−1.60 ± 0.03)℃ during April 16–19 to (−1.46 ± 0.07)℃ during April 20–23, 2021, which is the only significant warming event in the nearly 8-month records. The sudden ocean warming brought a double rise in oceanic heat flux, from (21.7 ± 11.1) W/m2 during April 16–19 to (44.8 ± 21.3) W/m2 during April 20–23, 2021, which shifted the original growth phase at the ice bottom, leading to a 2 cm melting, as shown from SIMBA and borehole observations. Simultaneously, the slowdown of ice bottom freezing decreased salt rejection, and the daily trend of observed ocean salinity changed from +0.02 d−1 during April 16–19, 2021 to +0.003 d−1 during April 20–23, 2021. The potential reasons are increased air temperature due to the transit cyclones and the weakened vertical ocean mixing due to the tide phase transformation from semi-diurnal to diurnal. The high-frequency observations within the ice-ocean boundary layer enhance the comprehensive investigation of the ocean’s influence on ice evolution at a daily scale.
The ocean conditions beneath the ice cover play a key role in understanding the sea ice mass balance in the polar regions. An integrated high-frequency ice-ocean observation system, including Acoustic Doppler Velocimeter, Conductivity-Temperature-Depth Sensor, and Sea Ice Mass Balance Array (SIMBA), was deployed in the landfast ice region close to the Chinese Zhongshan Station in Antarctica. A sudden ocean warming of 0.14℃ (p < 0.01) was observed beneath early-frozen landfast ice, from (−1.60 ± 0.03)℃ during April 16–19 to (−1.46 ± 0.07)℃ during April 20–23, 2021, which is the only significant warming event in the nearly 8-month records. The sudden ocean warming brought a double rise in oceanic heat flux, from (21.7 ± 11.1) W/m2 during April 16–19 to (44.8 ± 21.3) W/m2 during April 20–23, 2021, which shifted the original growth phase at the ice bottom, leading to a 2 cm melting, as shown from SIMBA and borehole observations. Simultaneously, the slowdown of ice bottom freezing decreased salt rejection, and the daily trend of observed ocean salinity changed from +0.02 d−1 during April 16–19, 2021 to +0.003 d−1 during April 20–23, 2021. The potential reasons are increased air temperature due to the transit cyclones and the weakened vertical ocean mixing due to the tide phase transformation from semi-diurnal to diurnal. The high-frequency observations within the ice-ocean boundary layer enhance the comprehensive investigation of the ocean’s influence on ice evolution at a daily scale.


2024, 43(5): 78-90.
doi: 10.1007/s13131-023-2248-9
Abstract:
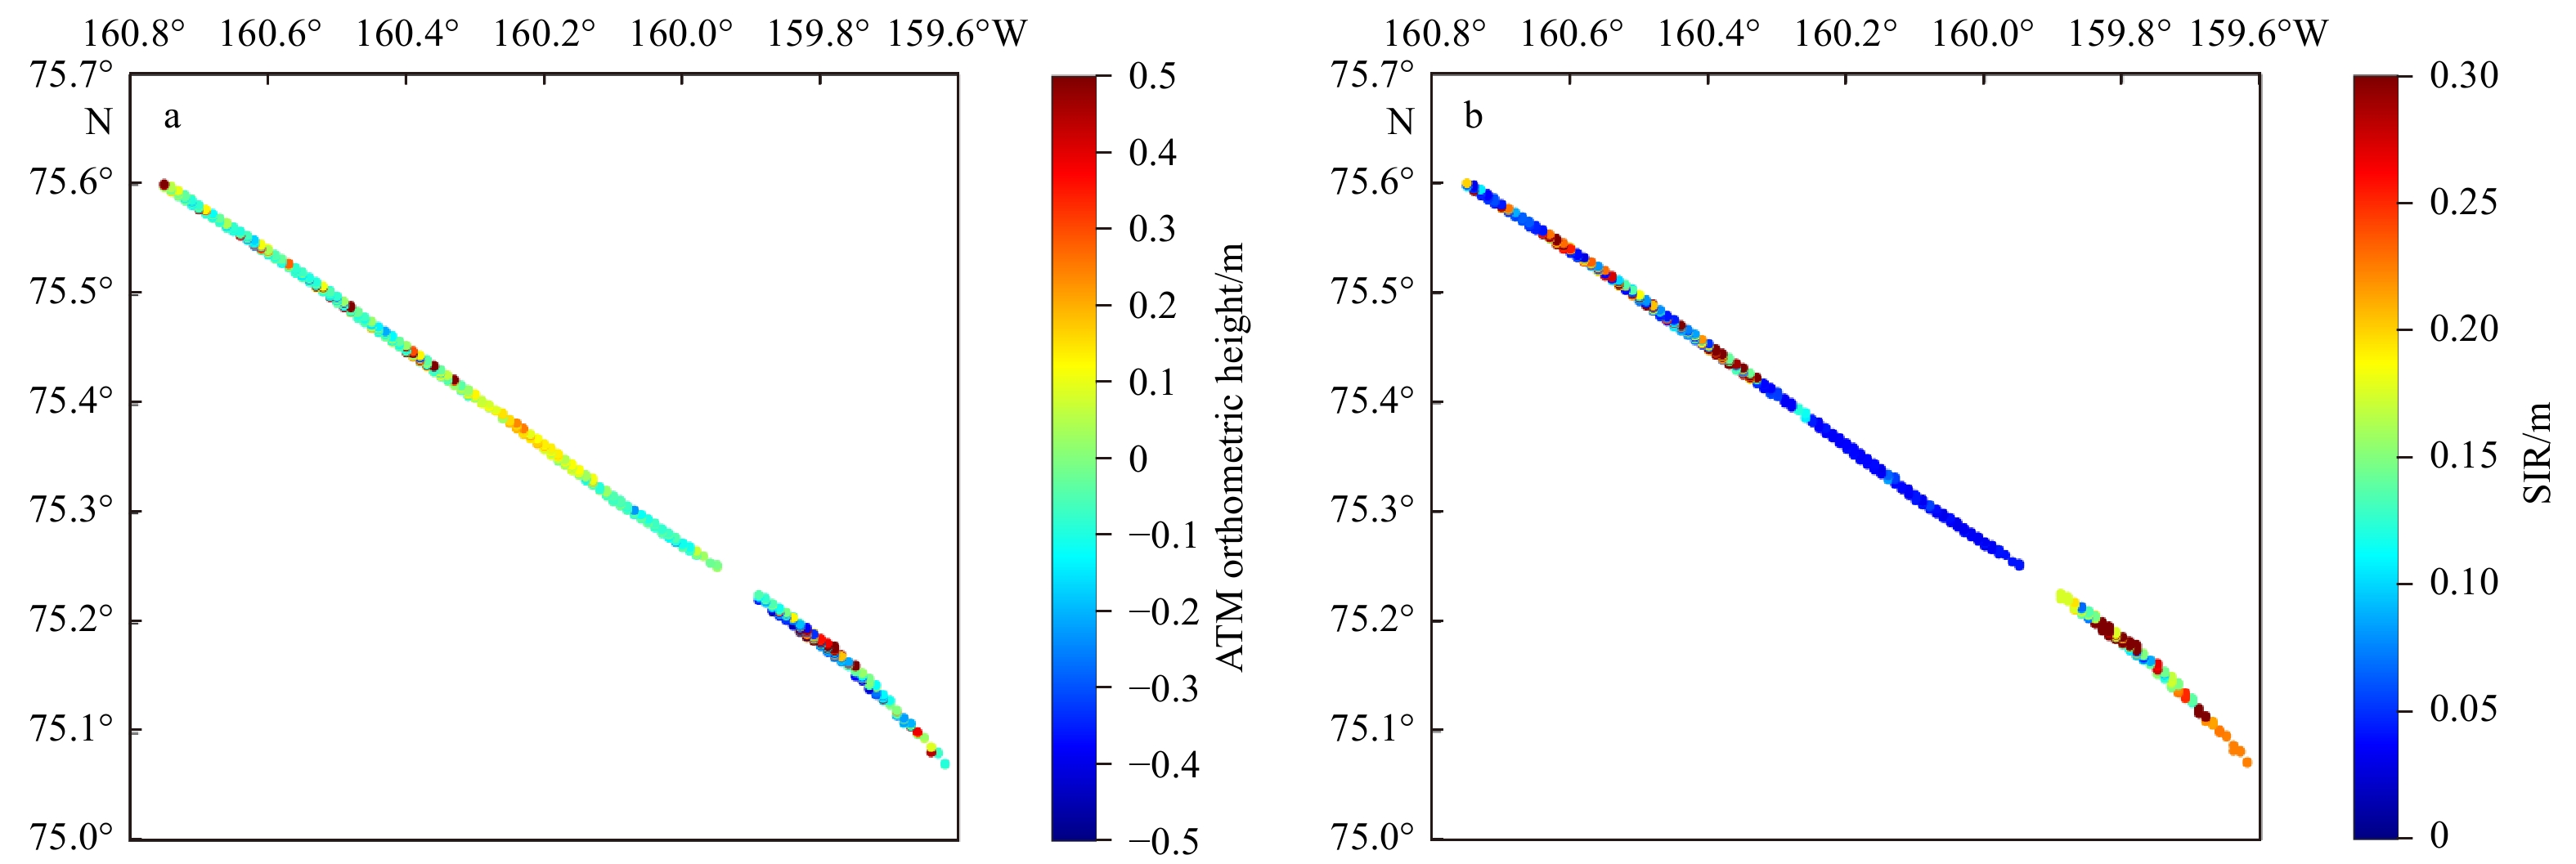
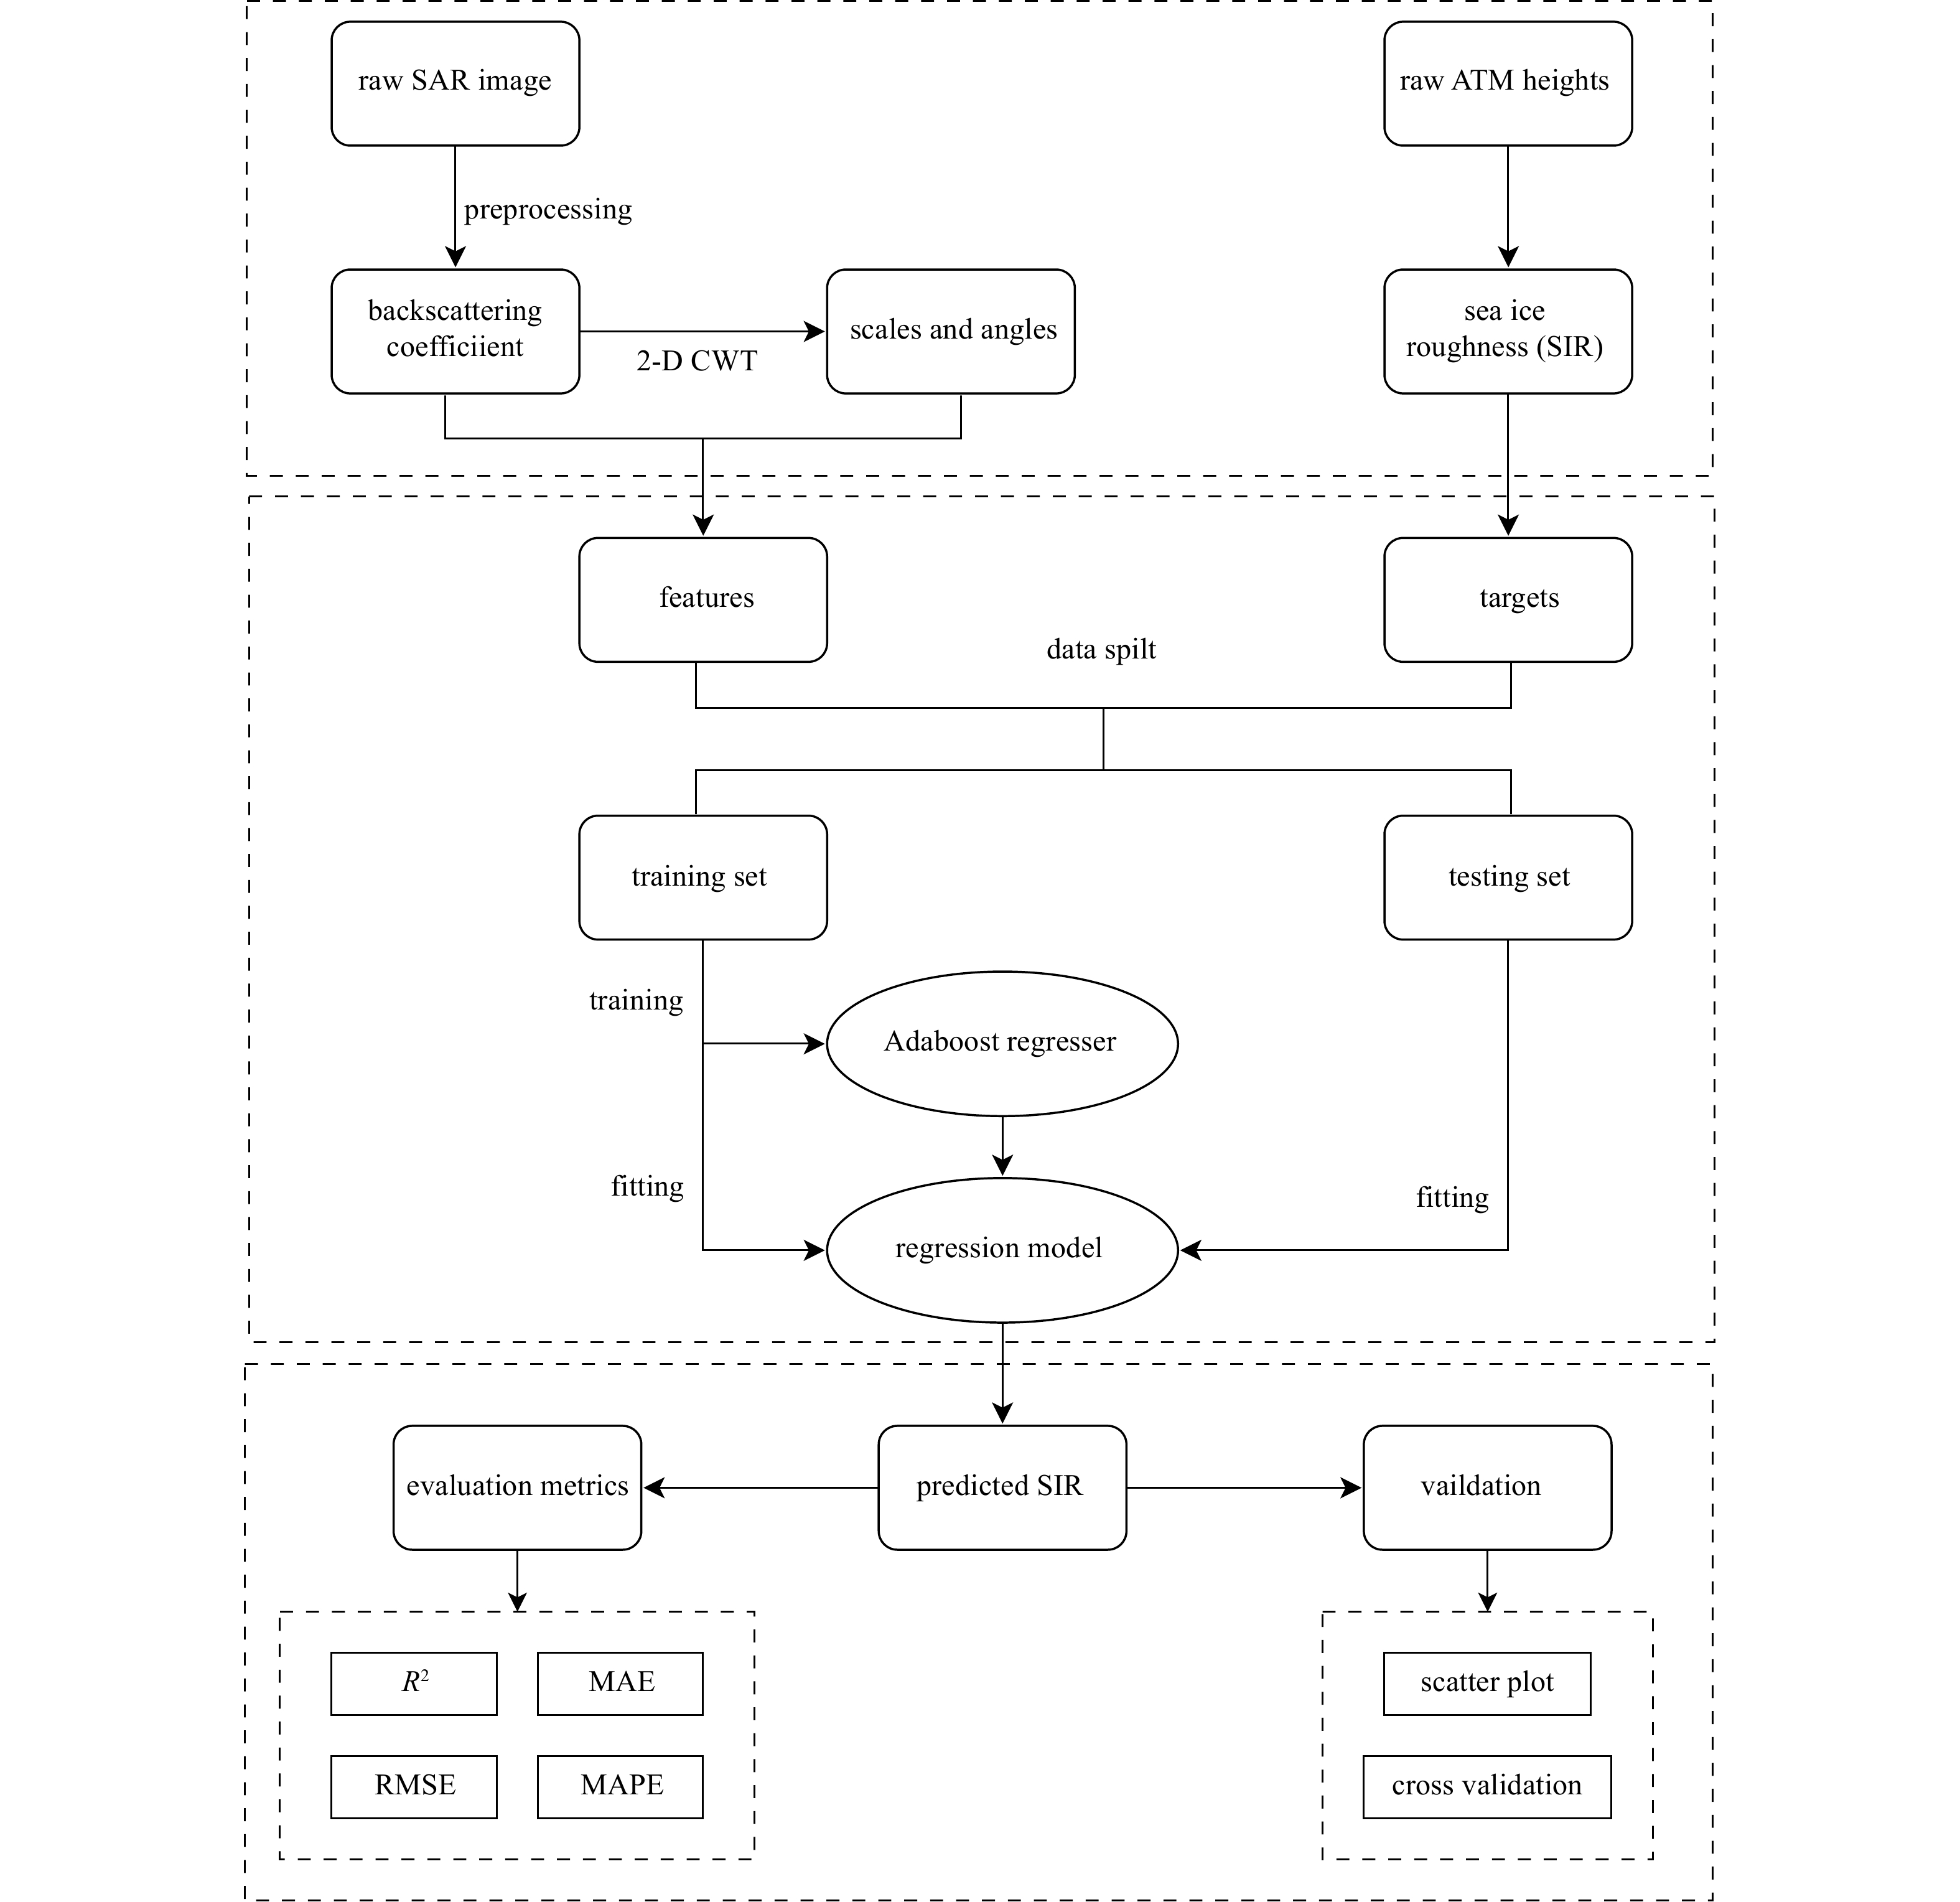
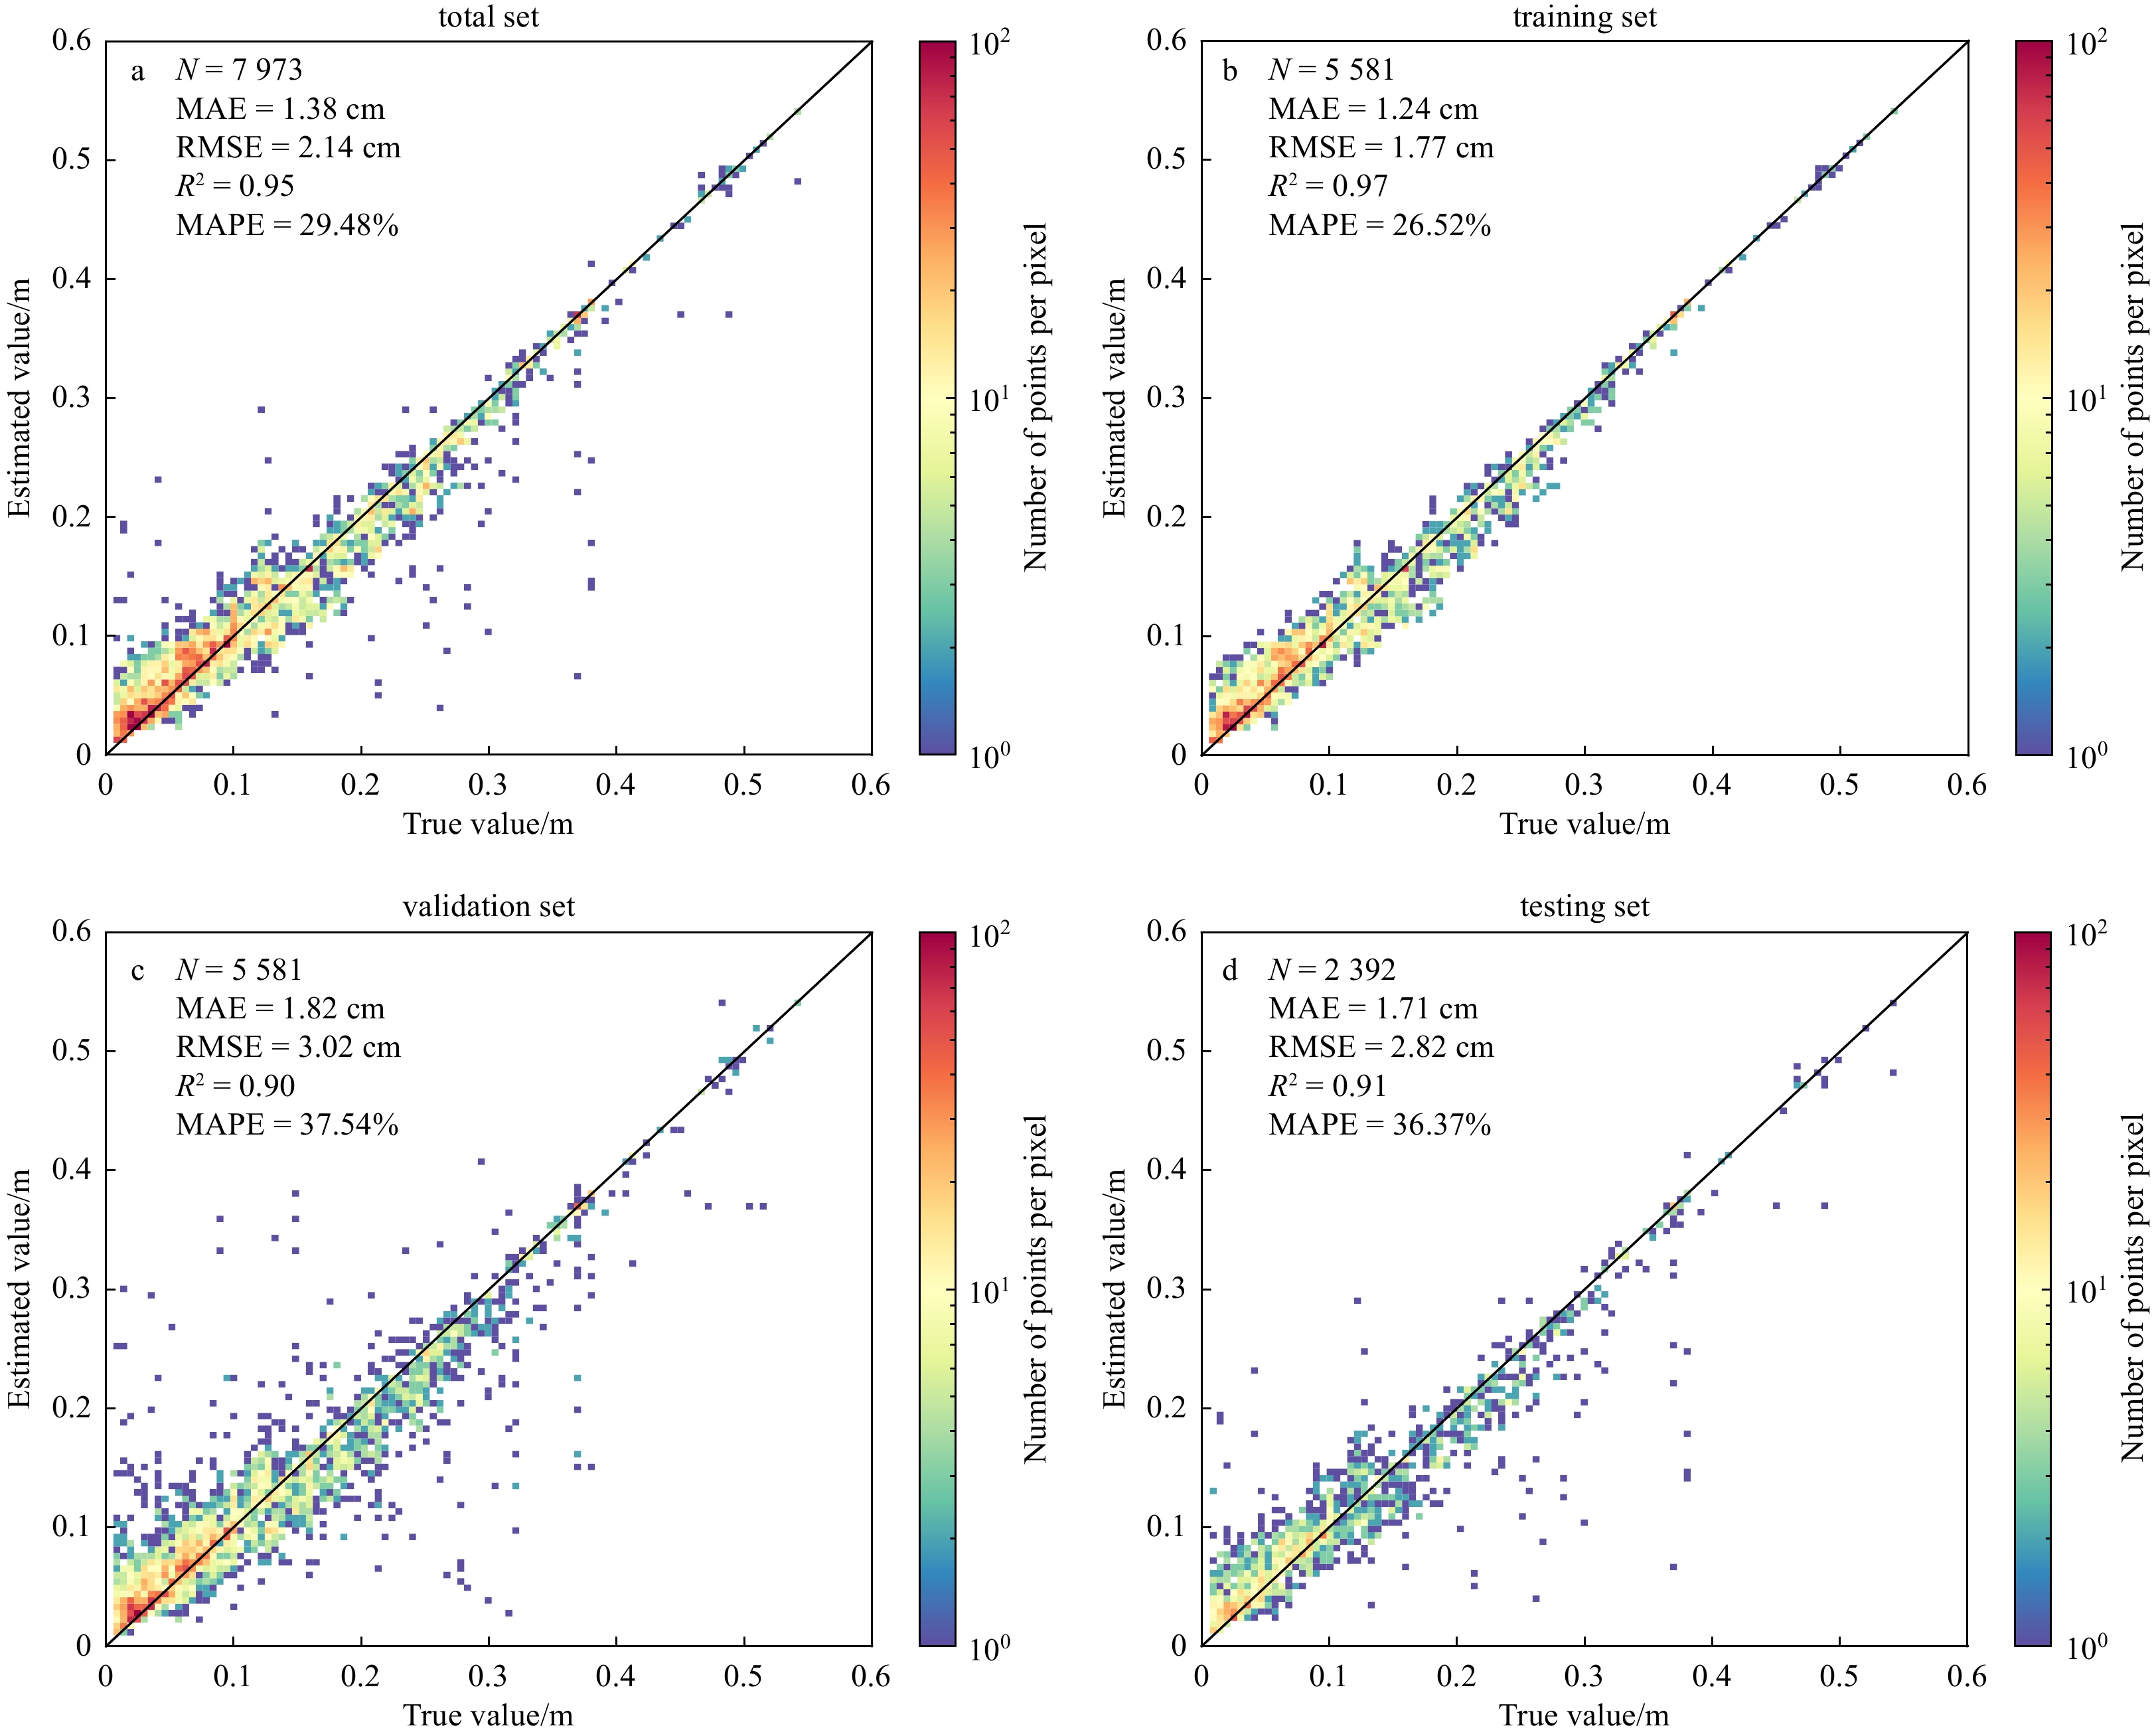
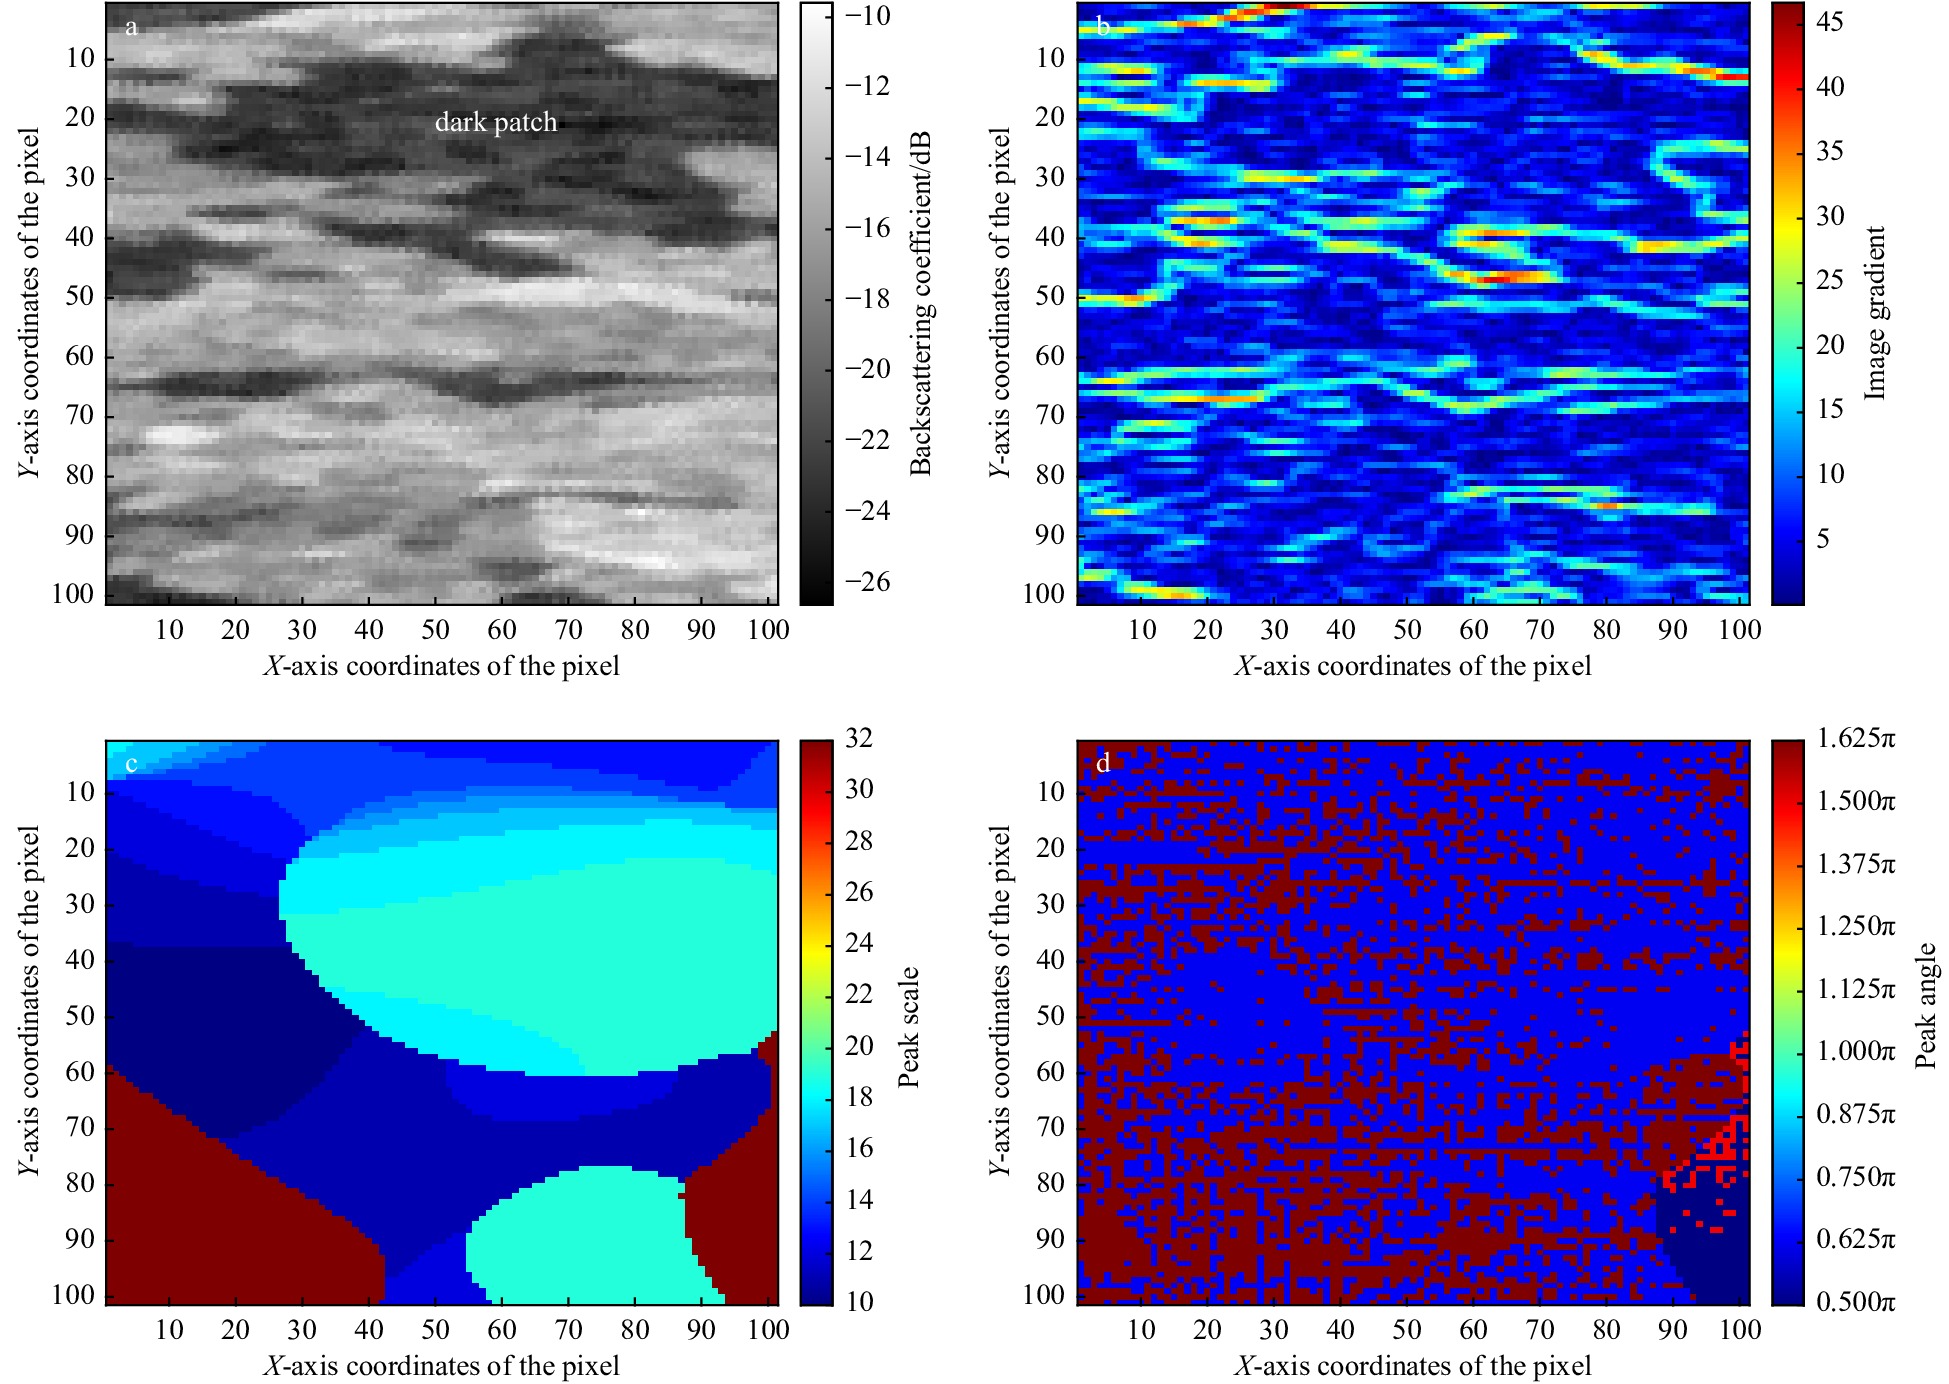
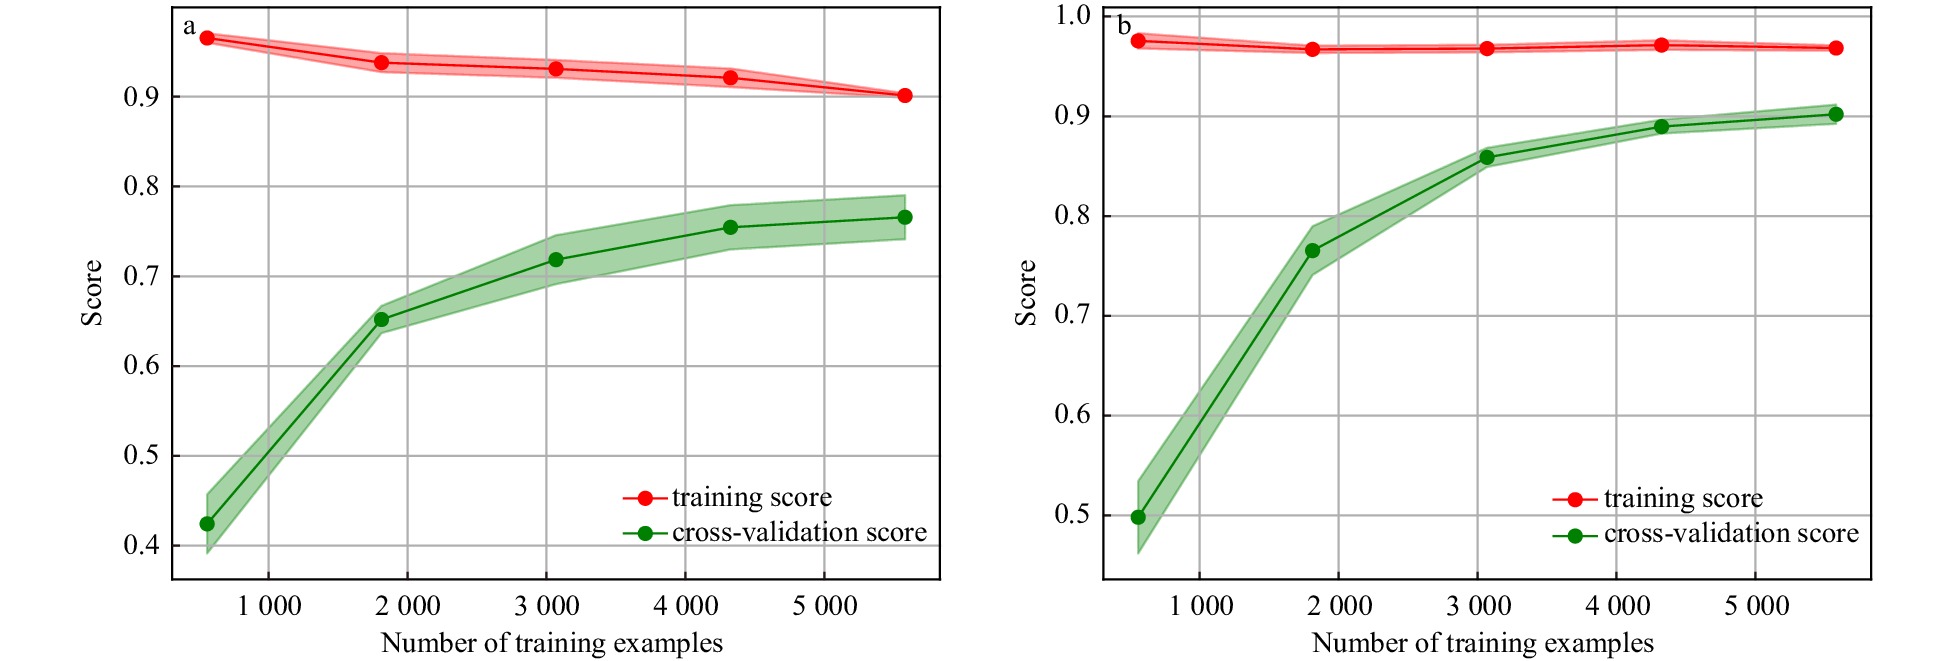
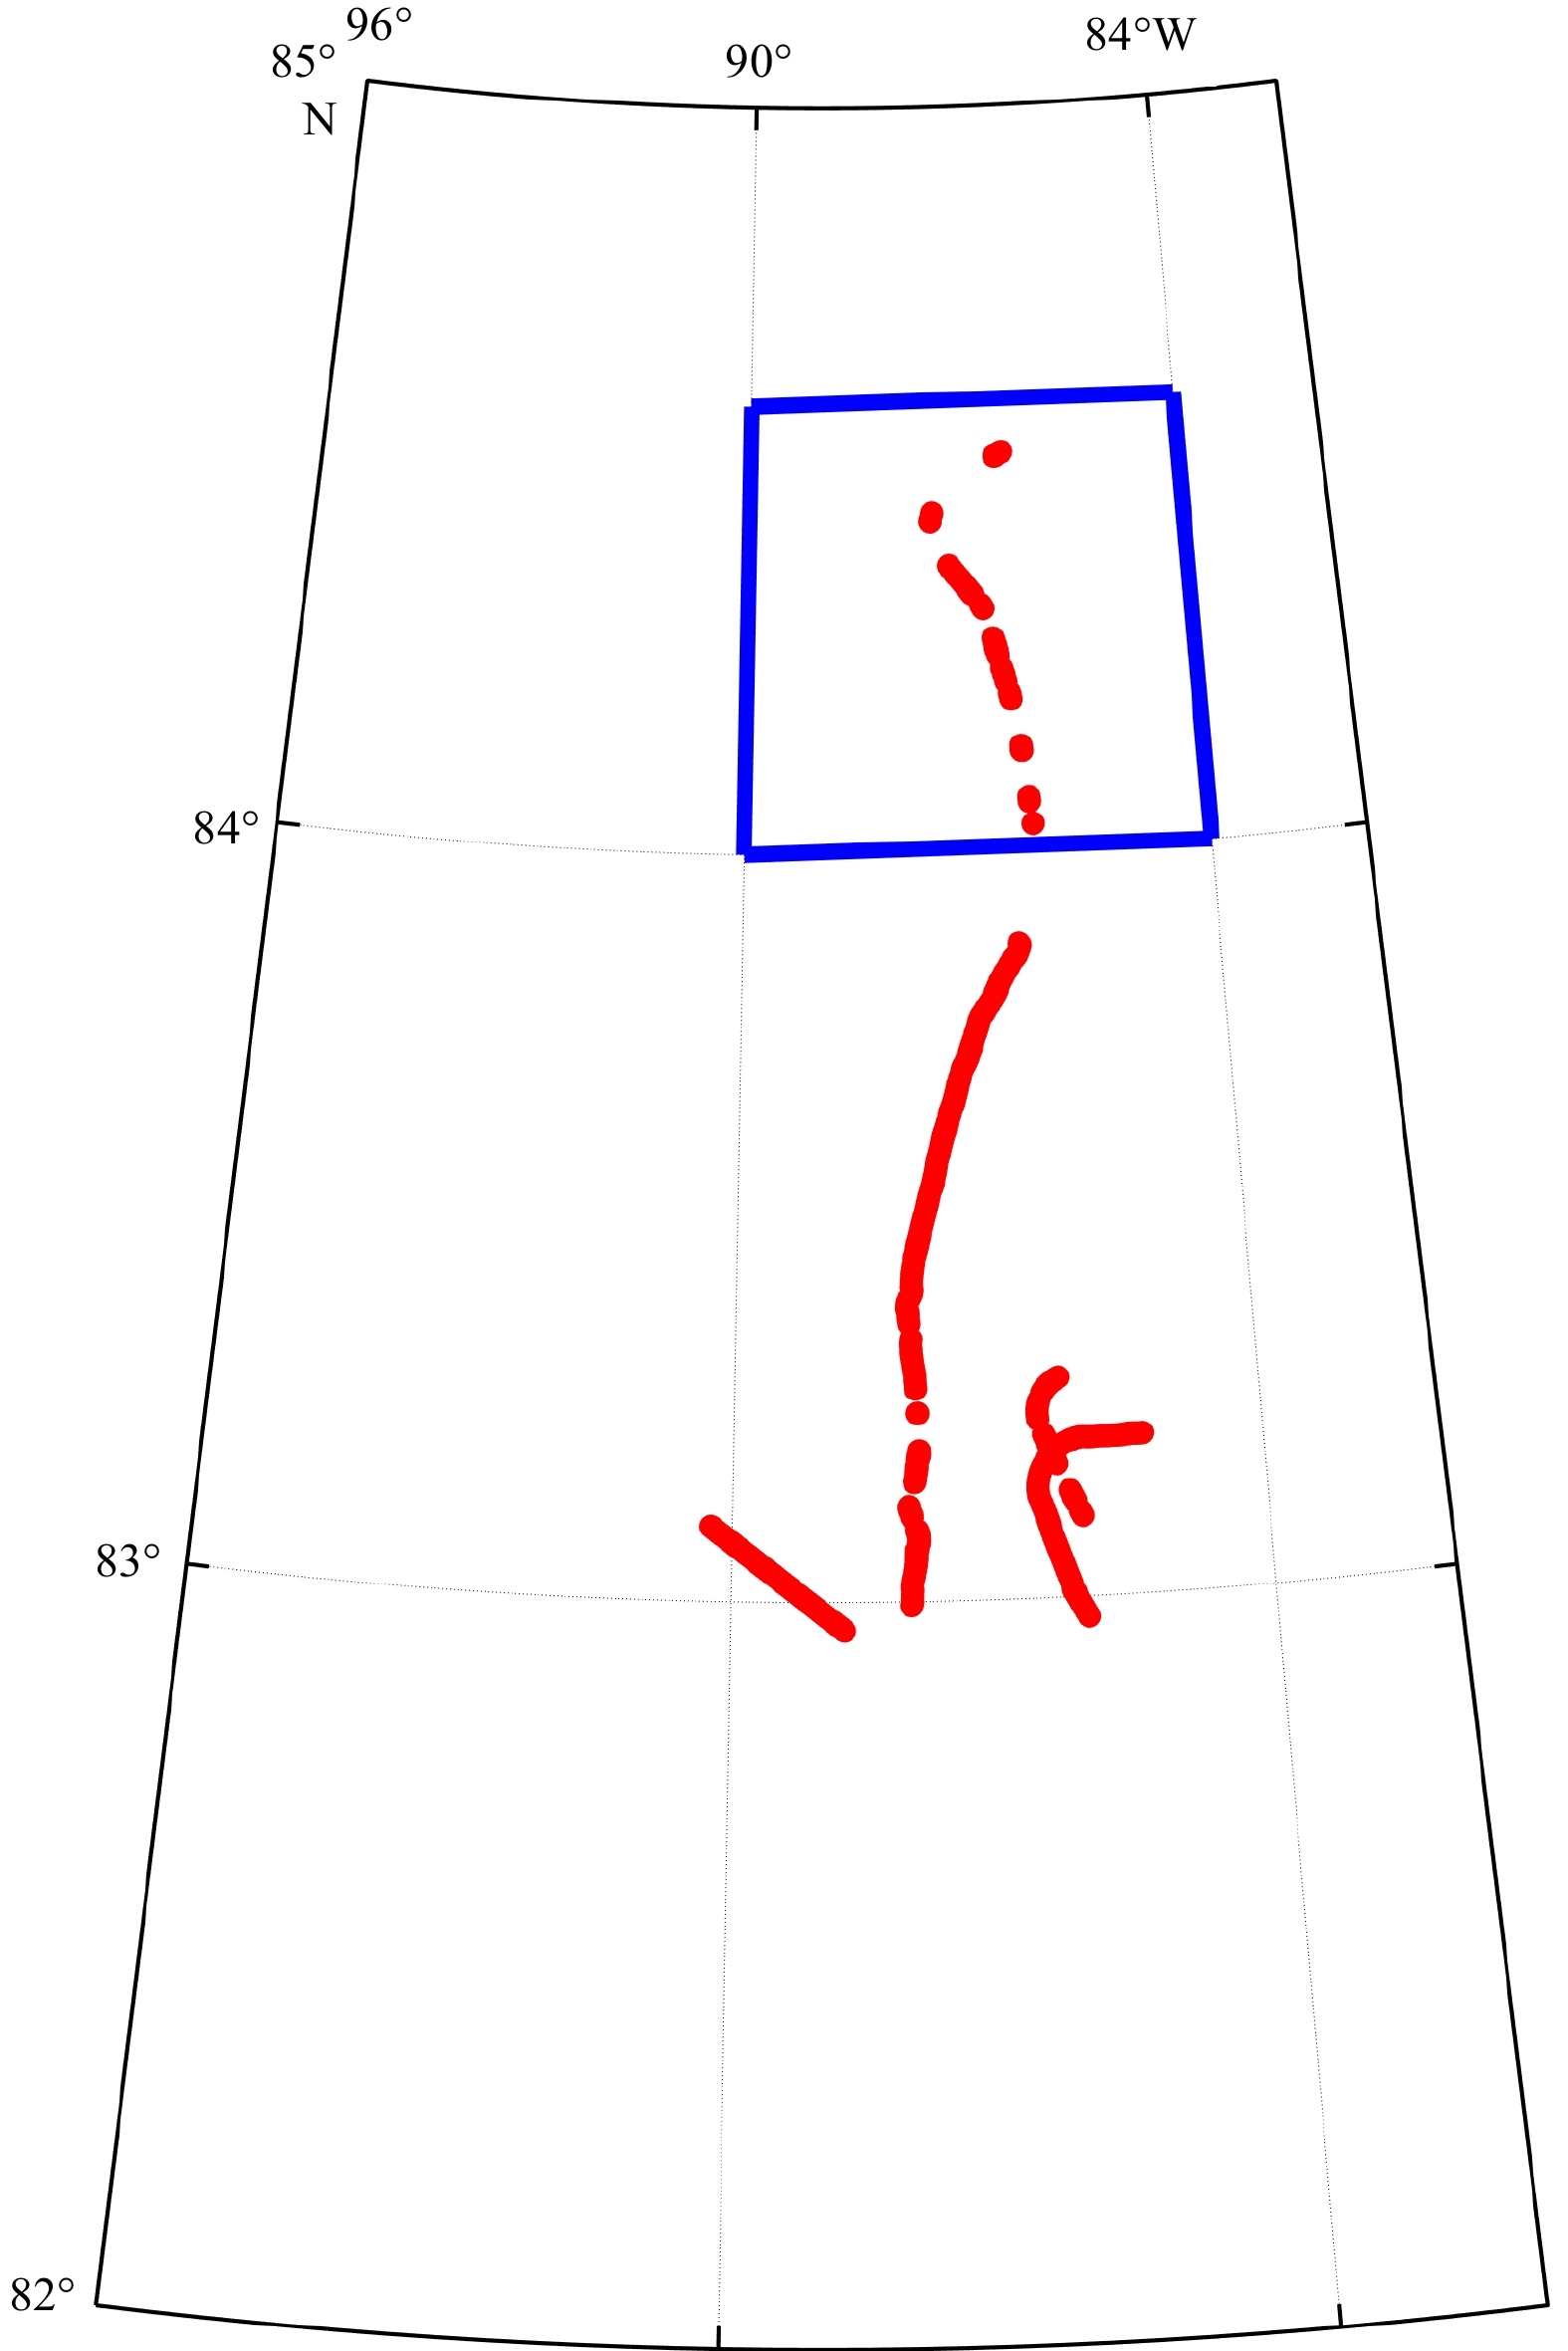
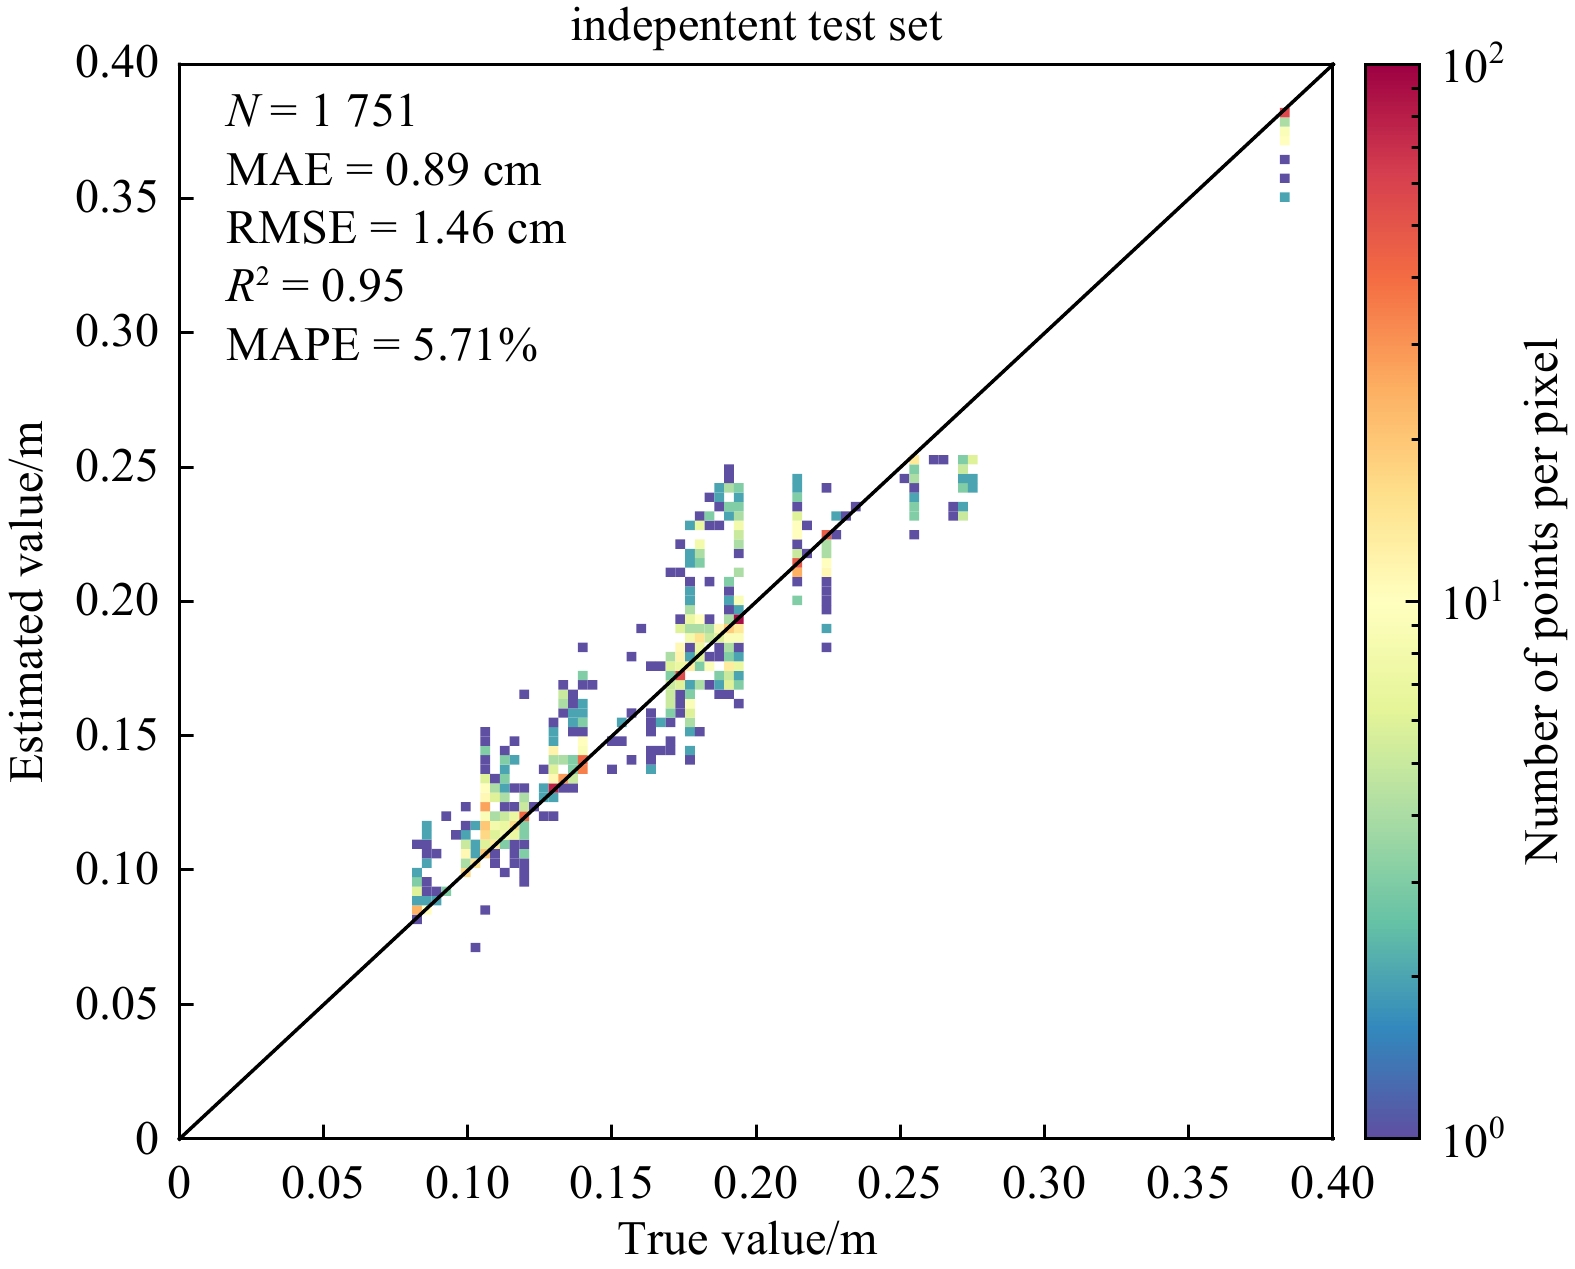
Sea ice surface roughness (SIR) affects the energy transfer between the atmosphere and the ocean, and it is also an important indicator for sea ice characteristics. To obtain a small-scale SIR with high spatial resolution, a novel method is proposed to retrieve SIR from Sentinel-1 synthetic aperture radar (SAR) images, utilizing an ensemble learning method. Firstly, the two-dimensional continuous wavelet transform is applied to obtain the spatial information of sea ice, including the scale and direction of ice patterns. Secondly, a model is developed using the Adaboost Regression model to establish a relationship among SIR, radar backscatter and the spatial information of sea ice. The proposed method is validated by using the SIR retrieved from SAR images and comparing it to the measurements obtained by the Airborne Topographic Mapper (ATM) in the summer Beaufort Sea. The determination of coefficient, mean absolute error, root-mean-square error and mean absolute percentage error of the testing data are 0.91, 1.71 cm, 2.82 cm, and 36.37%, respectively, which are reasonable. Moreover, K-fold cross-validation and learning curves are analyzed, which also demonstrate the method’s applicability in retrieving SIR from SAR images.
Sea ice surface roughness (SIR) affects the energy transfer between the atmosphere and the ocean, and it is also an important indicator for sea ice characteristics. To obtain a small-scale SIR with high spatial resolution, a novel method is proposed to retrieve SIR from Sentinel-1 synthetic aperture radar (SAR) images, utilizing an ensemble learning method. Firstly, the two-dimensional continuous wavelet transform is applied to obtain the spatial information of sea ice, including the scale and direction of ice patterns. Secondly, a model is developed using the Adaboost Regression model to establish a relationship among SIR, radar backscatter and the spatial information of sea ice. The proposed method is validated by using the SIR retrieved from SAR images and comparing it to the measurements obtained by the Airborne Topographic Mapper (ATM) in the summer Beaufort Sea. The determination of coefficient, mean absolute error, root-mean-square error and mean absolute percentage error of the testing data are 0.91, 1.71 cm, 2.82 cm, and 36.37%, respectively, which are reasonable. Moreover, K-fold cross-validation and learning curves are analyzed, which also demonstrate the method’s applicability in retrieving SIR from SAR images.


2024, 43(5): 91-99.
doi: 10.1007/s13131-024-2321-z
Abstract:
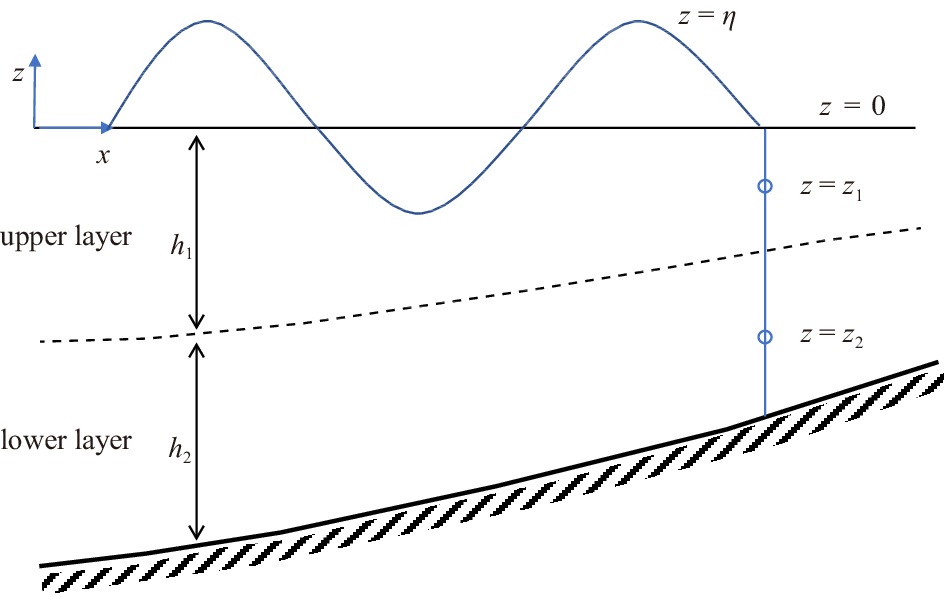
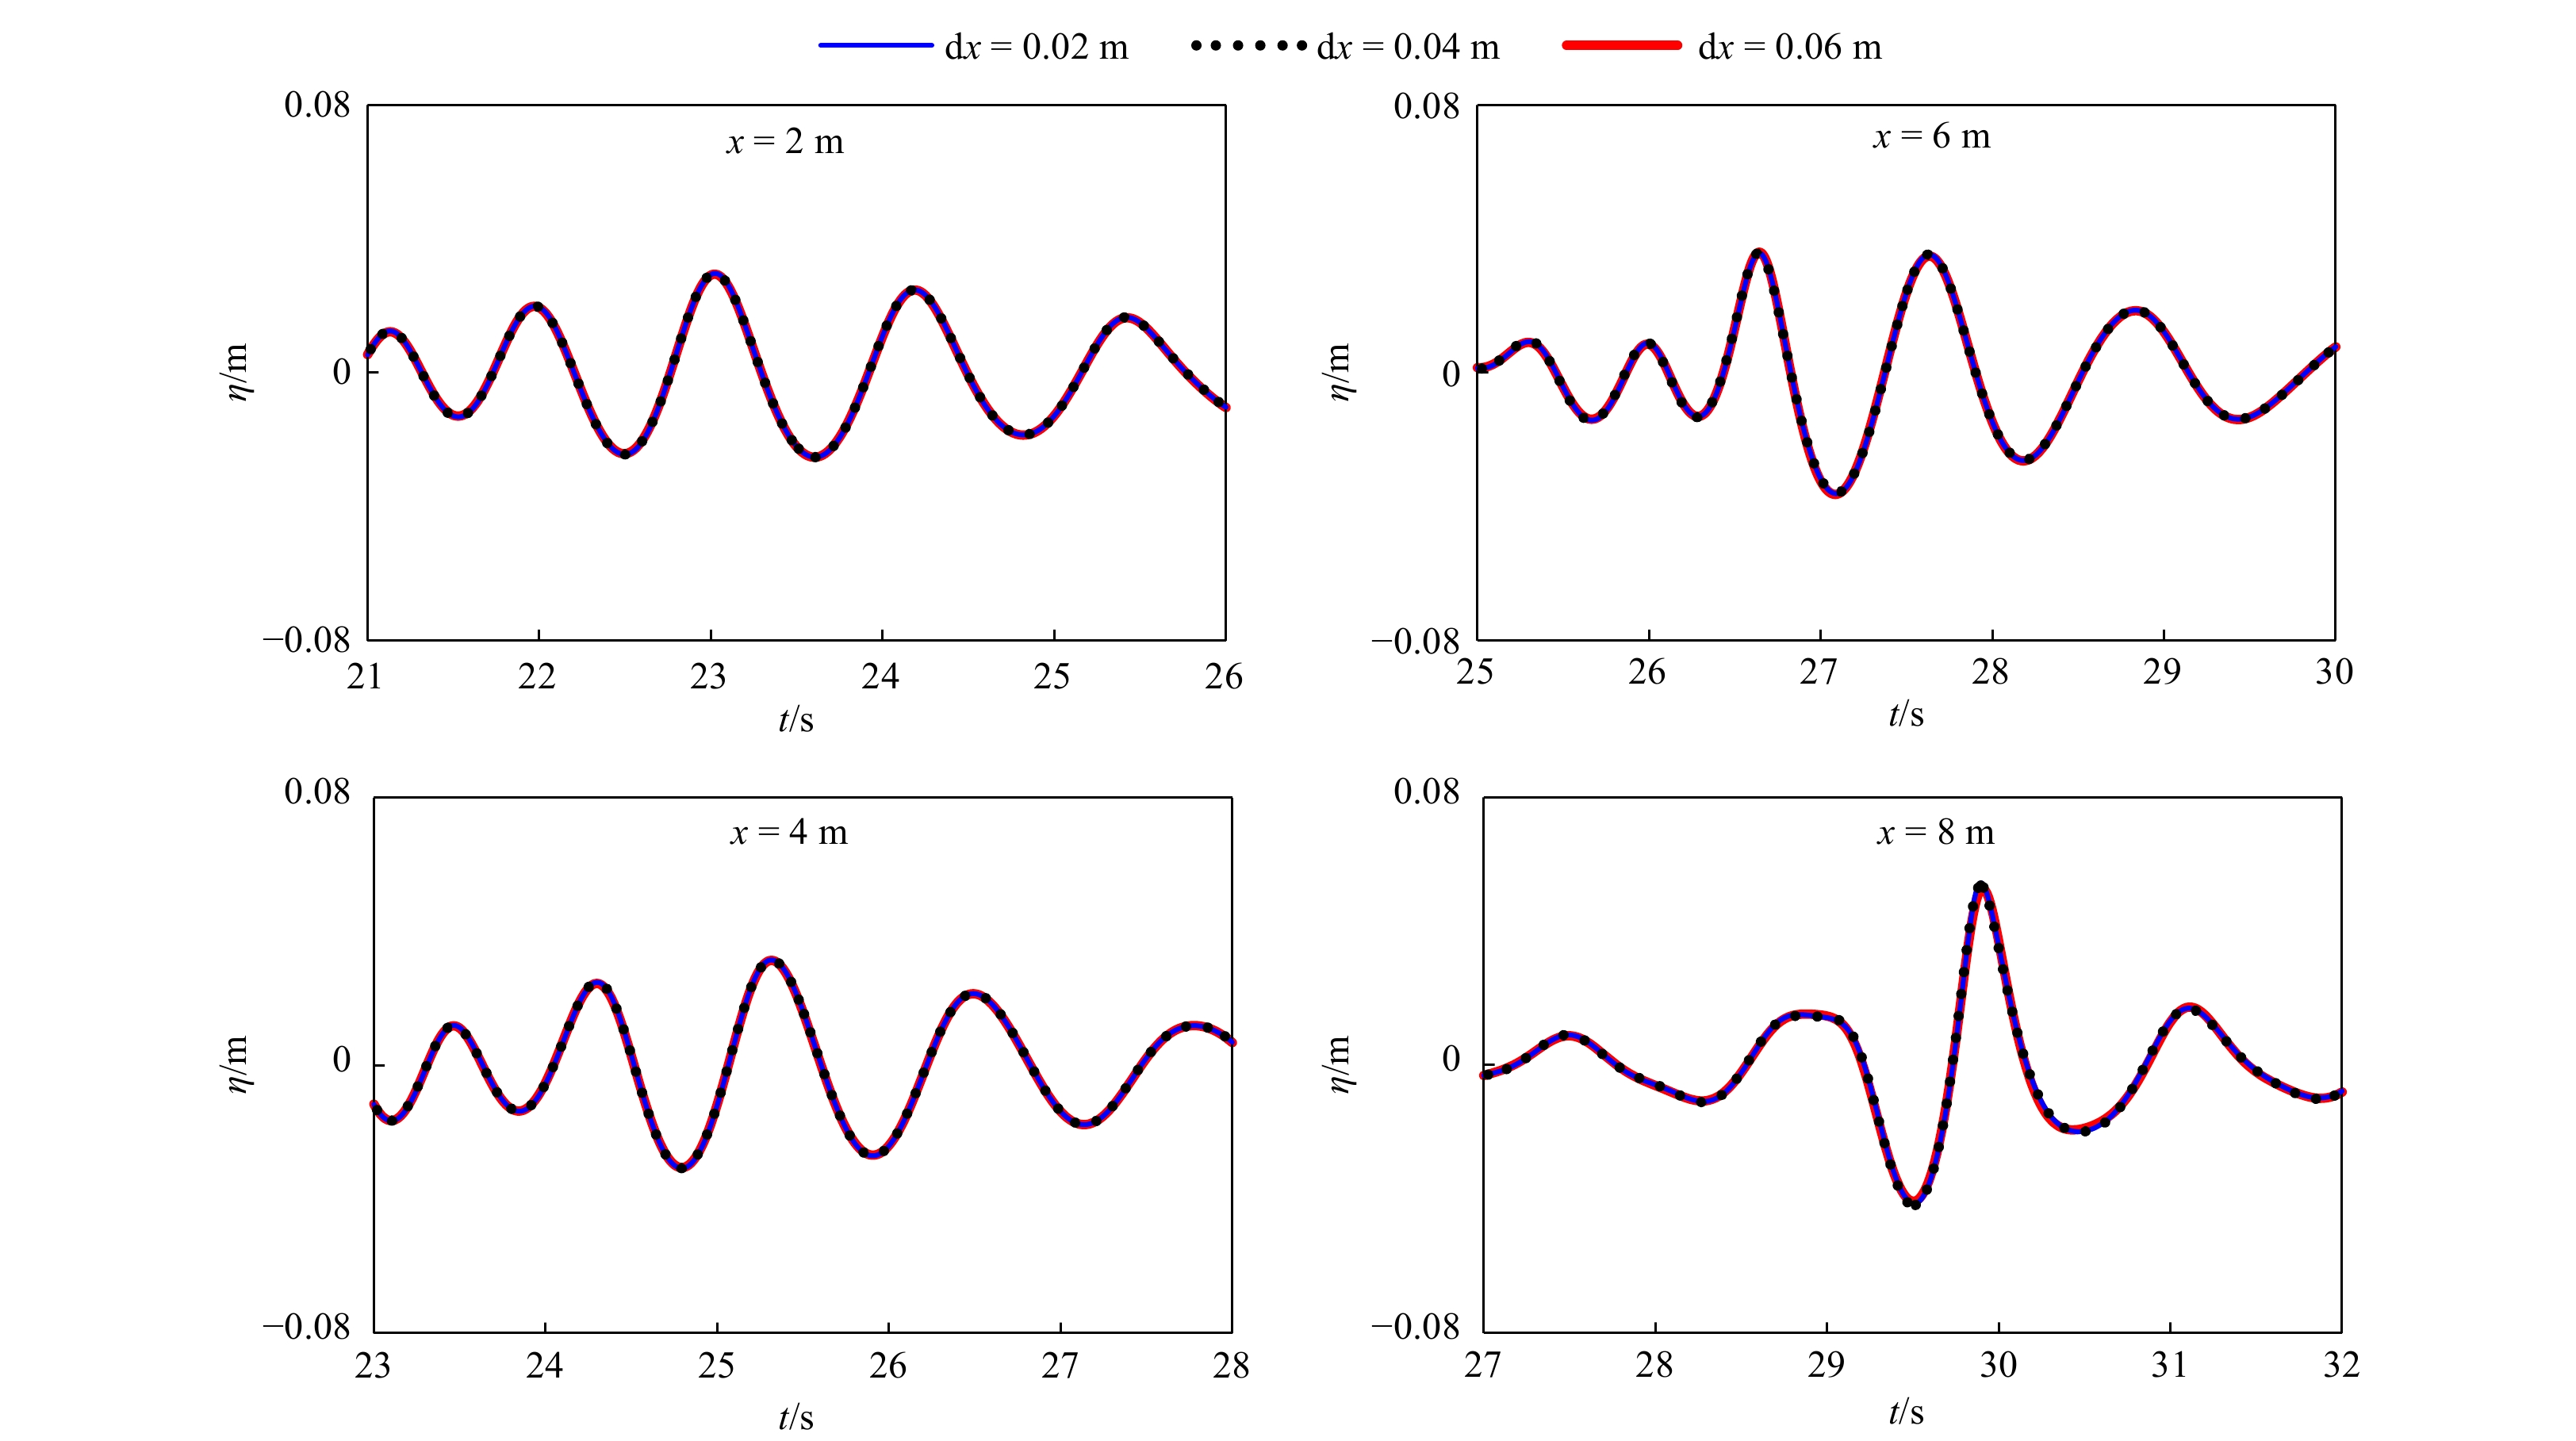
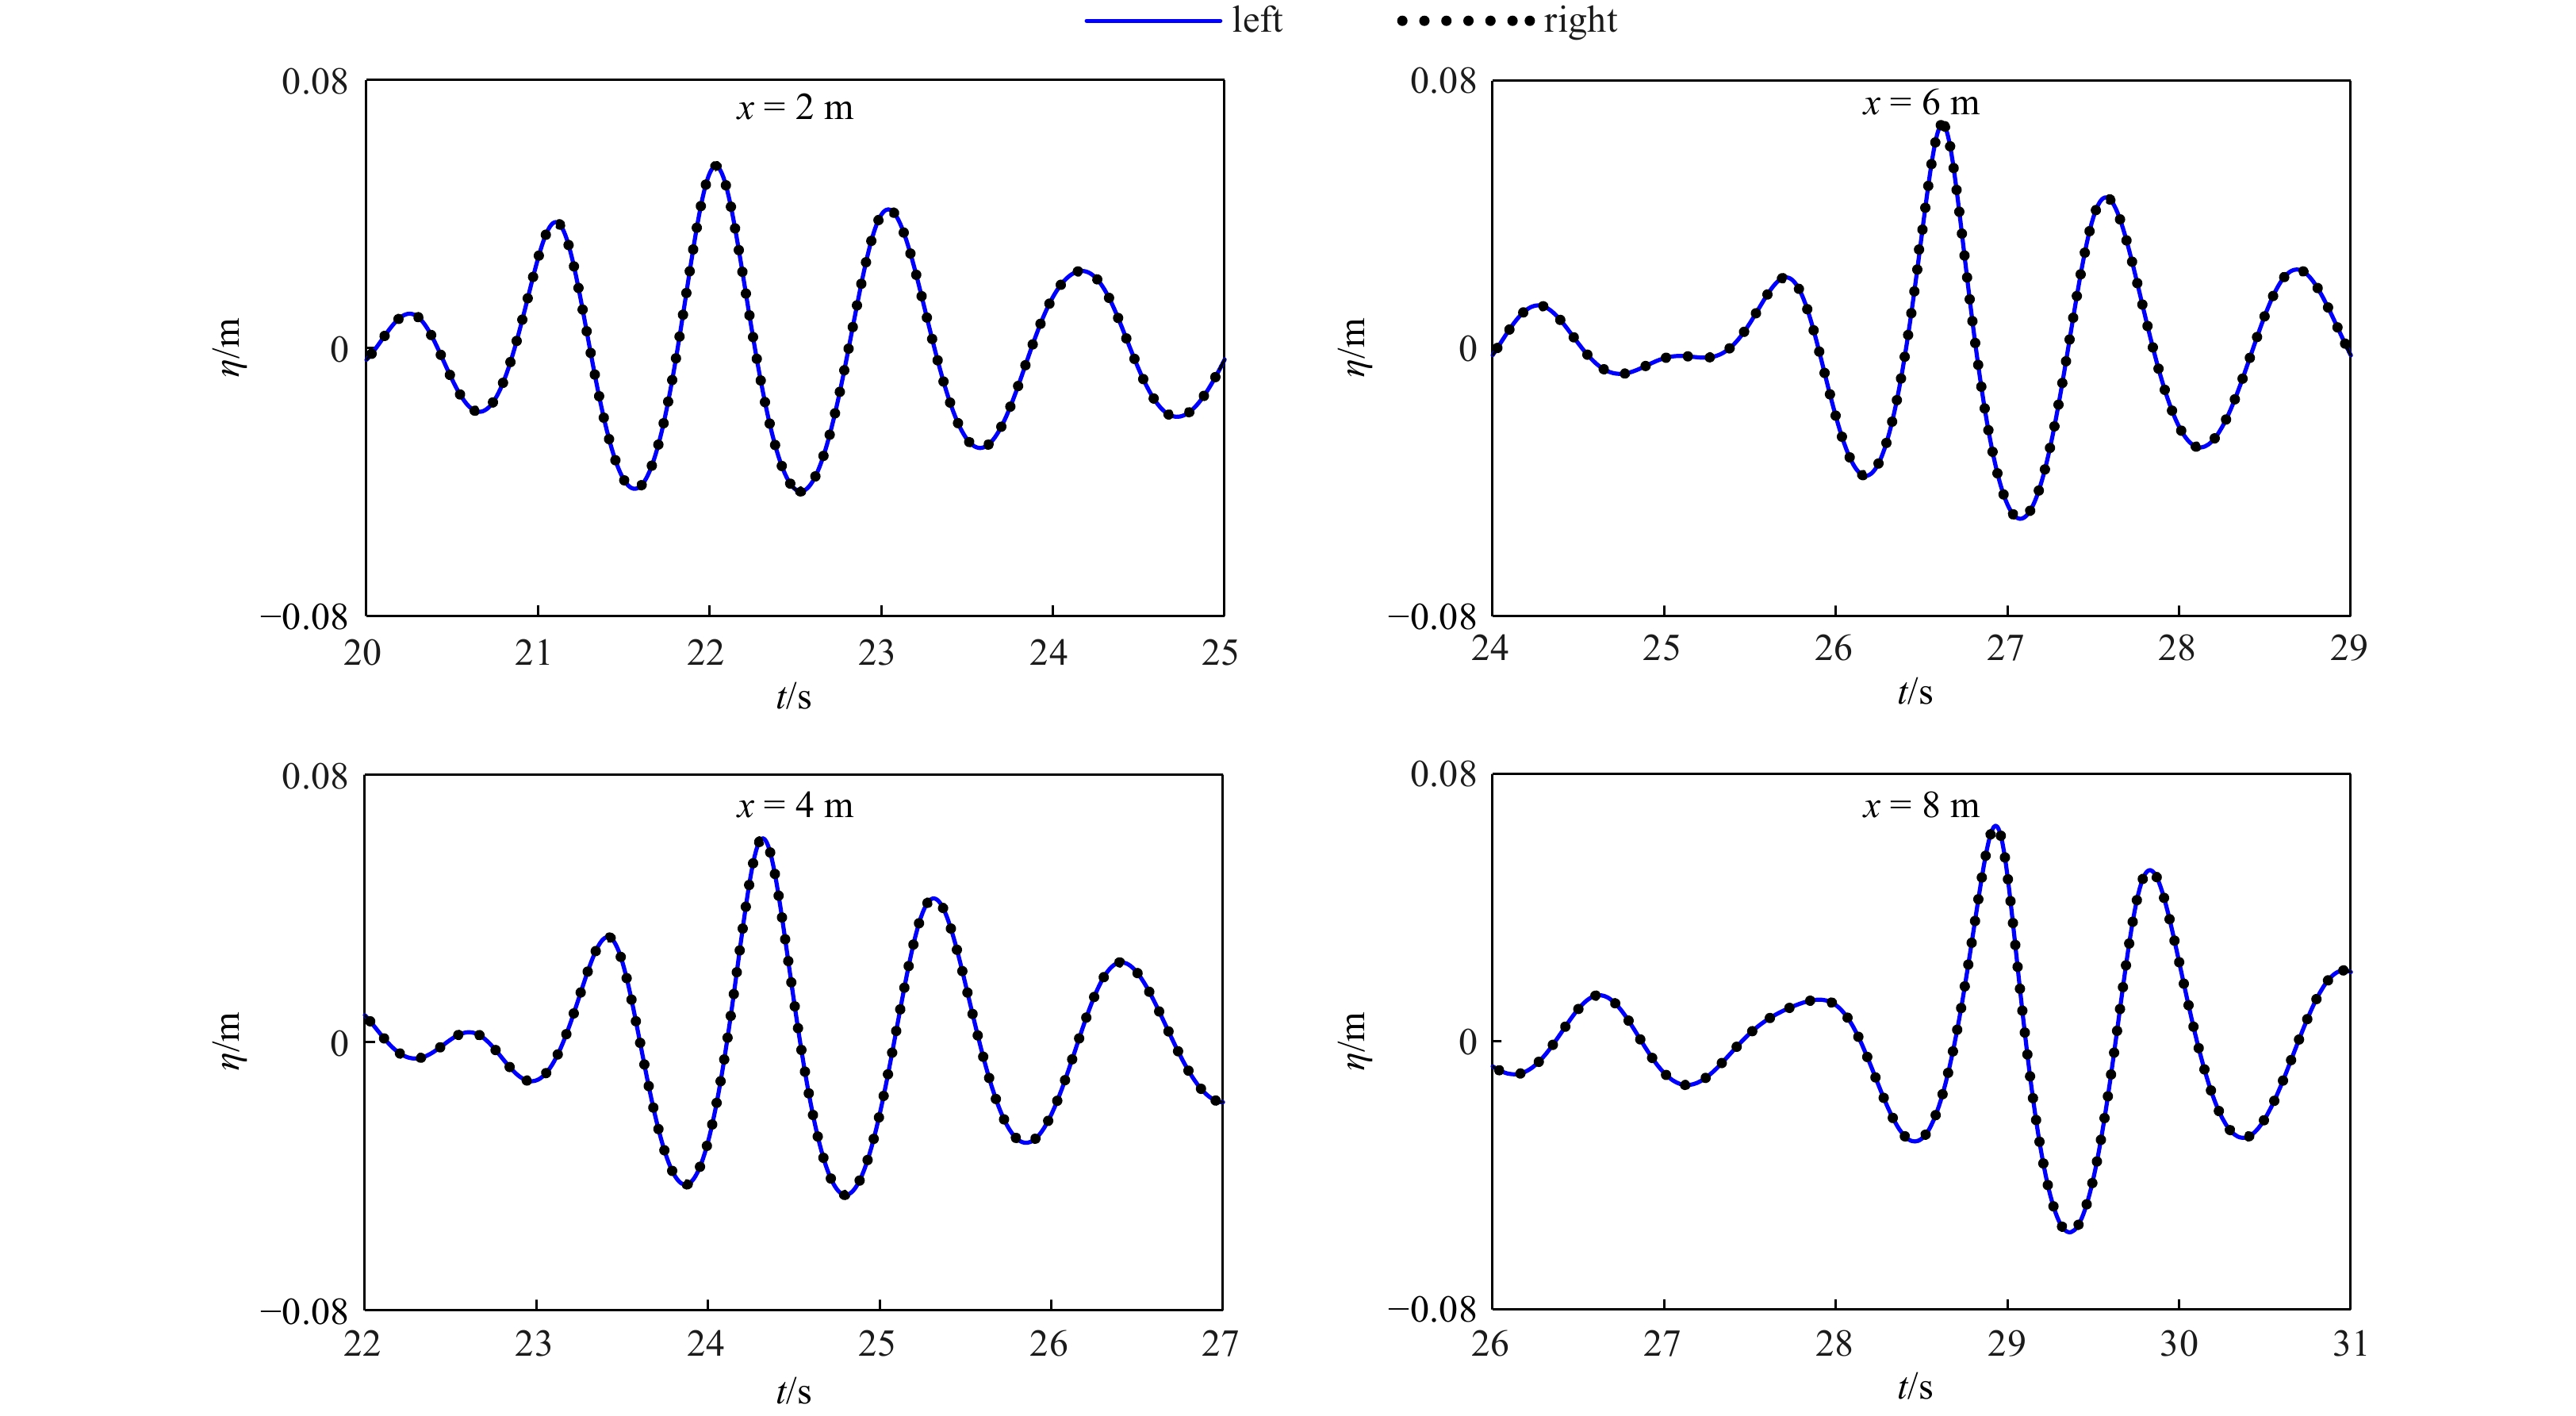
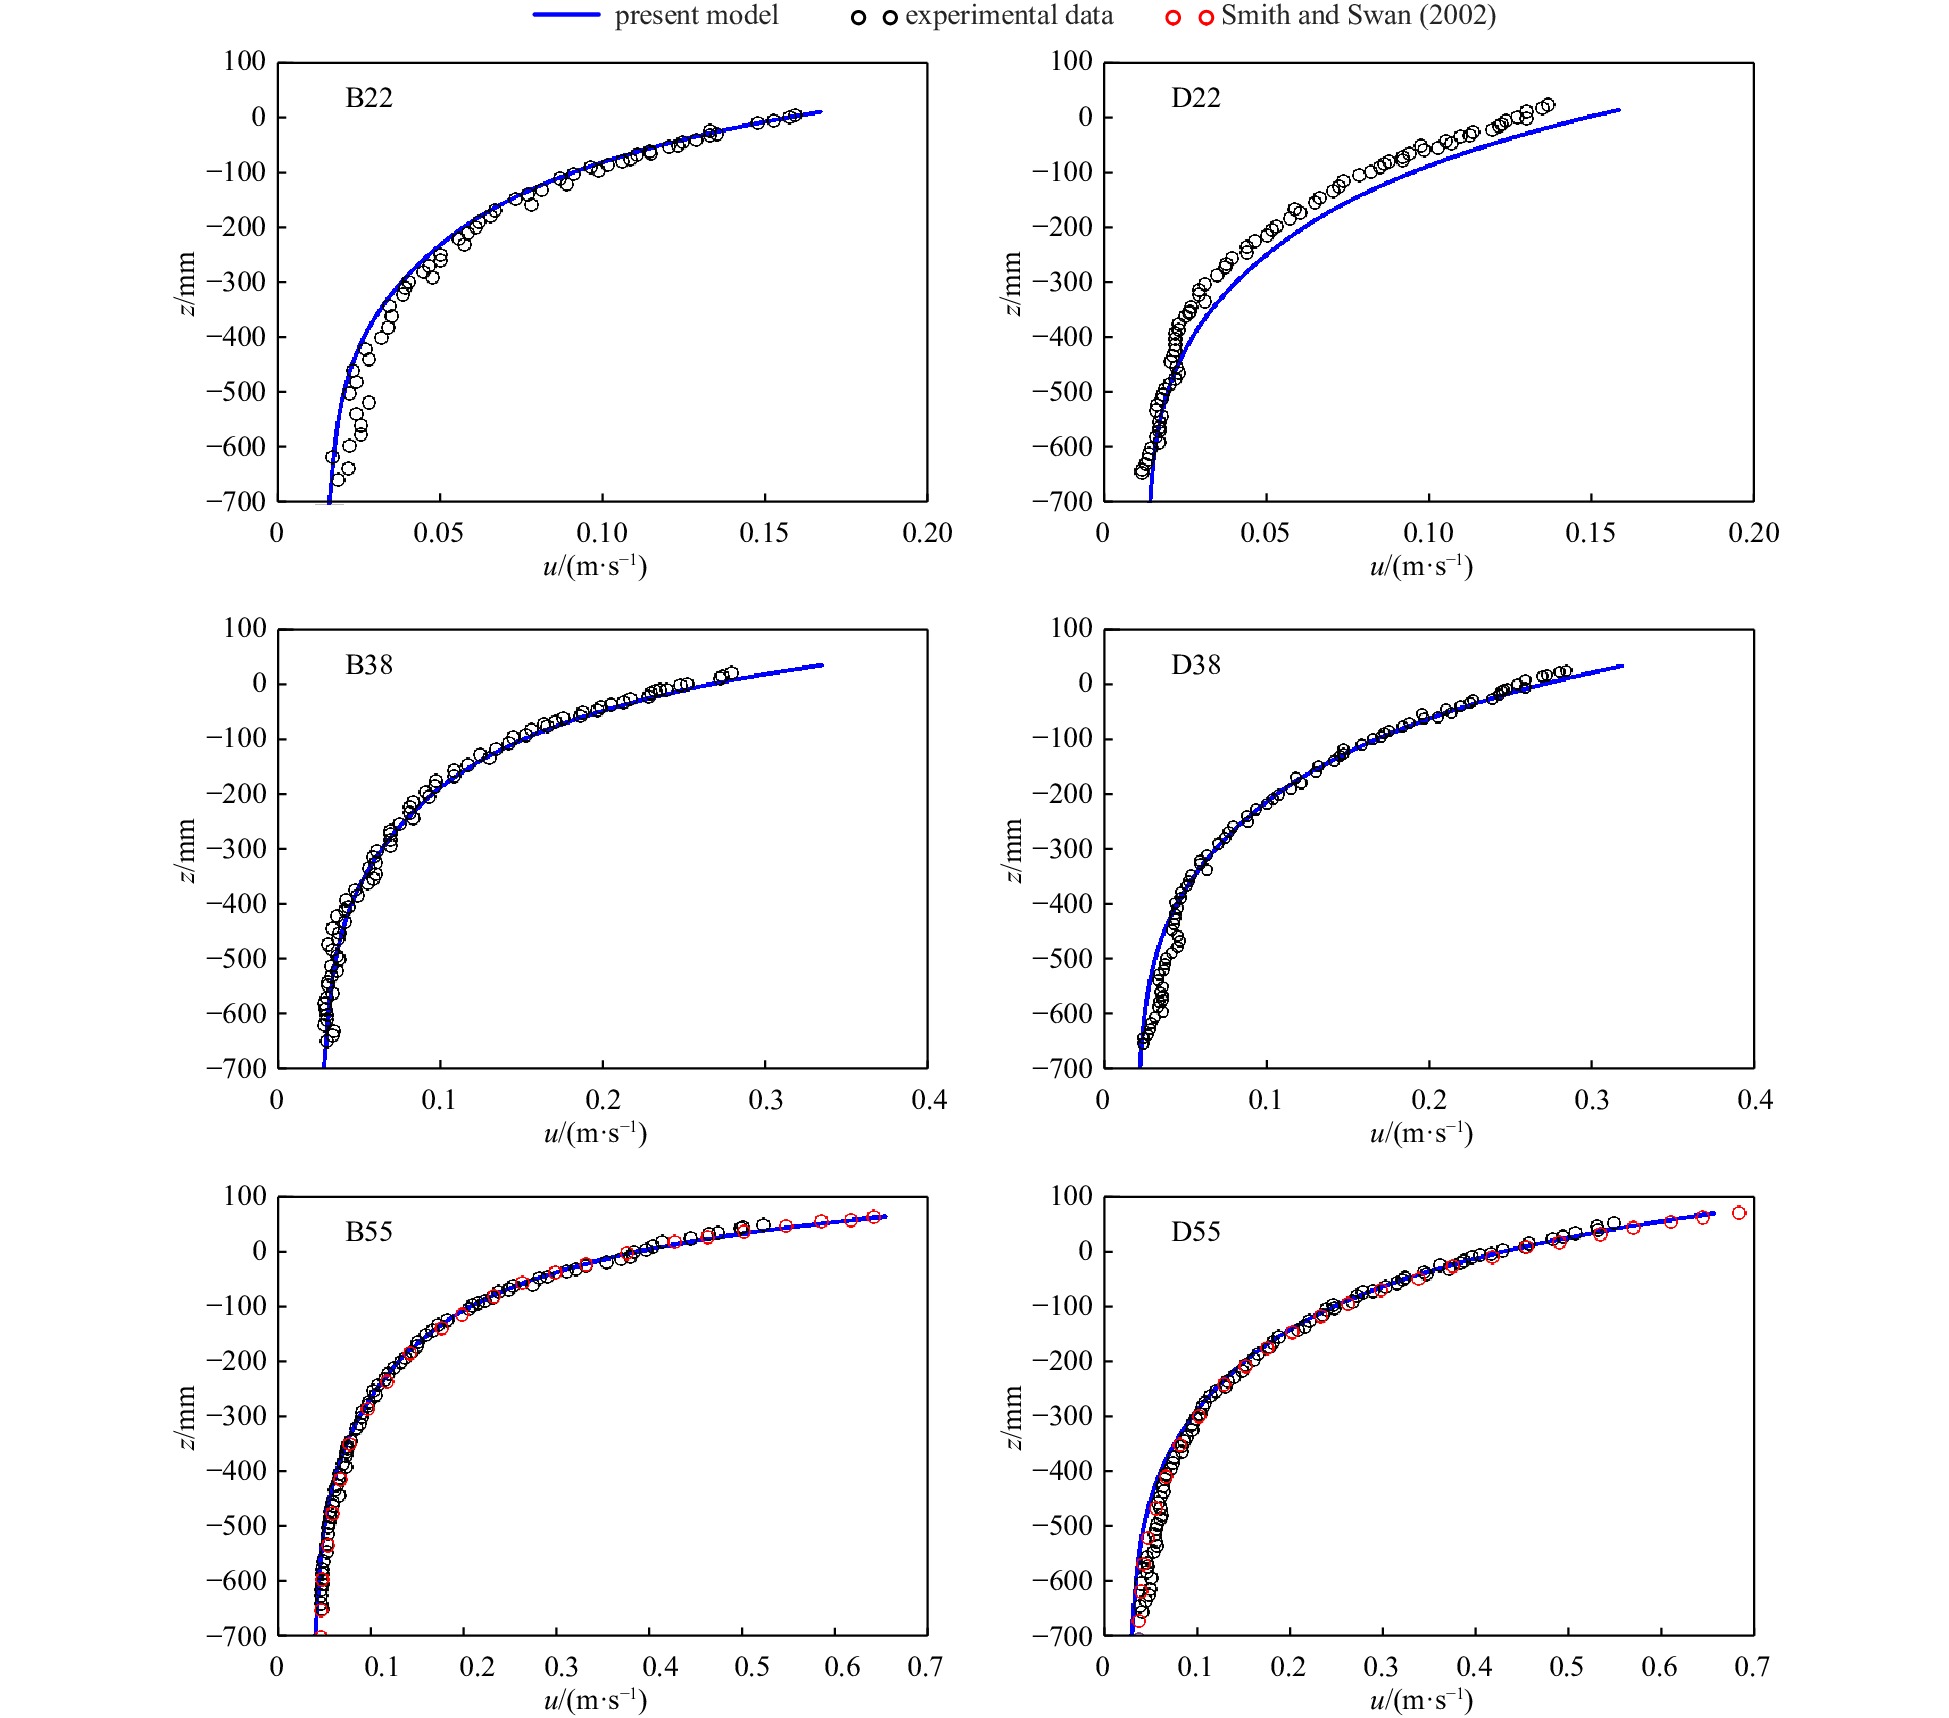
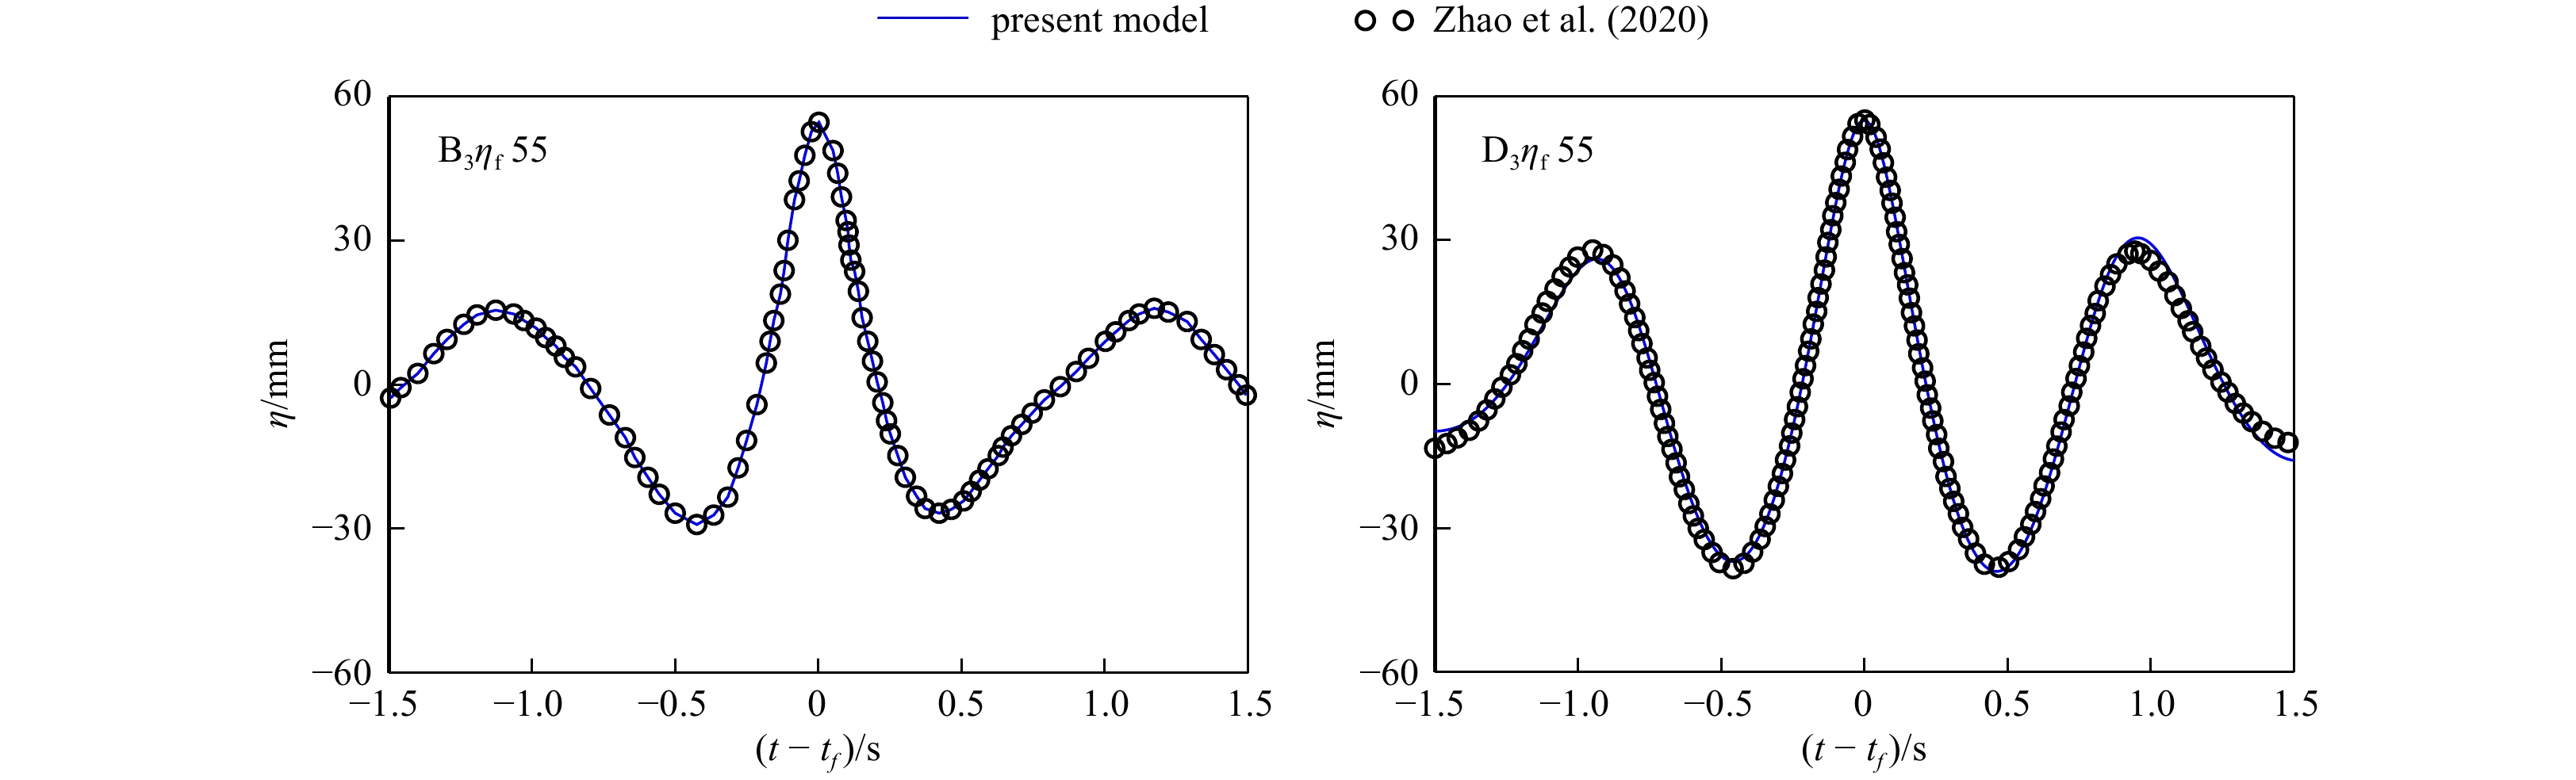
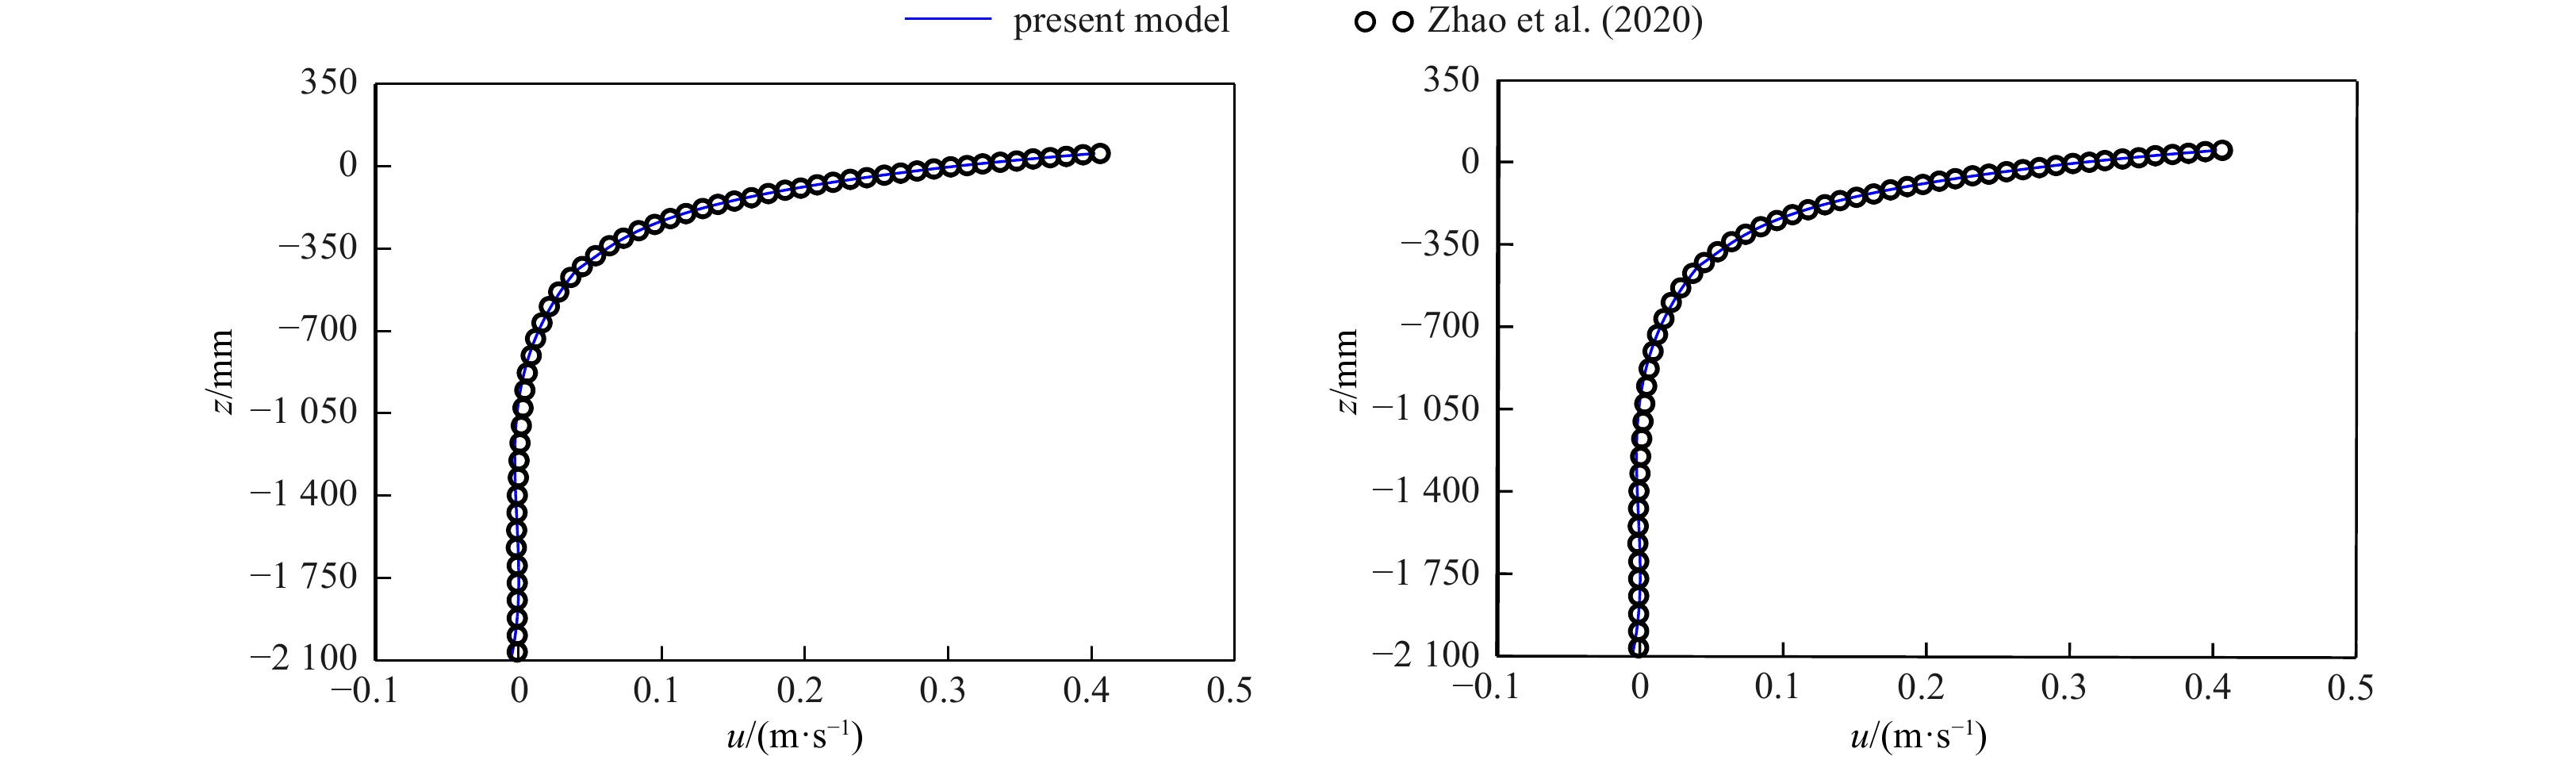
Accurate simulation of the evolution of freak waves by the wave phase focusing method requires accurate linear and nonlinear properties, especially in deep-water conditions. In this paper, we analyze the ability to simulate deep-water focused waves of a two-layer Boussinesq-type (BT) model, which has been shown to have excellent linear and nonlinear performance. To further improve the numerical accuracy and stability, the internal wave-generated method is introduced into the two-layer Boussinesq-type model. Firstly, the sensitivity of the numerical results to the grid resolution is analyzed to verify the convergence of the model; secondly, the focused wave propagating in two opposite directions is simulated to prove the symmetry of the numerical results and the feasibility of the internal wave-generated method; thirdly, the limiting focused wave condition is simulated to compare and analyze the wave surface and the horizontal velocity of the profile at the focusing position, which is in good agreement with the measured values. Meanwhile the simulation of focused waves in very deep waters agrees well with the measured values, which further demonstrates the capability of the two-layer BT model in simulating focused waves in deep waters.
Accurate simulation of the evolution of freak waves by the wave phase focusing method requires accurate linear and nonlinear properties, especially in deep-water conditions. In this paper, we analyze the ability to simulate deep-water focused waves of a two-layer Boussinesq-type (BT) model, which has been shown to have excellent linear and nonlinear performance. To further improve the numerical accuracy and stability, the internal wave-generated method is introduced into the two-layer Boussinesq-type model. Firstly, the sensitivity of the numerical results to the grid resolution is analyzed to verify the convergence of the model; secondly, the focused wave propagating in two opposite directions is simulated to prove the symmetry of the numerical results and the feasibility of the internal wave-generated method; thirdly, the limiting focused wave condition is simulated to compare and analyze the wave surface and the horizontal velocity of the profile at the focusing position, which is in good agreement with the measured values. Meanwhile the simulation of focused waves in very deep waters agrees well with the measured values, which further demonstrates the capability of the two-layer BT model in simulating focused waves in deep waters.


2024, 43(5): 100-109.
doi: 10.1007/s13131-024-2322-y
Abstract:
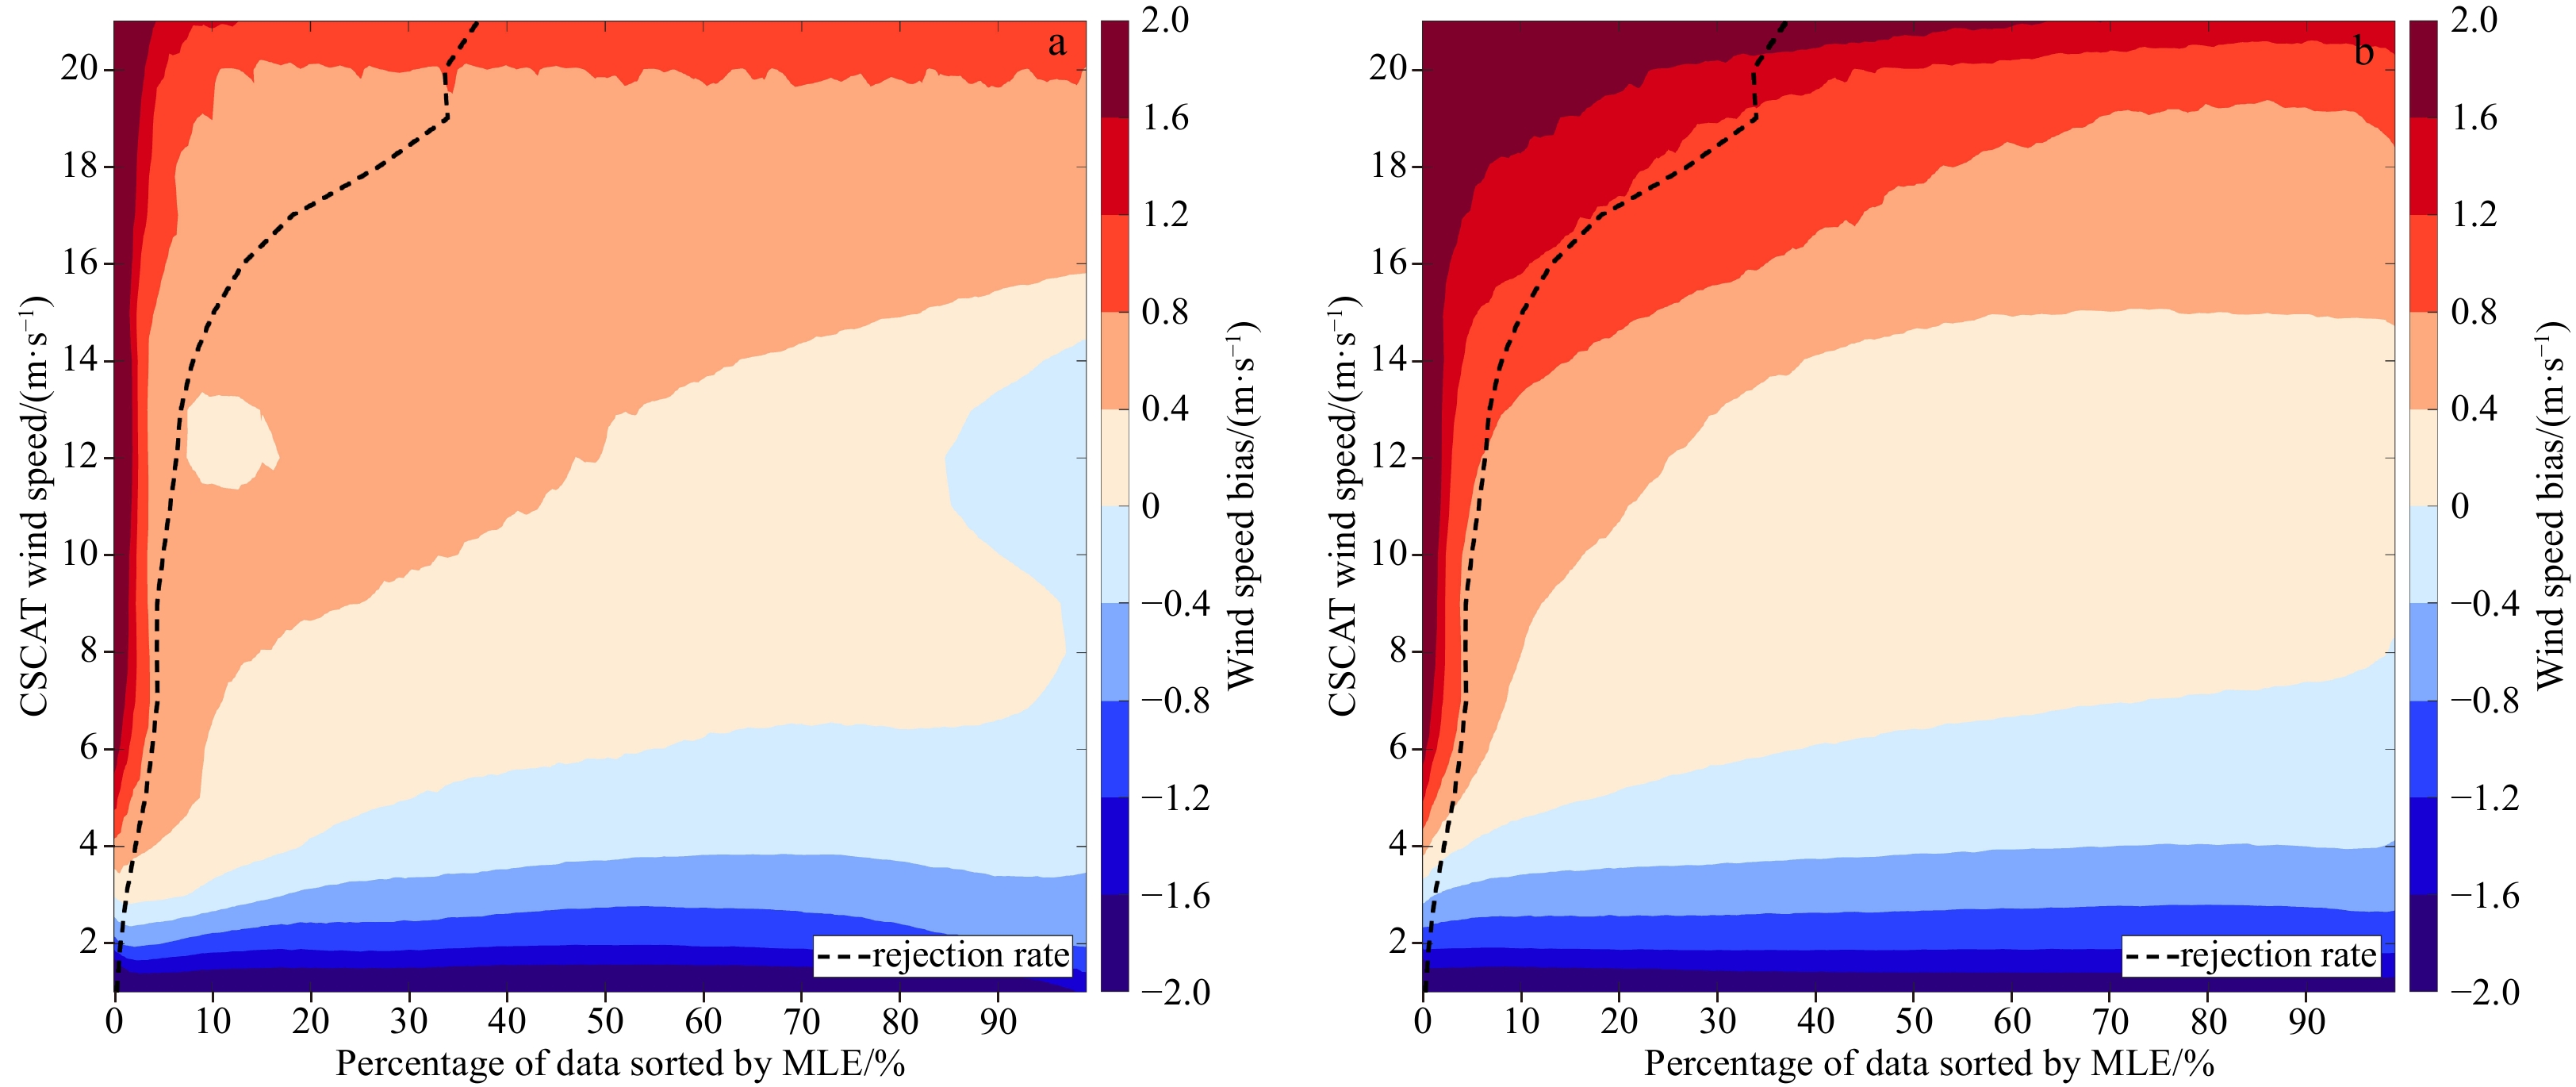
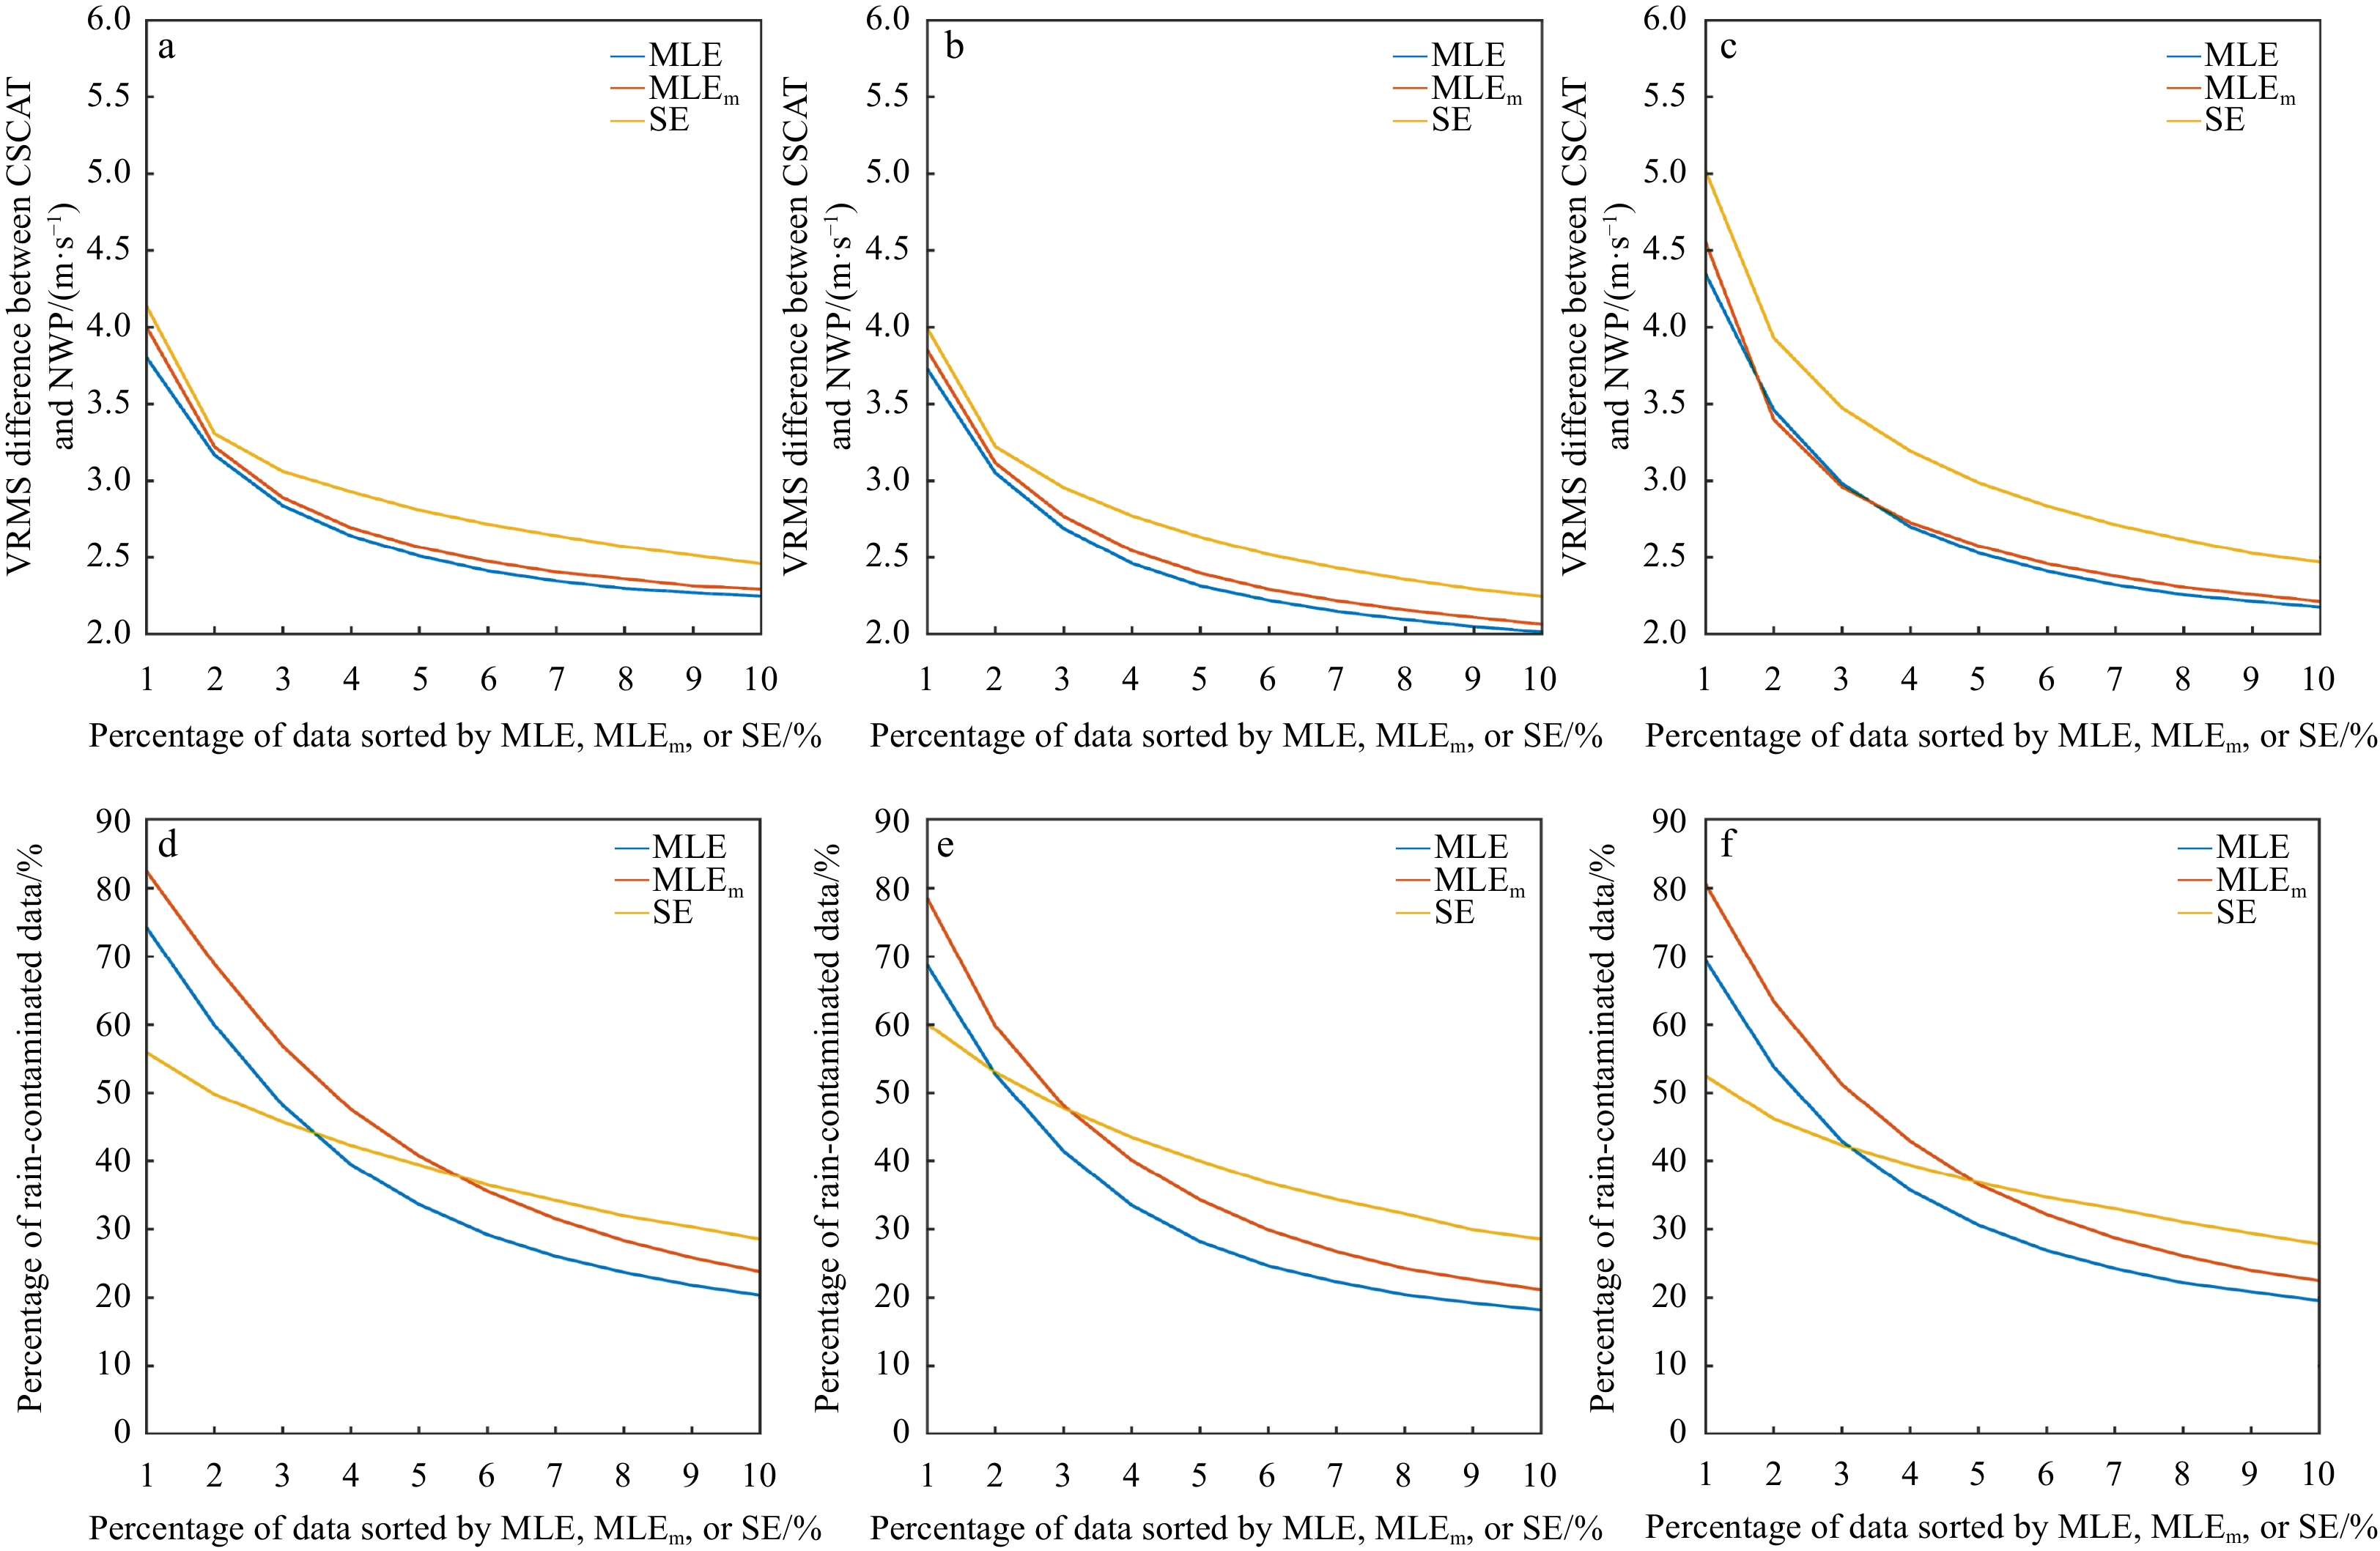
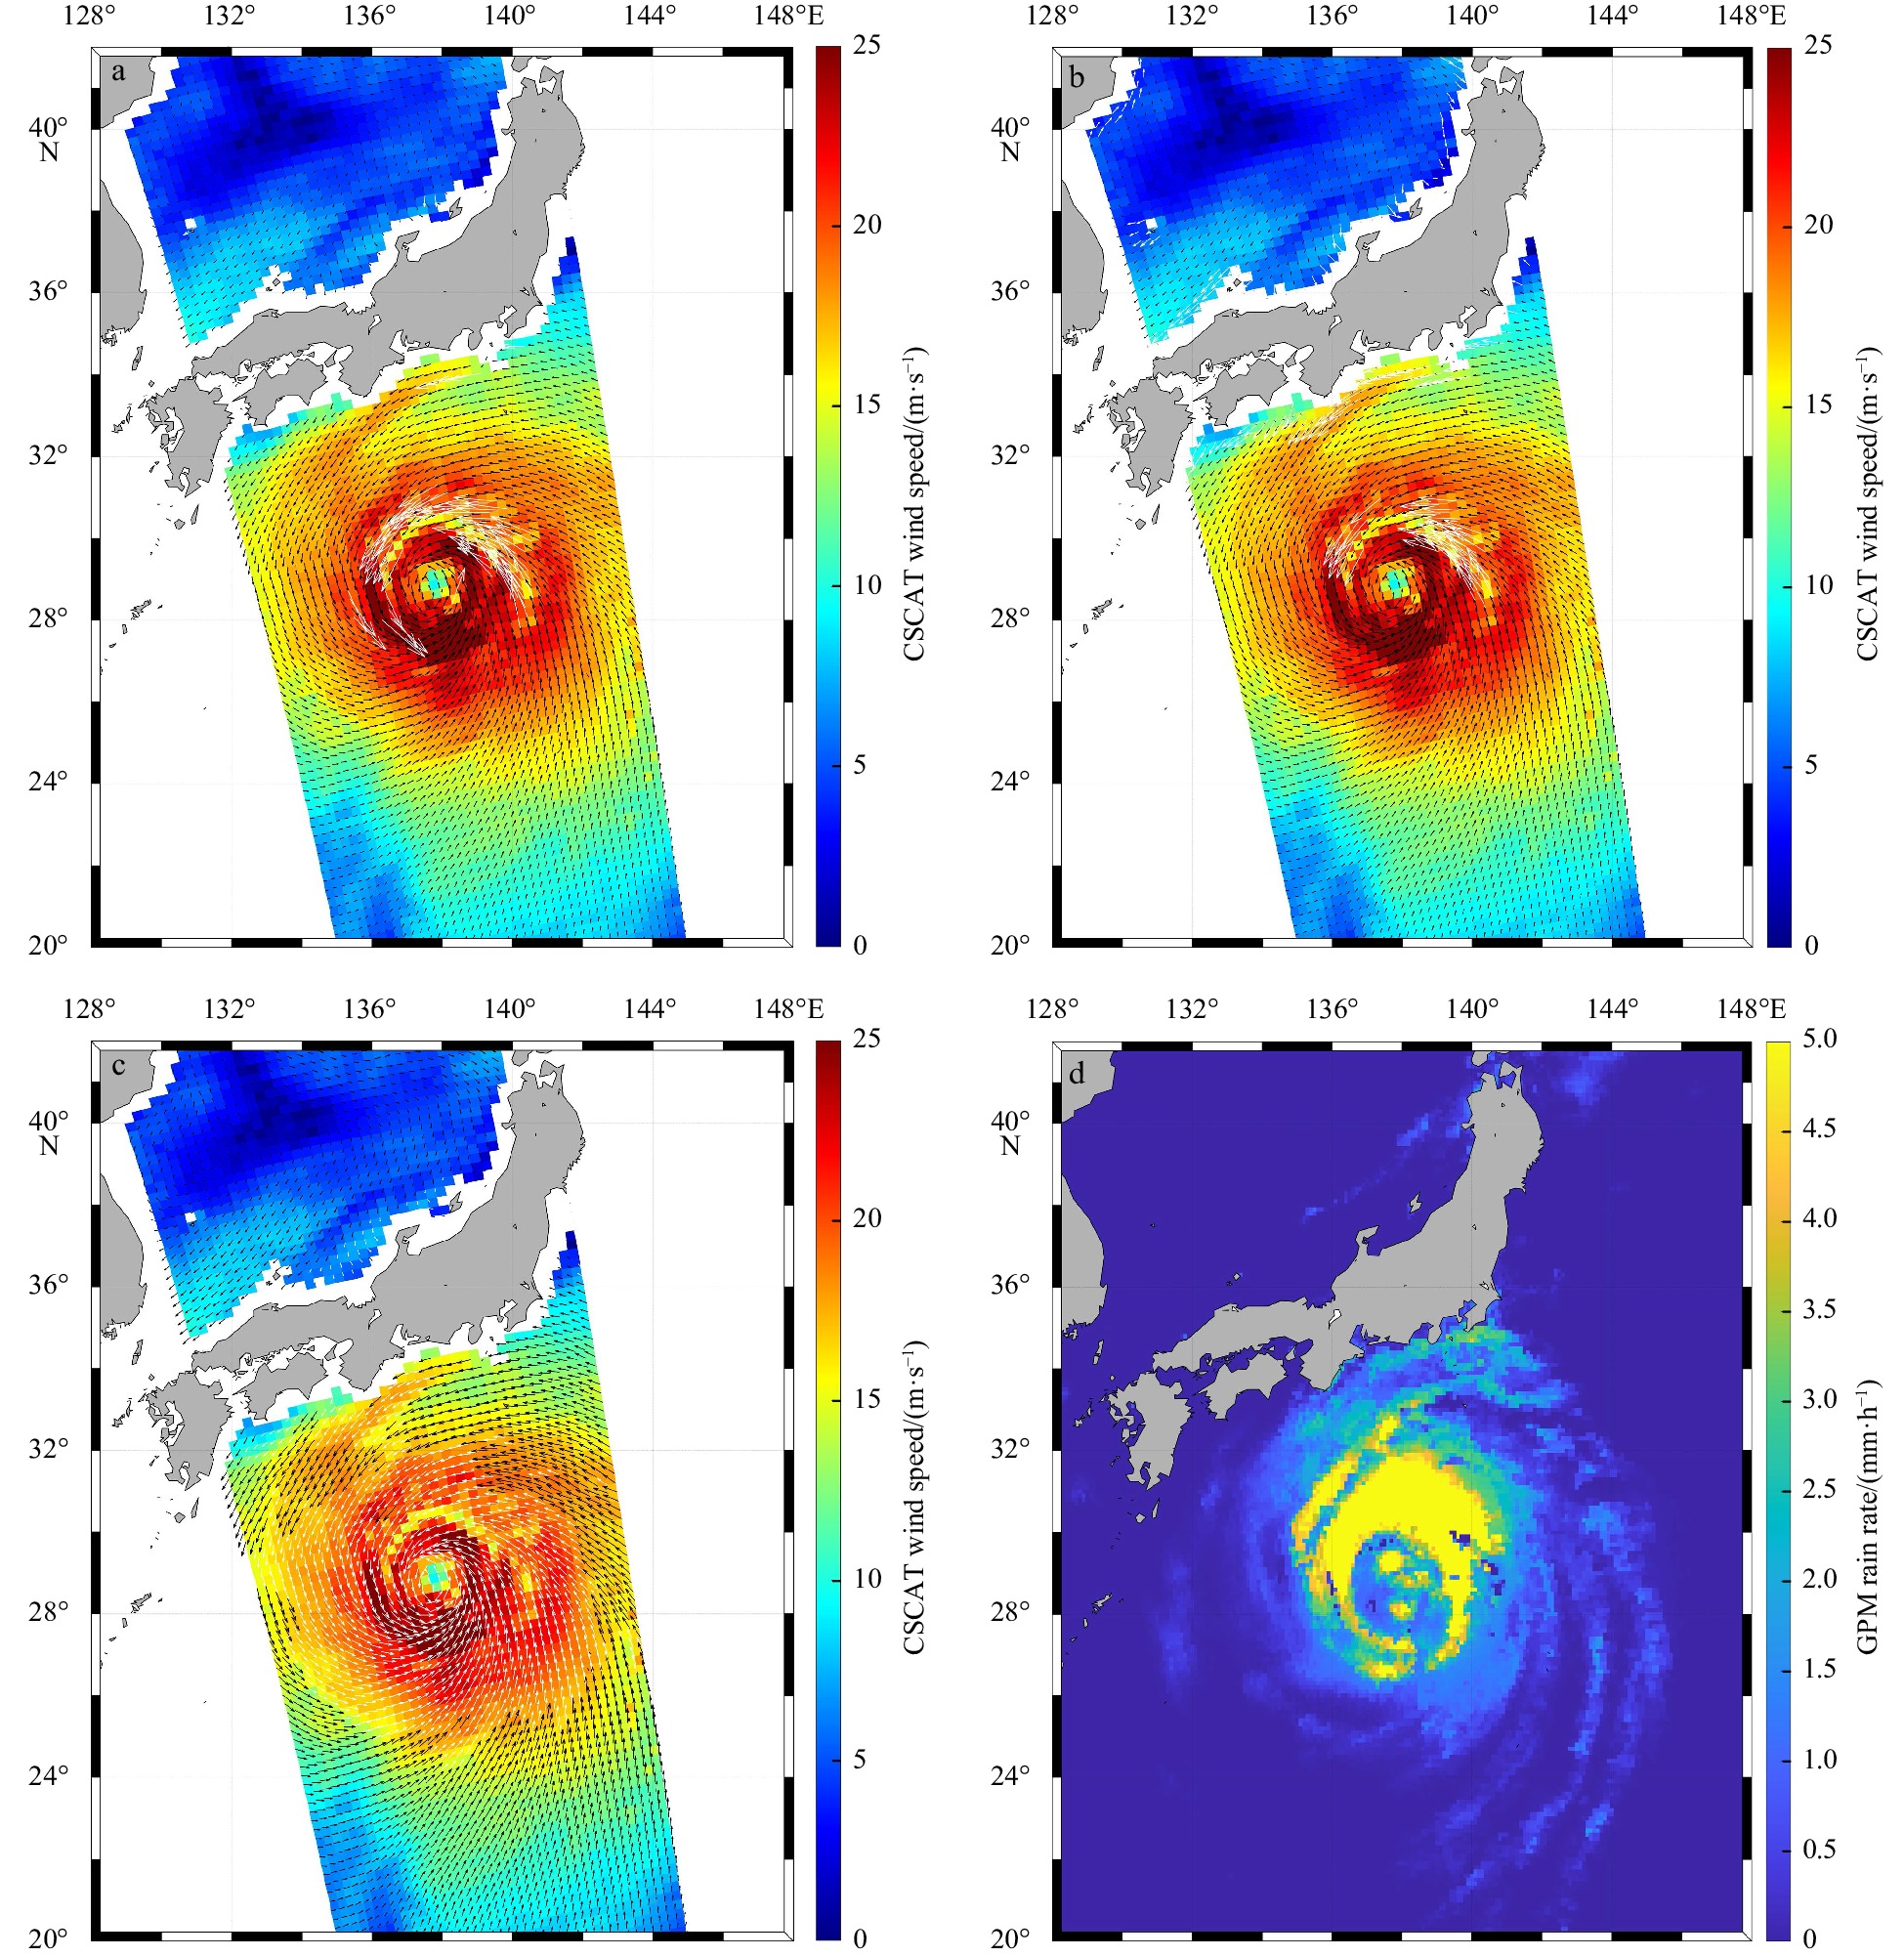
Quality control (QC) is an essential procedure in scatterometer wind retrieval, which is used to distinguish good-quality data from poor-quality wind vector cells (WVCs) for the sake of wind applications. The current wind processor of the China-France Oceanography Satellite (CFOSAT) scatterometer (CSCAT) adopts a maximum likelihood estimator (MLE)-based QC method to filter WVCs affected by geophysical noise, such as rainfall and wind variability. As the first Ku-band rotating fan-beam scatterometer, CSCAT can acquire up to 16 observations over a single WVC, giving abundant information with diverse incidence/azimuth angles, as such its MLE statistical characteristics may be different from the previous scatterometers. In this study, several QC indicators, including MLE, its spatially averaged value (MLEm), and the singularity exponents (SE), are analyzed using the collocated Global Precipitation Mission rainfall data as well as buoy data, to compare their sensitivity to rainfall and wind quality. The results show that wind error characteristics of CSCAT under different QC methods are similar to those of other Ku-band scatterometers, i.e., SE is more suitable than other parameters for the wind QC at outer-swath and nadir regions, while MLEm is the best QC indicator for the sweet region WVCs. Specifically, SE is much more favorable than others at high wind speeds. By combining different indicators, an improved QC method is developed for CSCAT. The validation with the collocated buoy data shows that it accepts more WVCs, and in turn, improves the quality control of CSCAT wind data.
Quality control (QC) is an essential procedure in scatterometer wind retrieval, which is used to distinguish good-quality data from poor-quality wind vector cells (WVCs) for the sake of wind applications. The current wind processor of the China-France Oceanography Satellite (CFOSAT) scatterometer (CSCAT) adopts a maximum likelihood estimator (MLE)-based QC method to filter WVCs affected by geophysical noise, such as rainfall and wind variability. As the first Ku-band rotating fan-beam scatterometer, CSCAT can acquire up to 16 observations over a single WVC, giving abundant information with diverse incidence/azimuth angles, as such its MLE statistical characteristics may be different from the previous scatterometers. In this study, several QC indicators, including MLE, its spatially averaged value (MLEm), and the singularity exponents (SE), are analyzed using the collocated Global Precipitation Mission rainfall data as well as buoy data, to compare their sensitivity to rainfall and wind quality. The results show that wind error characteristics of CSCAT under different QC methods are similar to those of other Ku-band scatterometers, i.e., SE is more suitable than other parameters for the wind QC at outer-swath and nadir regions, while MLEm is the best QC indicator for the sweet region WVCs. Specifically, SE is much more favorable than others at high wind speeds. By combining different indicators, an improved QC method is developed for CSCAT. The validation with the collocated buoy data shows that it accepts more WVCs, and in turn, improves the quality control of CSCAT wind data.


2024, 43(5): 110-120.
doi: 10.1007/s13131-024-2328-5
Abstract:
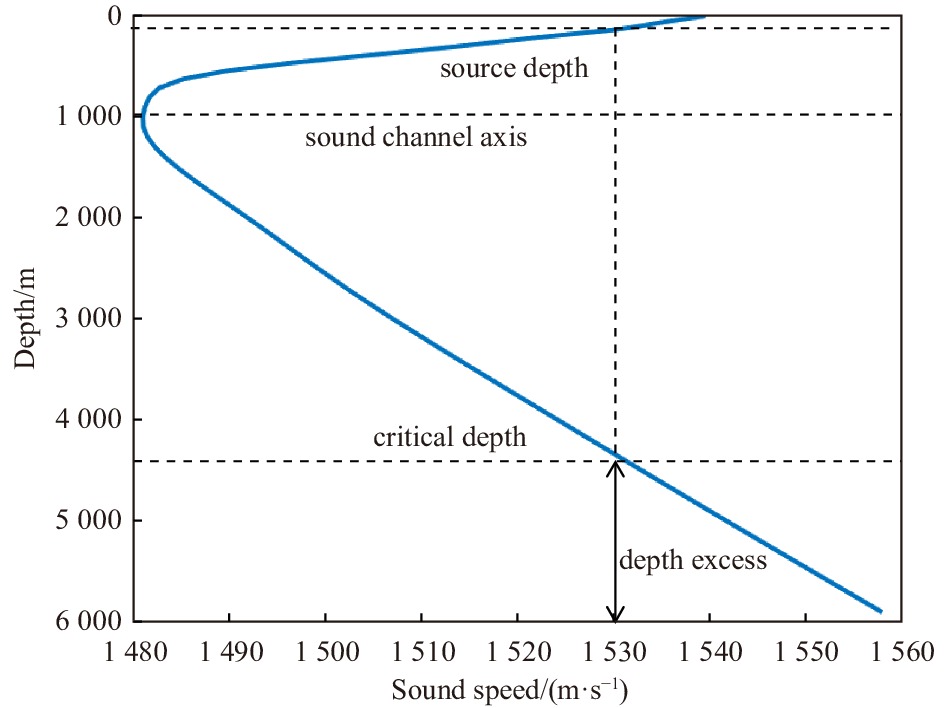
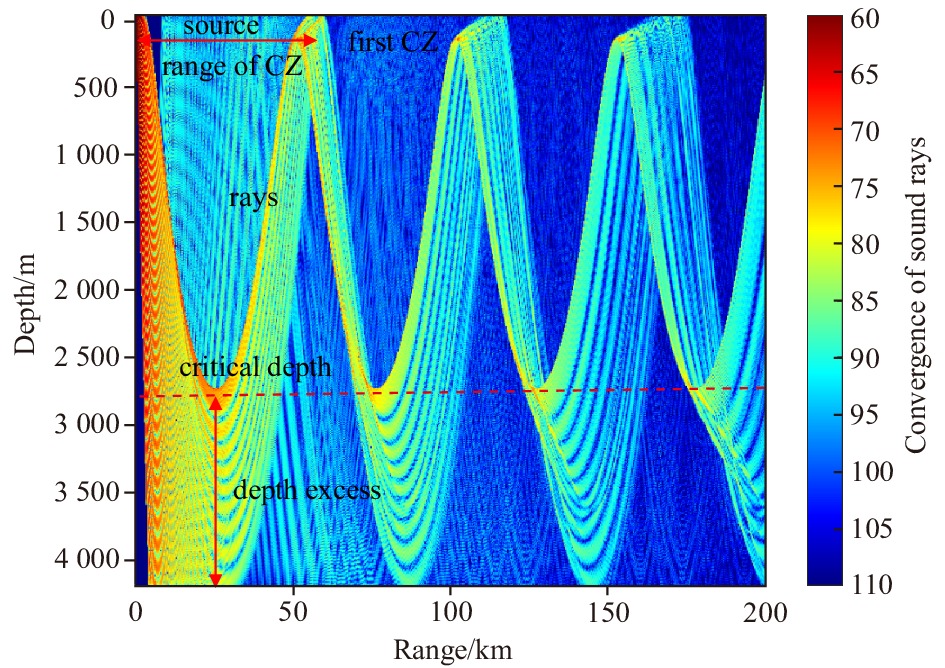
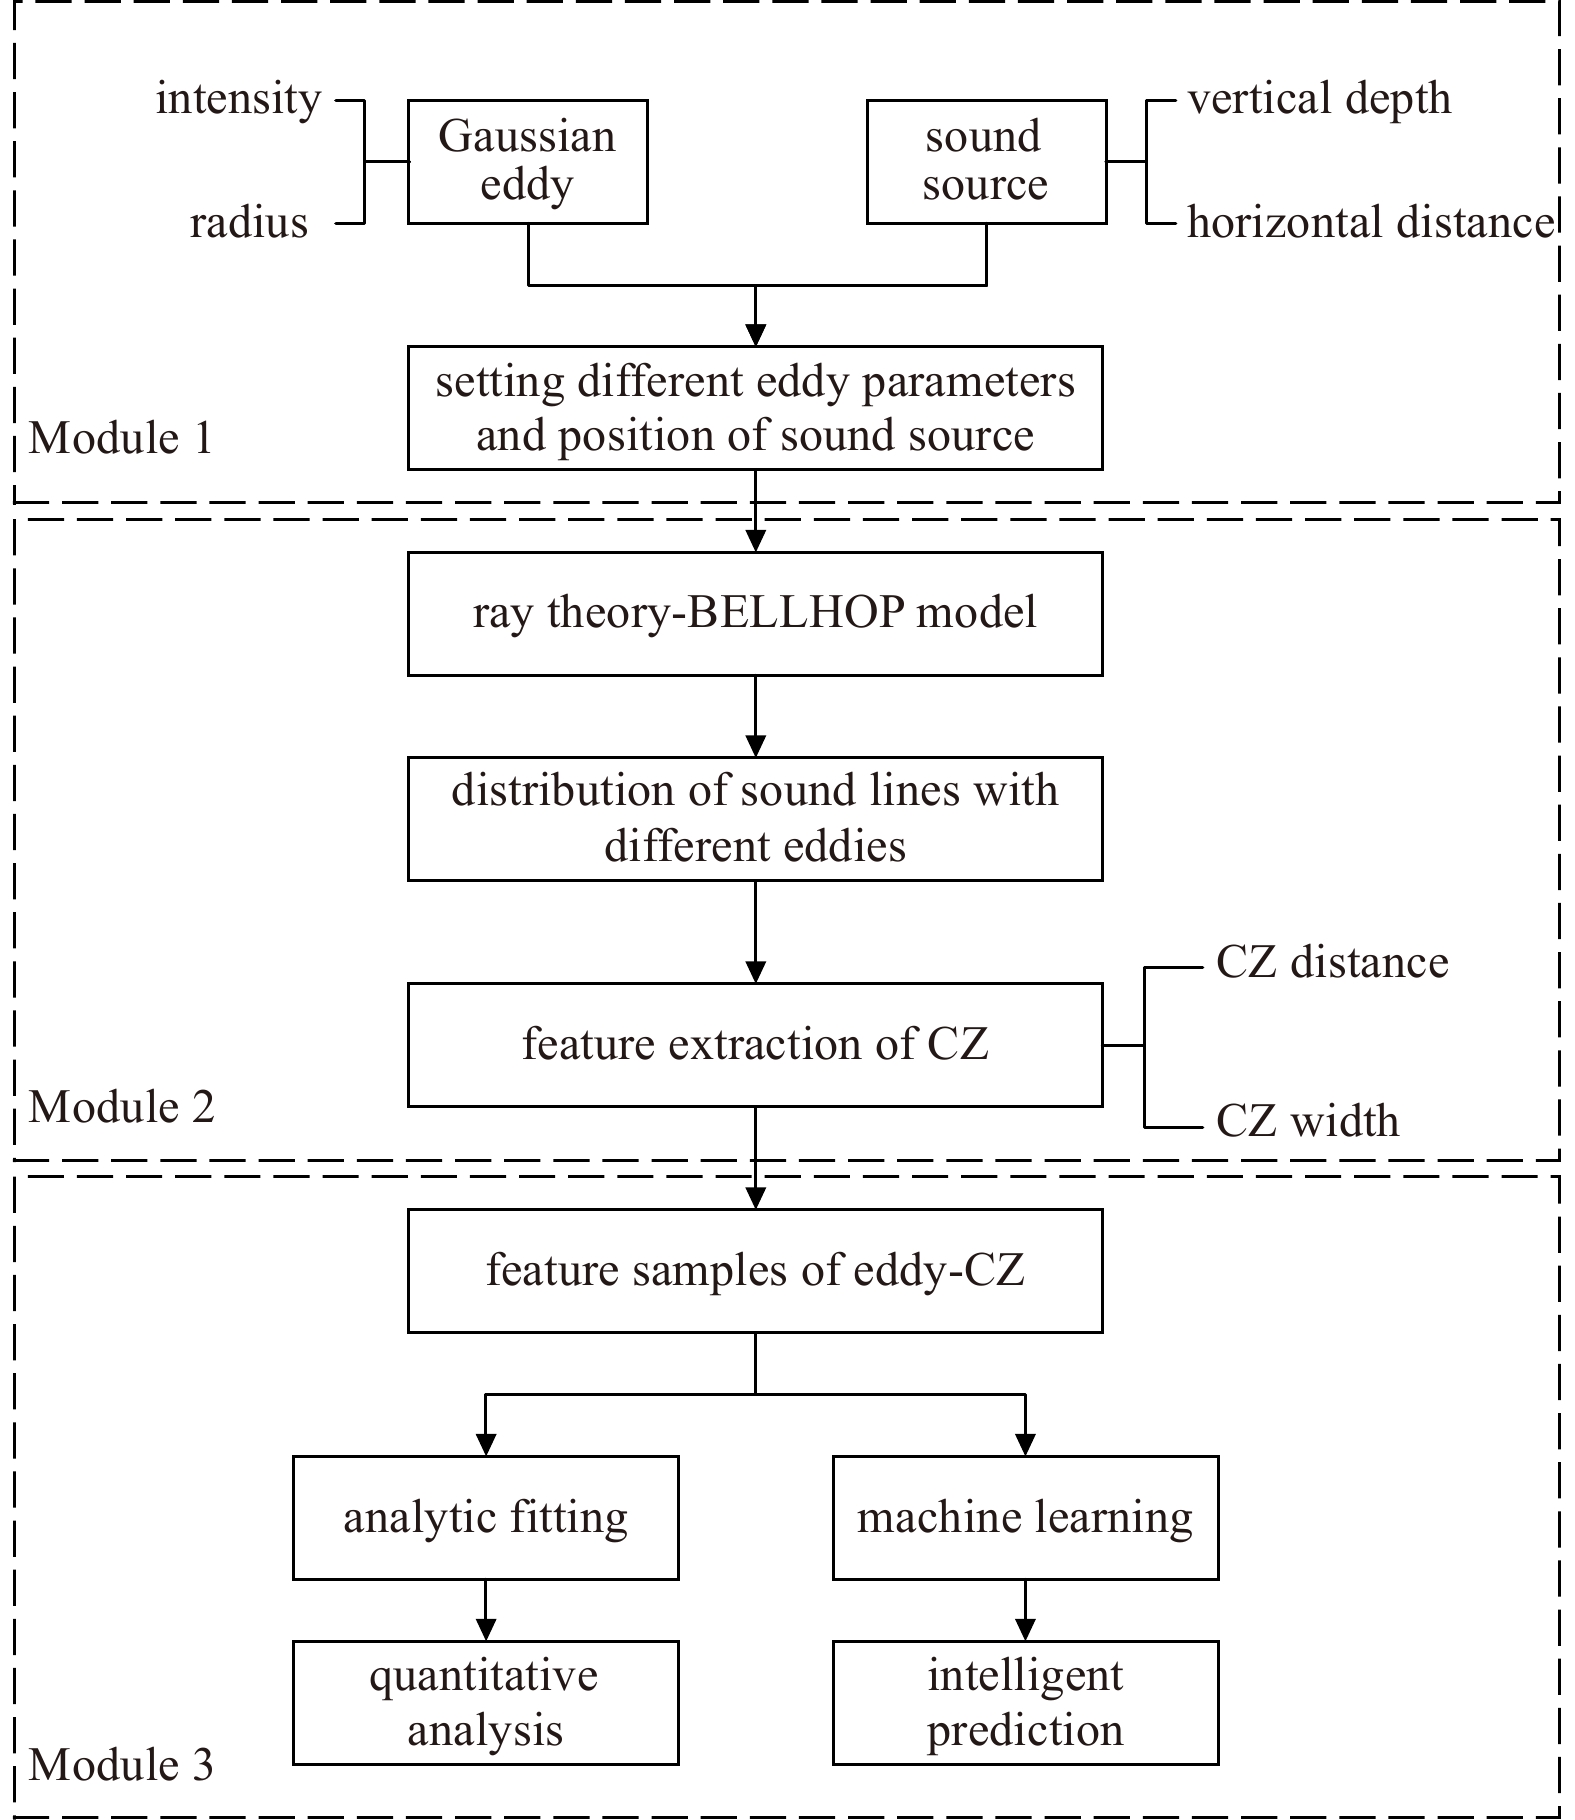
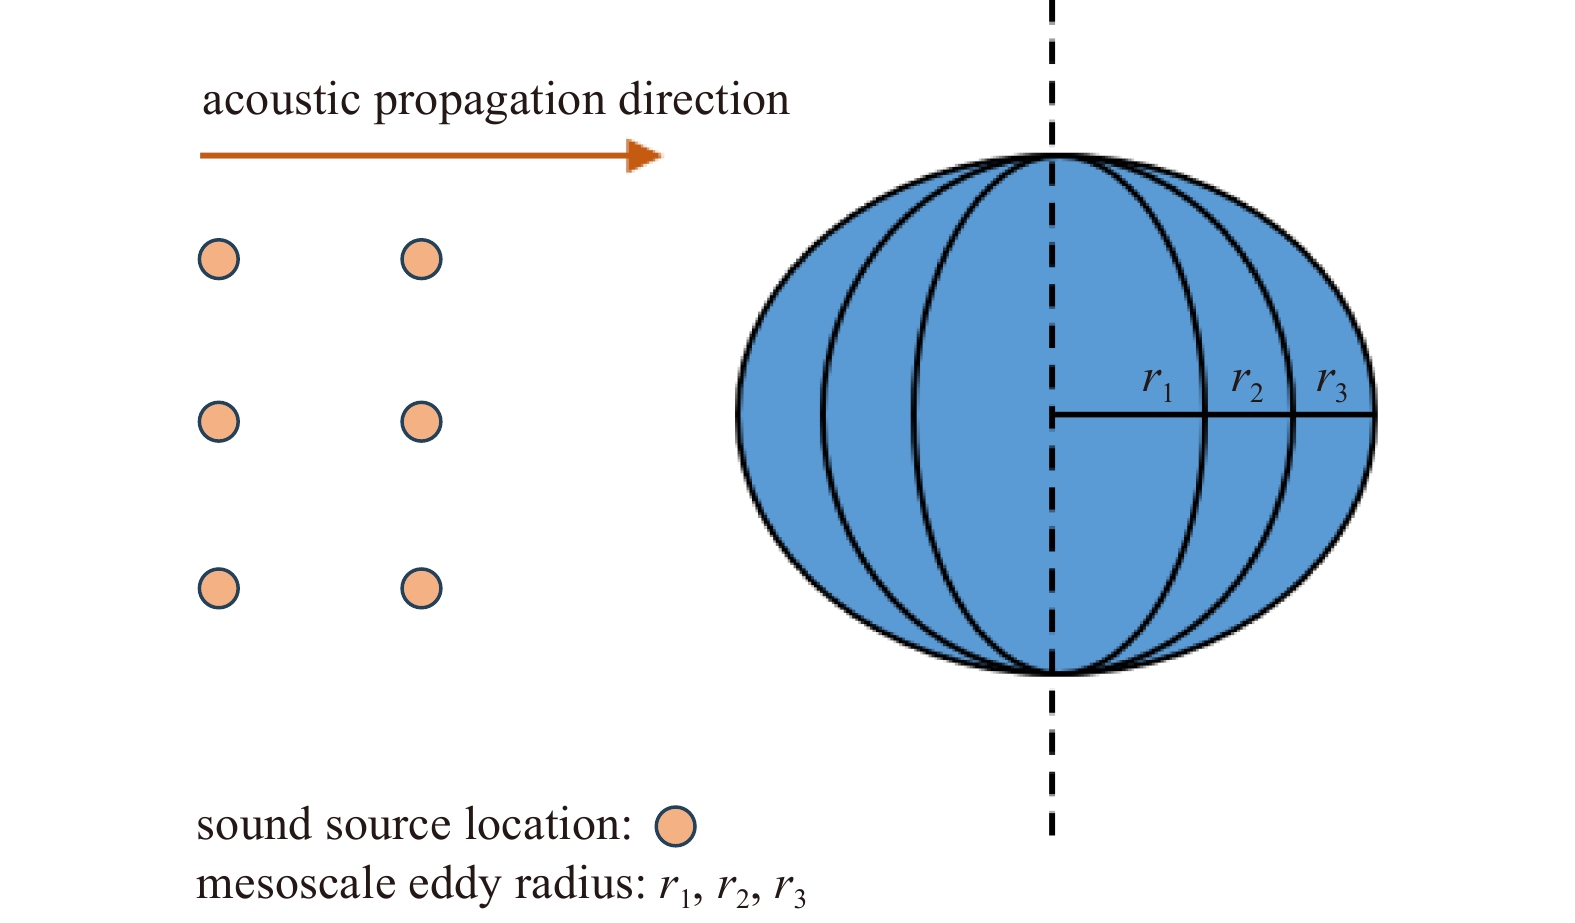
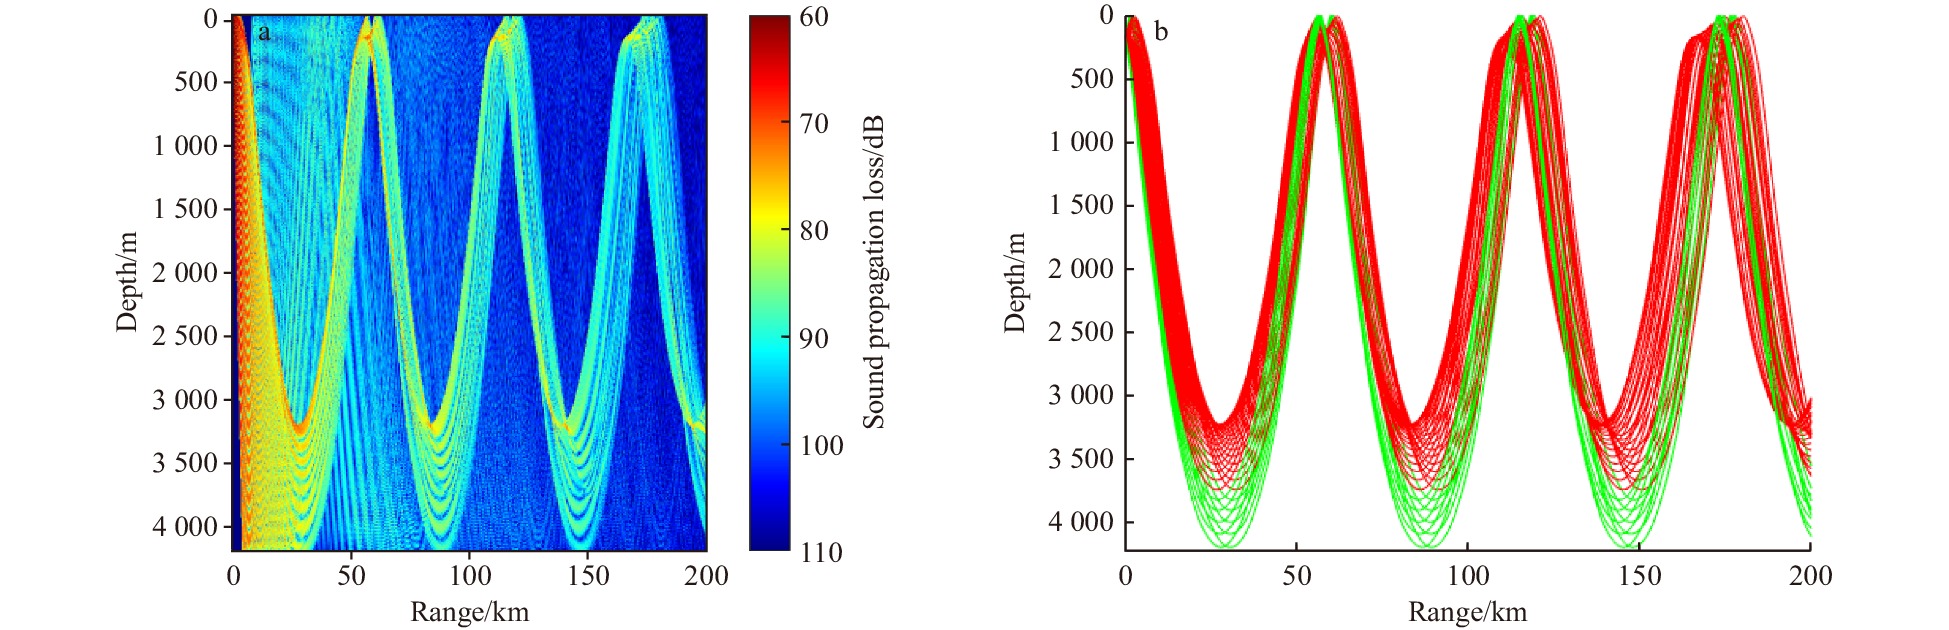
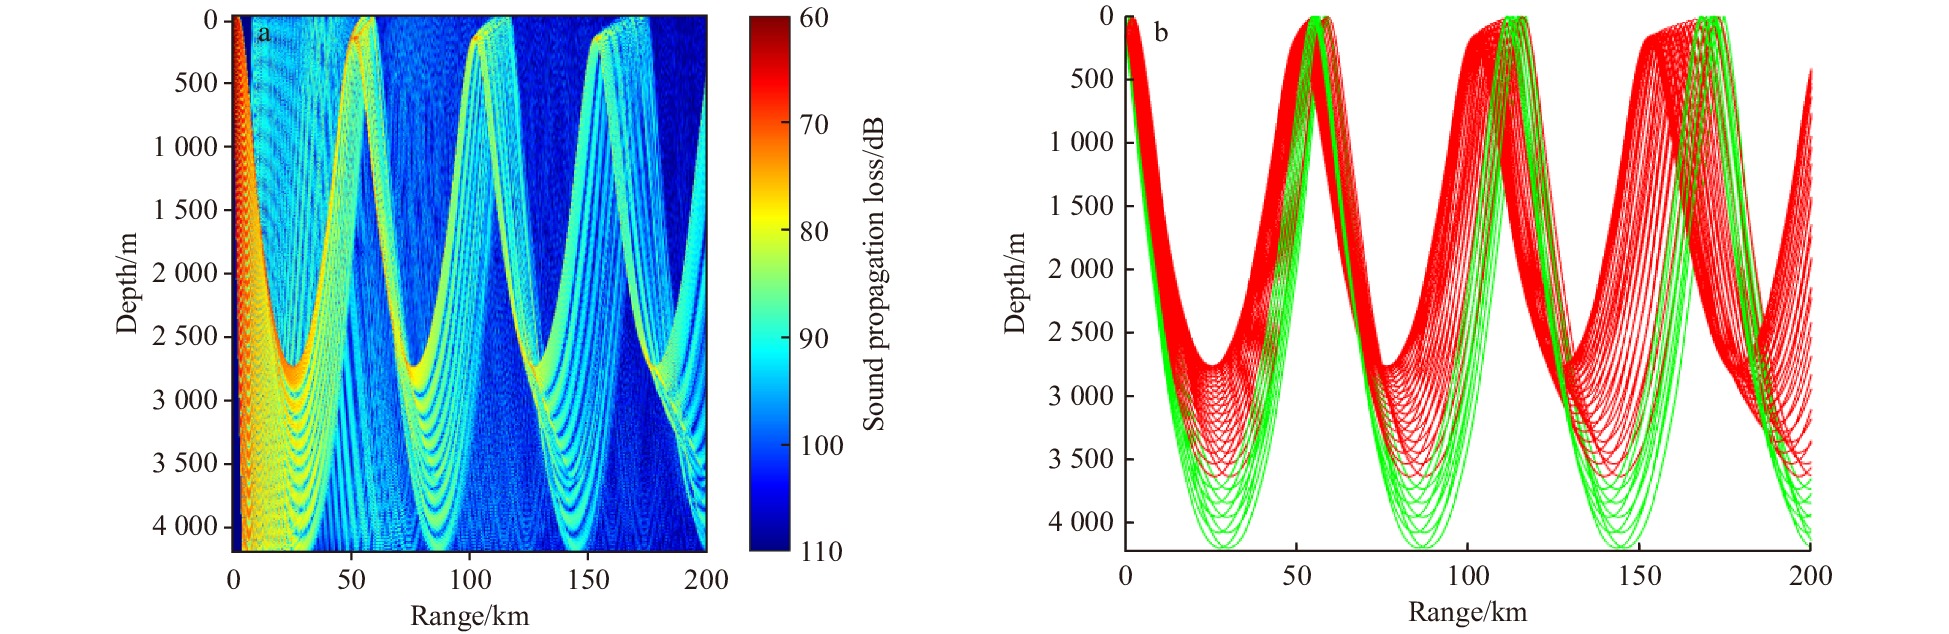
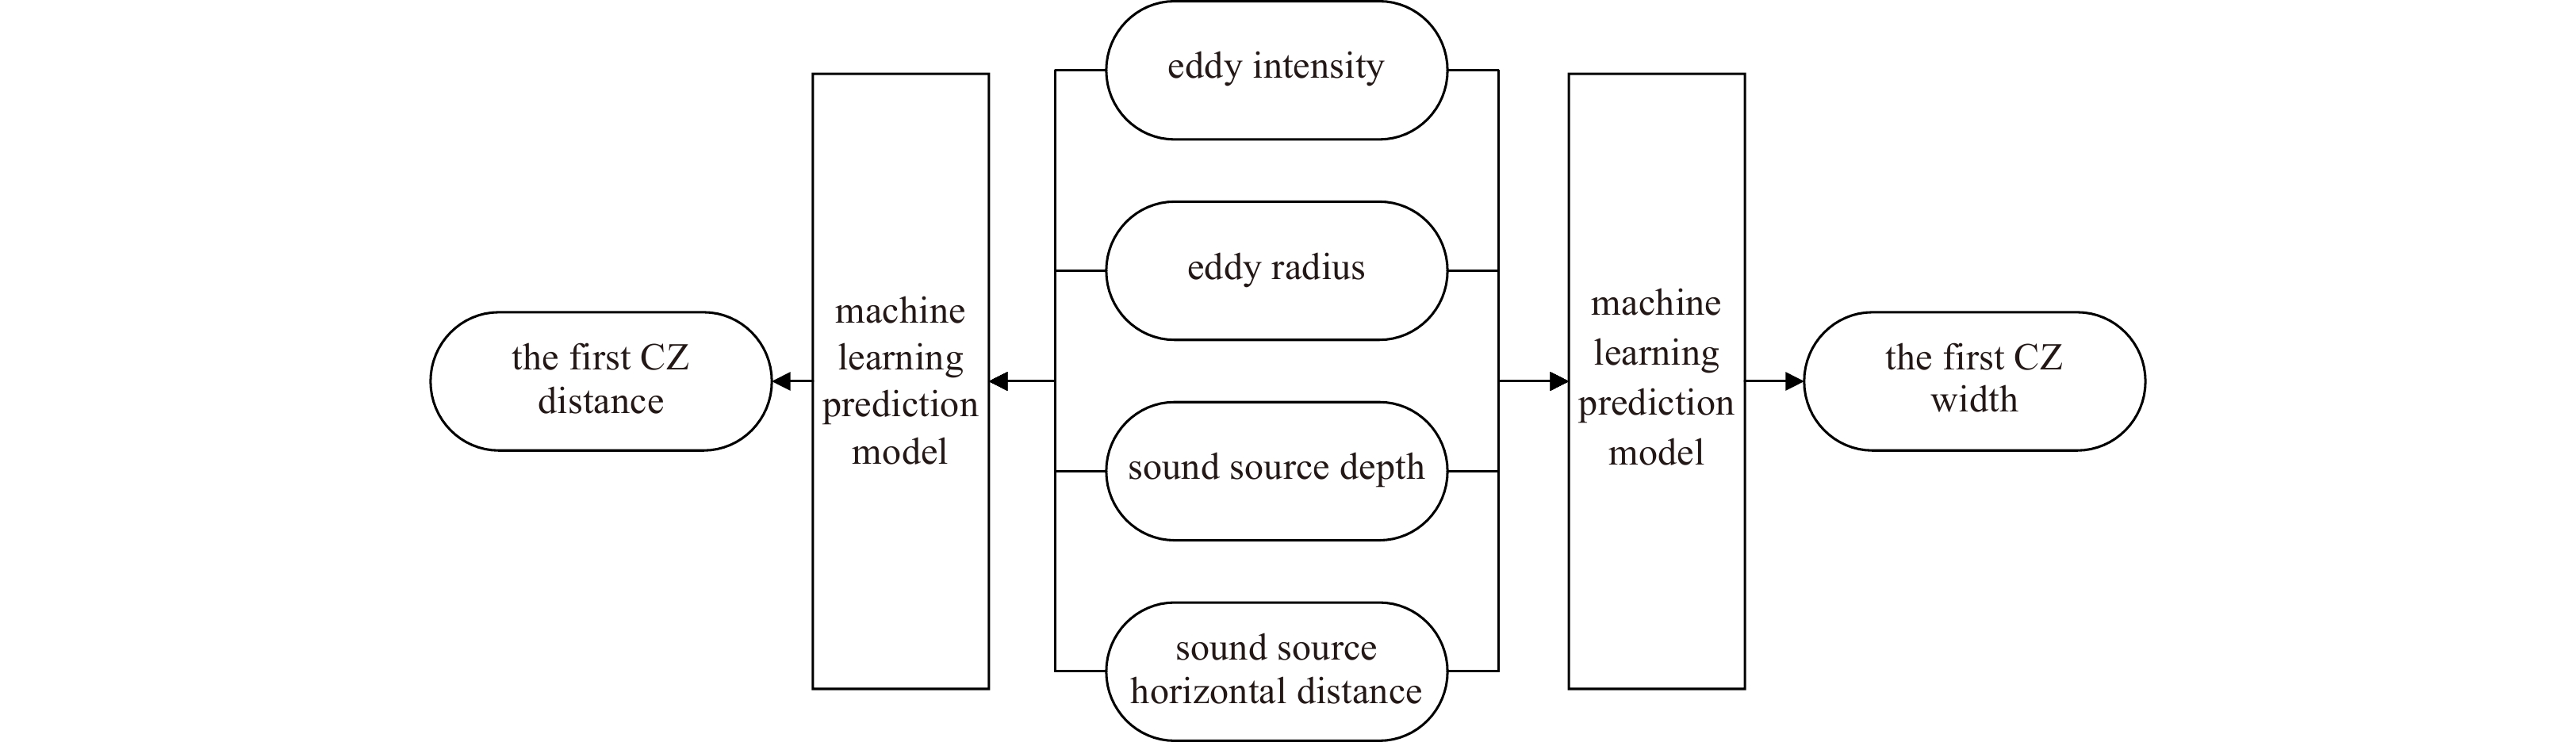
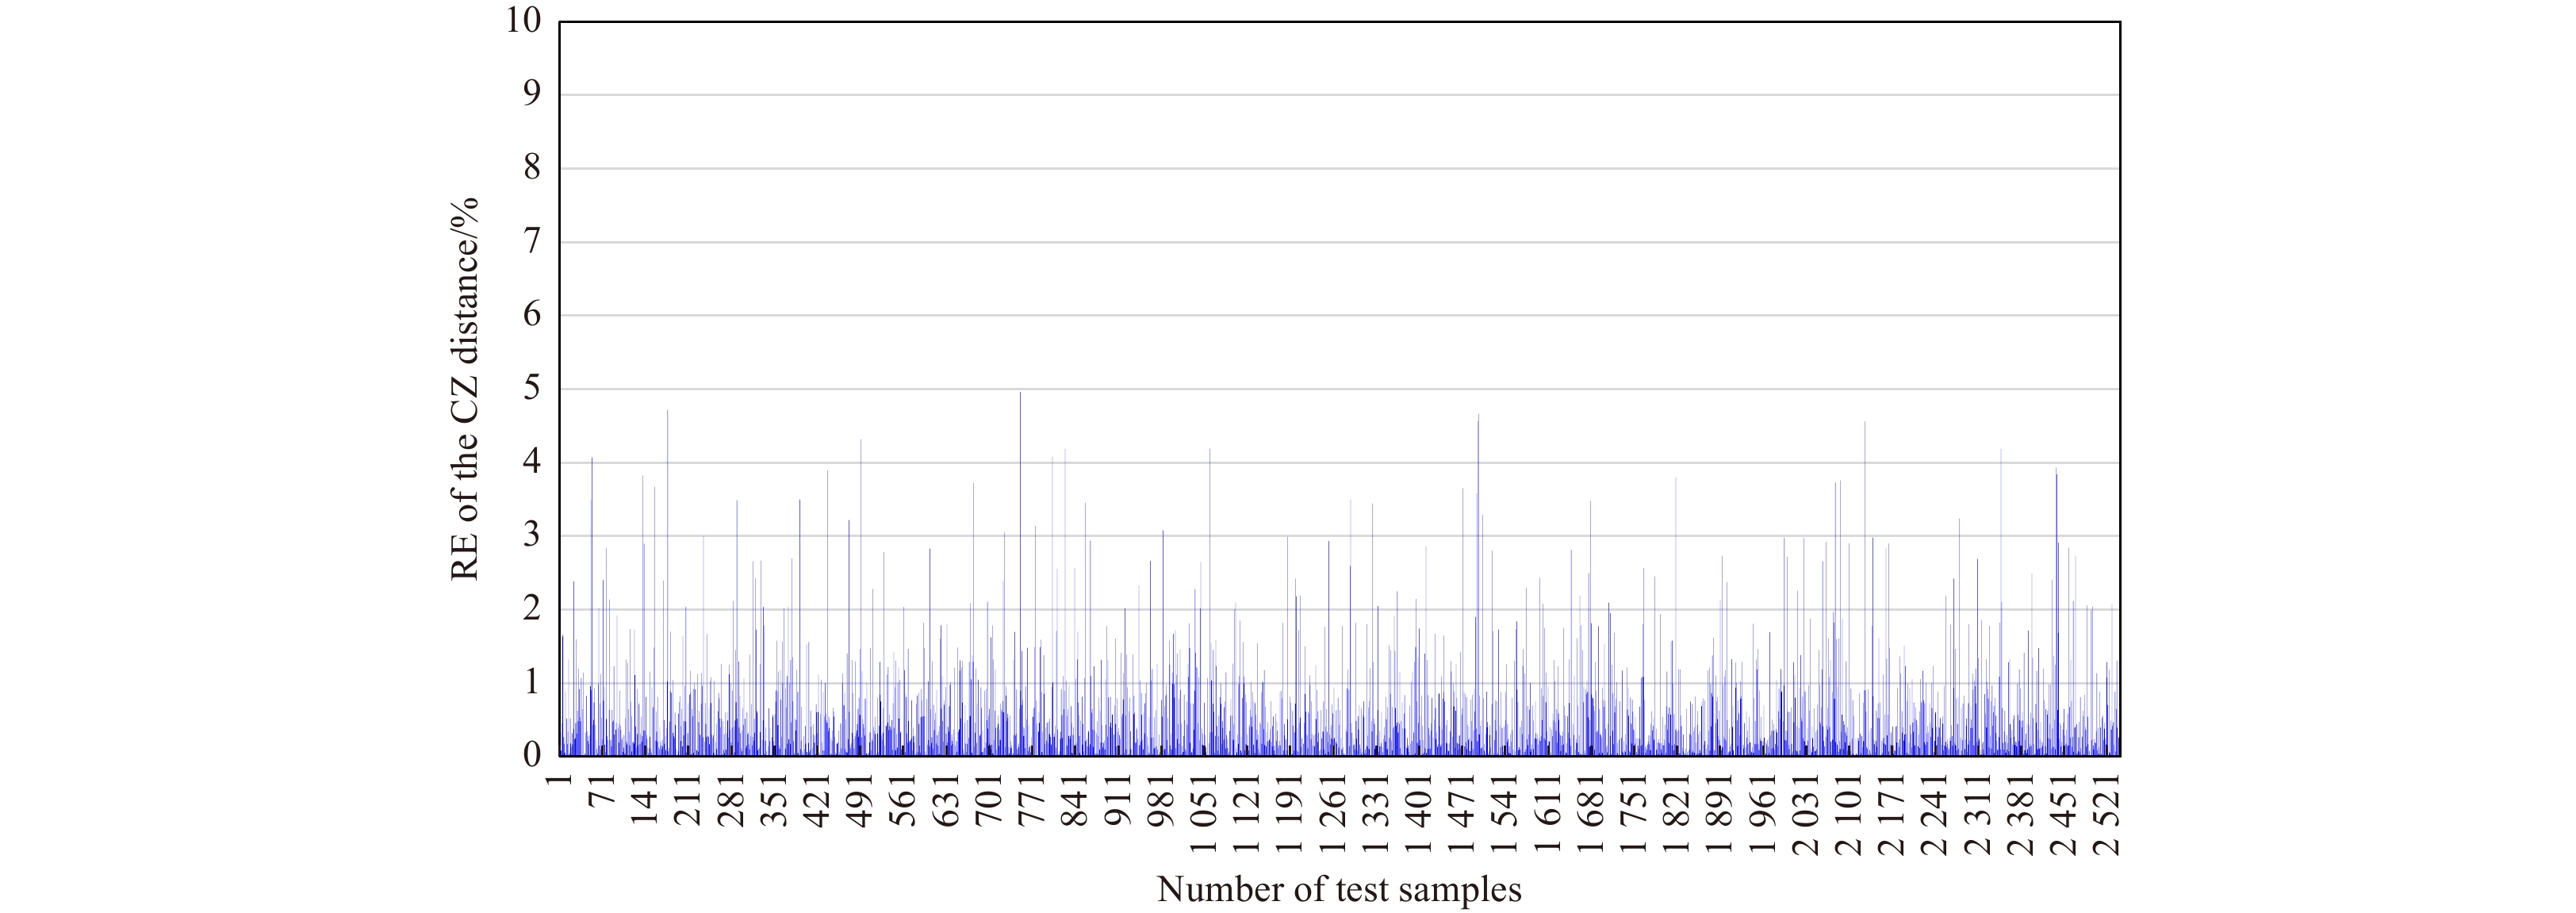
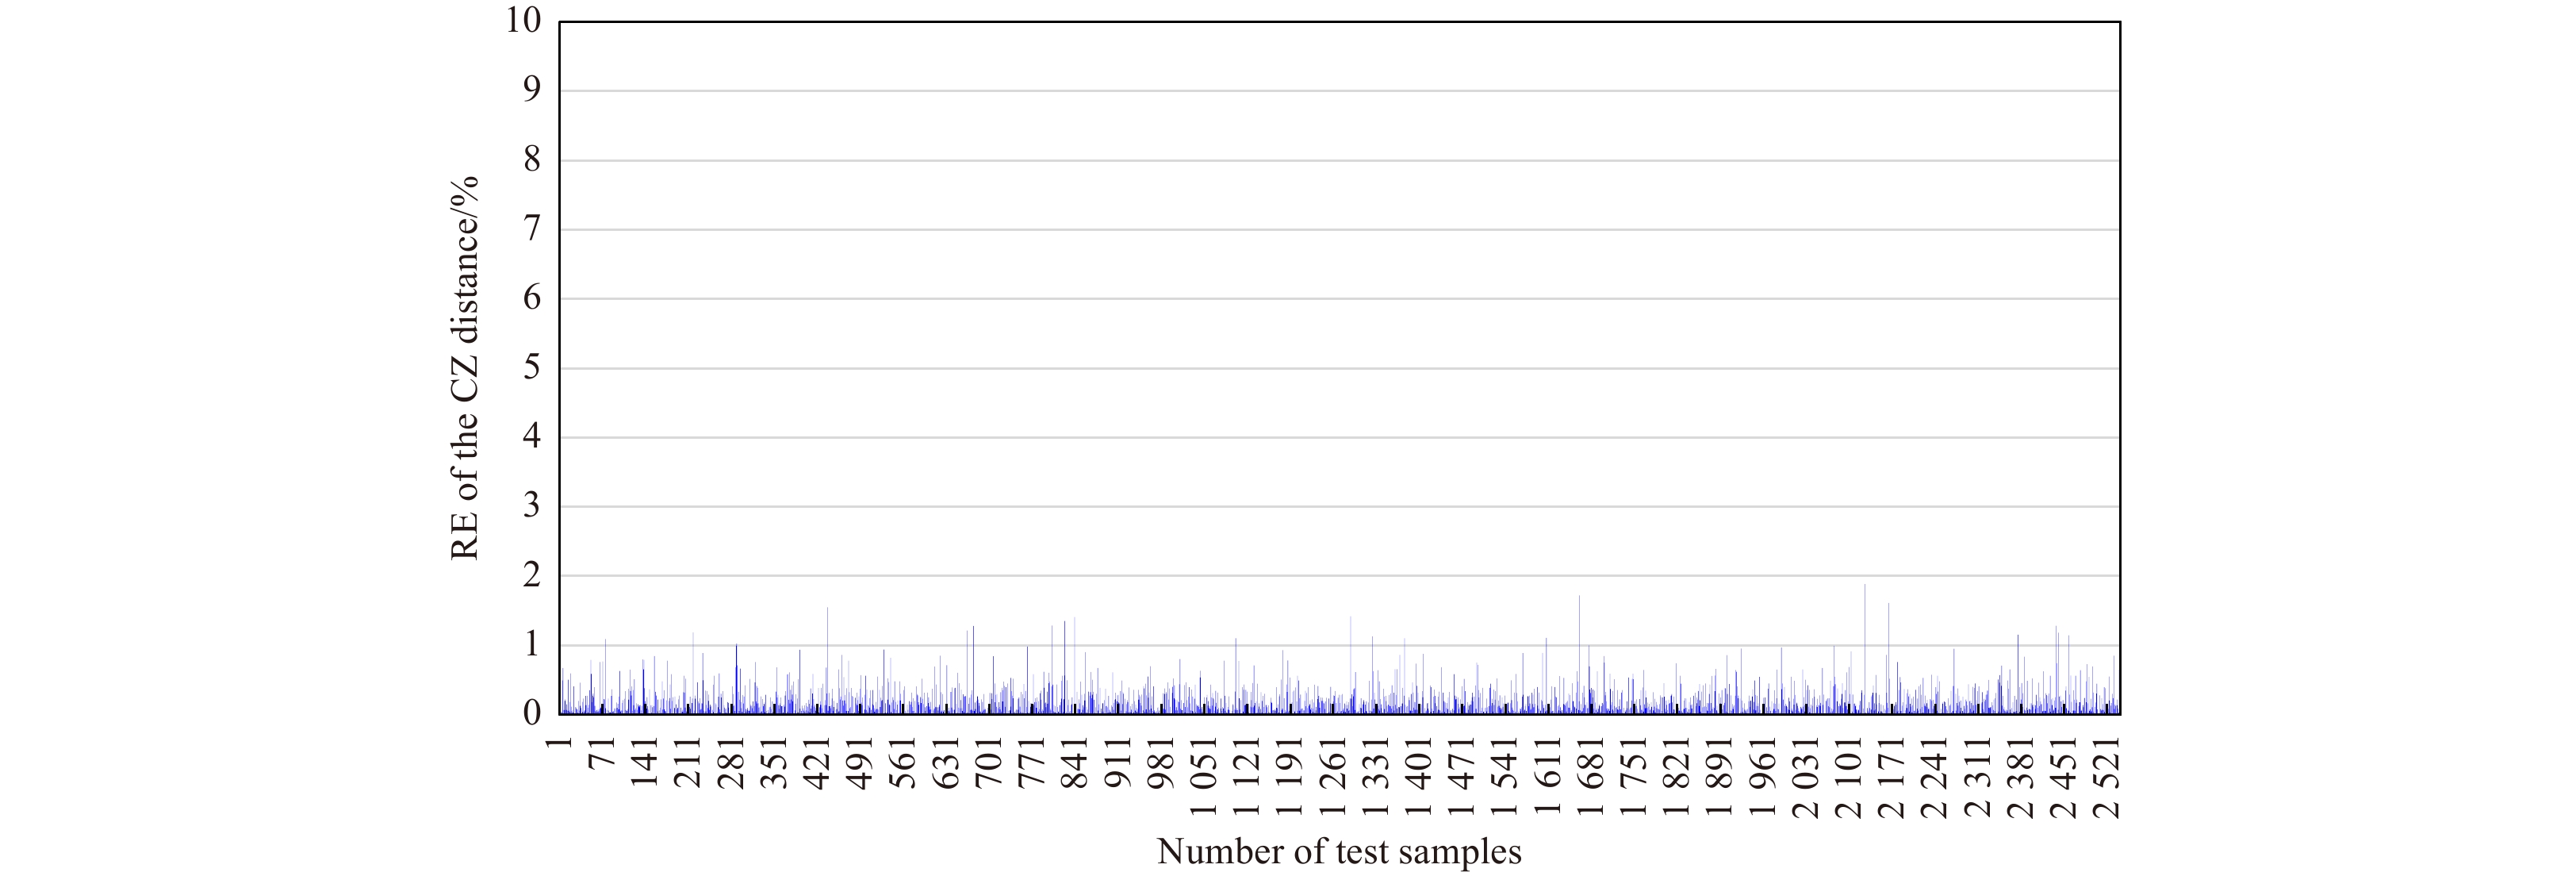
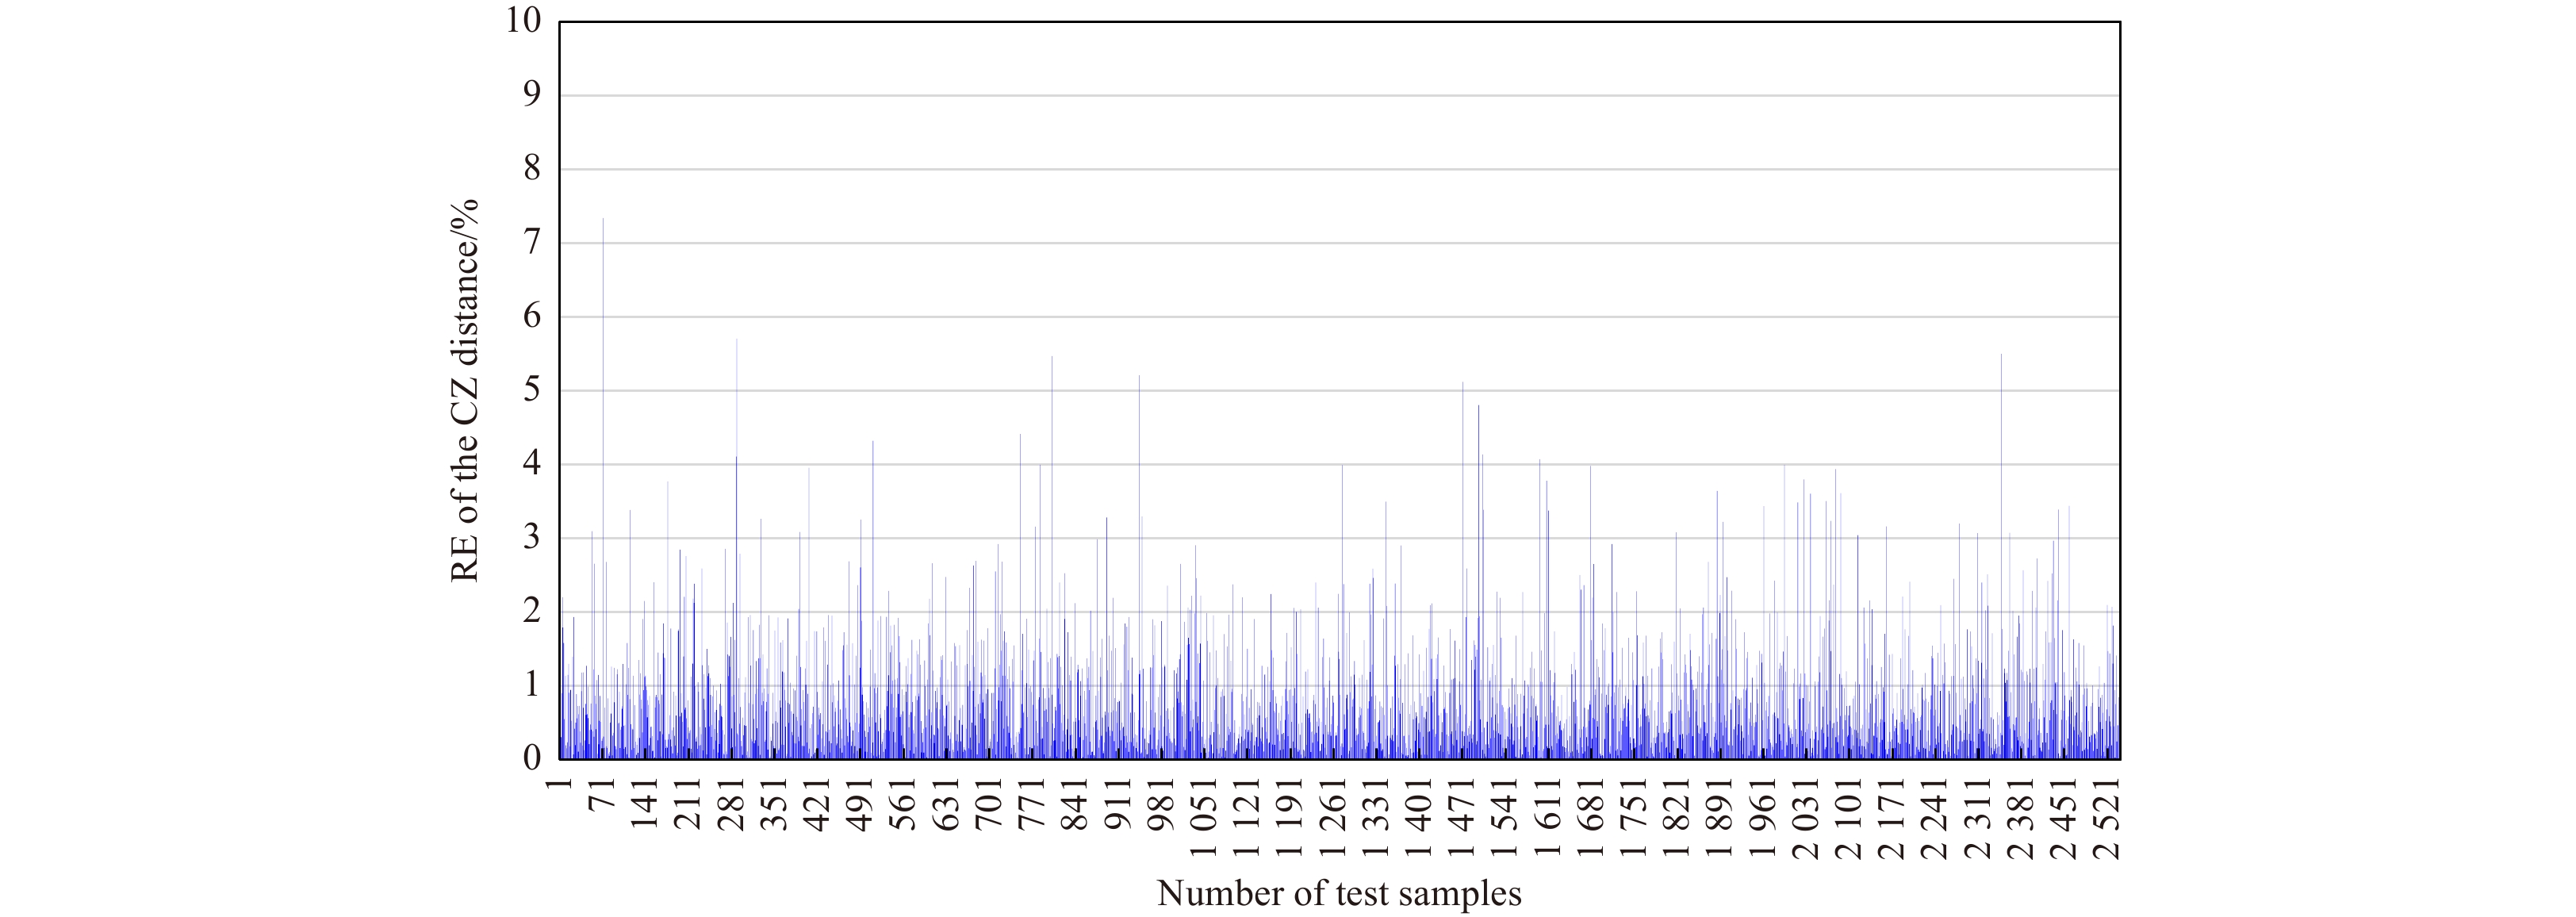
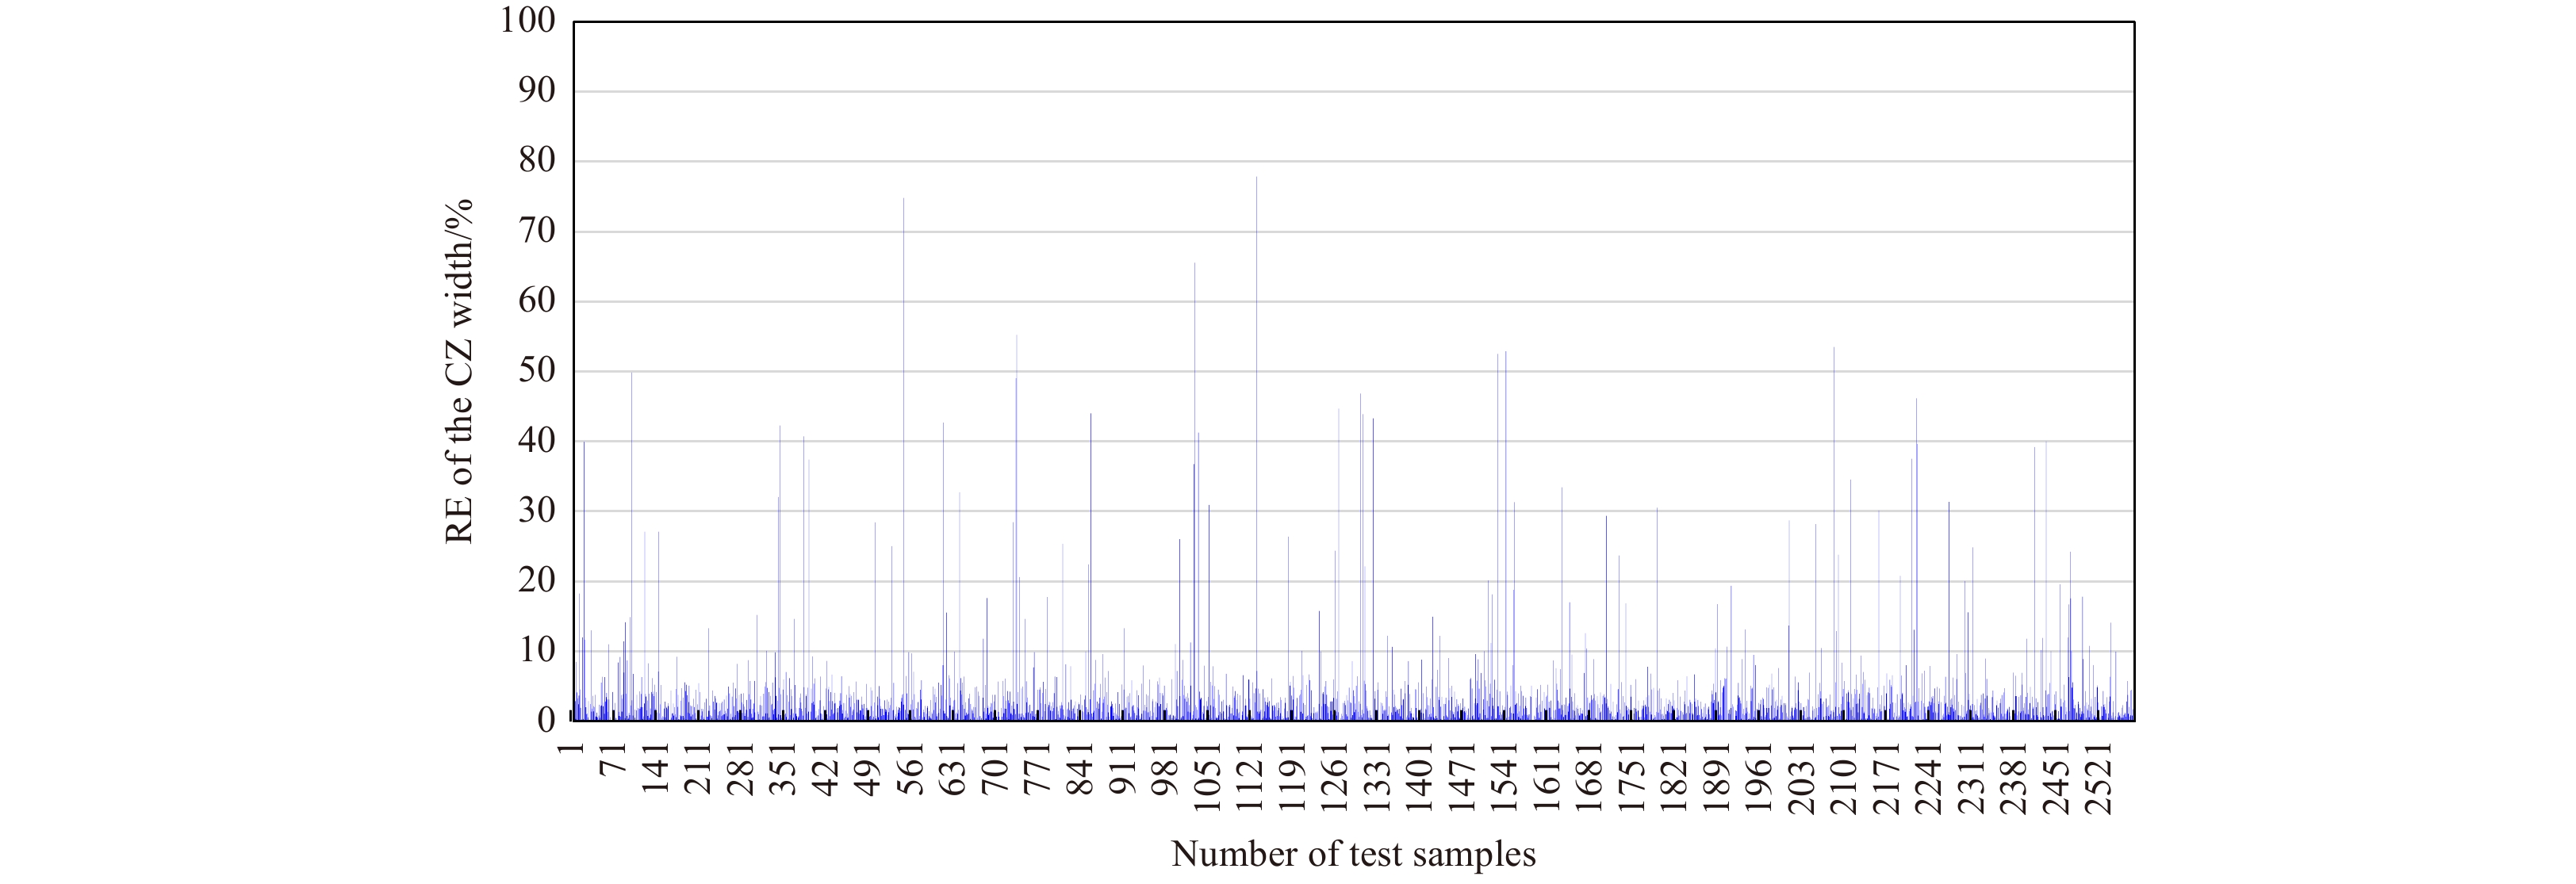
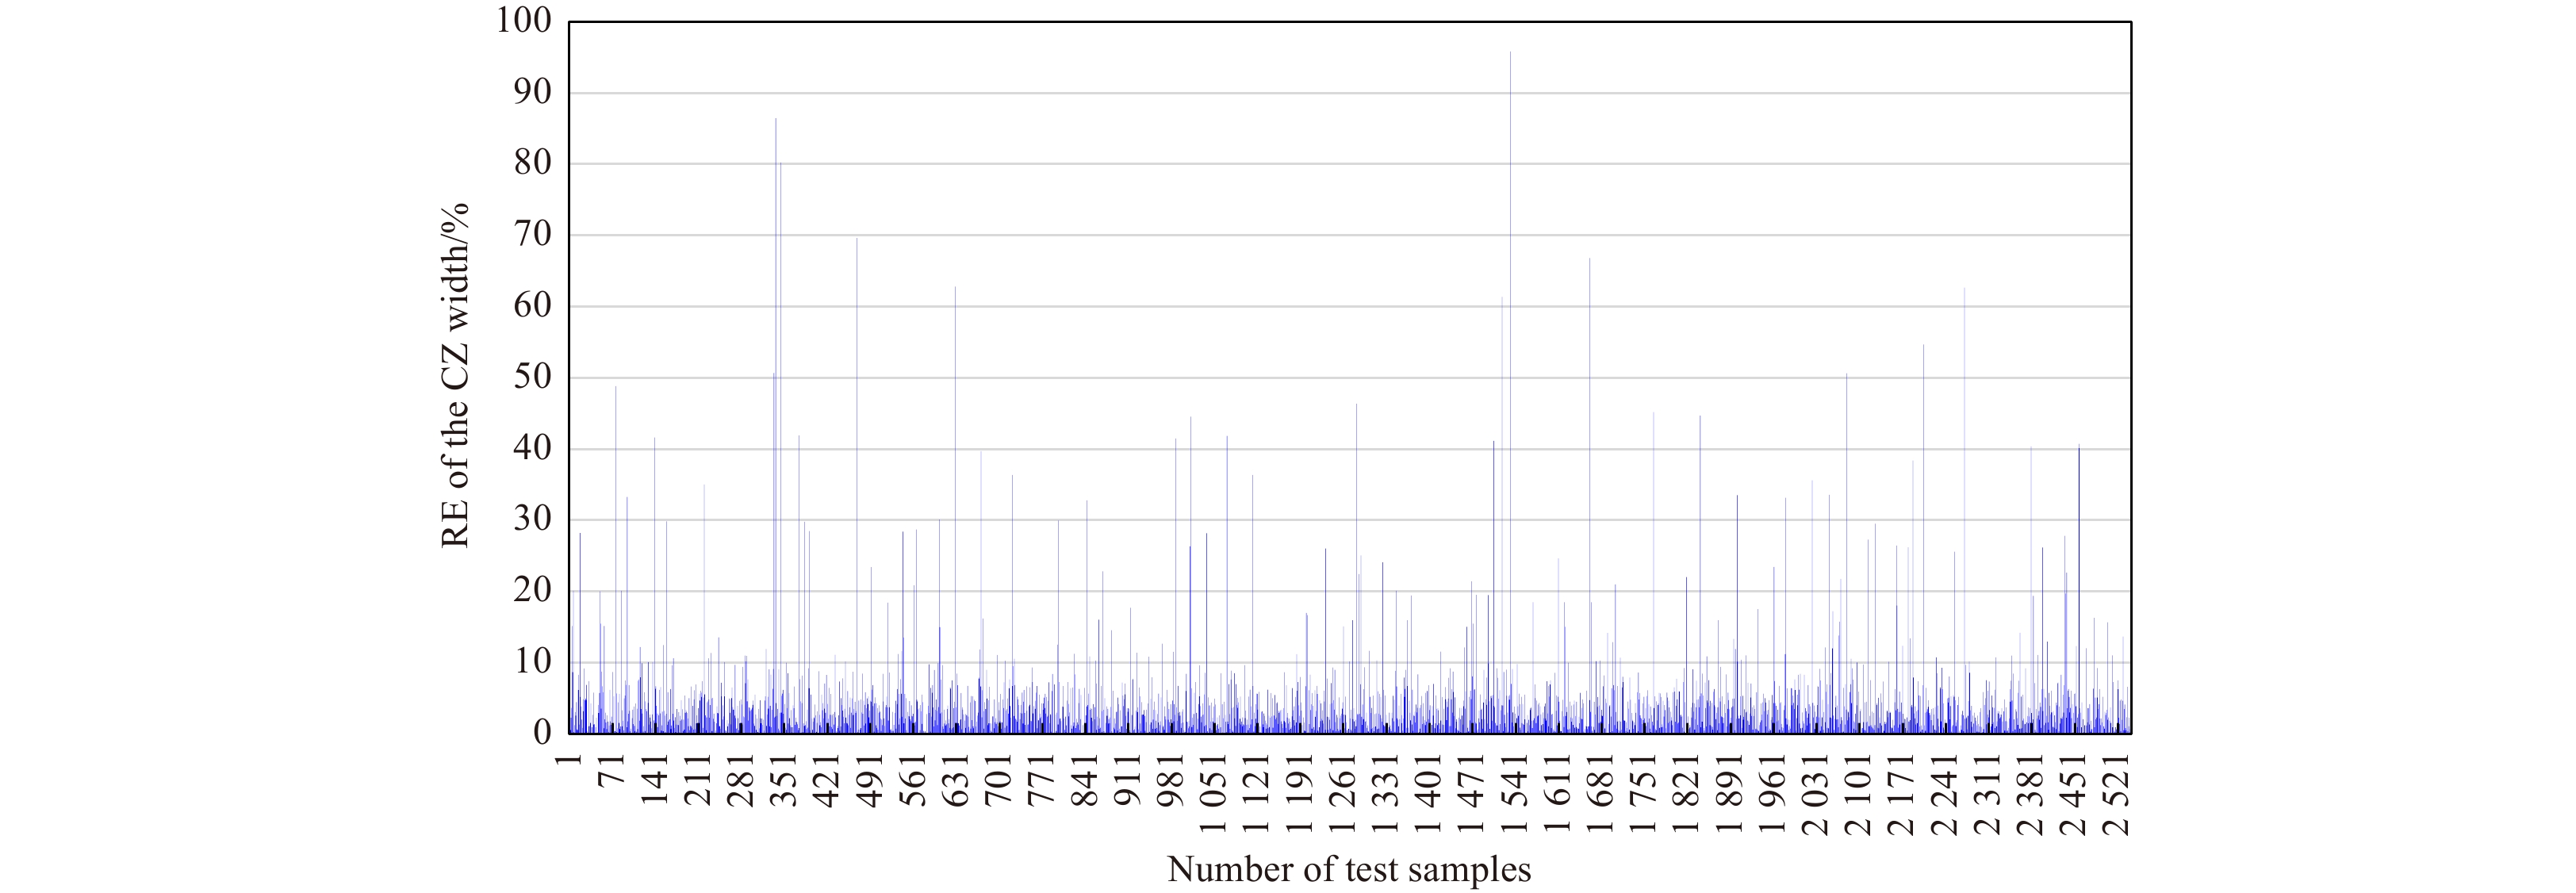
The mesoscale eddy (ME) has a significant influence on the convergence effect in deep-sea acoustic propagation. This paper use statistical approaches to express quantitative relationships between the ME conditions and convergence zone (CZ) characteristics. Based on the Gaussian vortex model, we construct various sound propagation scenarios under different eddy conditions, and carry out sound propagation experiments to obtain simulation samples. With a large number of samples, we first adopt the unified regression to set up analytic relationships between eddy conditions and CZ parameters. The sensitivity of eddy indicators to the CZ is quantitatively analyzed. Then, we adopt the machine learning (ML) algorithms to establish prediction models of CZ parameters by exploring the nonlinear relationships between multiple ME indicators and CZ parameters. Through the research, we can express the influence of ME on the CZ quantitatively, and achieve the rapid prediction of CZ parameters in ocean eddies. The prediction accuracy (R) of the CZ distance (mean R: 0.9815) is obviously better than that of the CZ width (mean R: 0.8728). Among the three ML algorithms, Gradient Boosting Decision Tree has the best prediction ability (root mean square error (RMSE): 0.136), followed by Random Forest (RMSE: 0.441) and Extreme Learning Machine (RMSE: 0.518).
The mesoscale eddy (ME) has a significant influence on the convergence effect in deep-sea acoustic propagation. This paper use statistical approaches to express quantitative relationships between the ME conditions and convergence zone (CZ) characteristics. Based on the Gaussian vortex model, we construct various sound propagation scenarios under different eddy conditions, and carry out sound propagation experiments to obtain simulation samples. With a large number of samples, we first adopt the unified regression to set up analytic relationships between eddy conditions and CZ parameters. The sensitivity of eddy indicators to the CZ is quantitatively analyzed. Then, we adopt the machine learning (ML) algorithms to establish prediction models of CZ parameters by exploring the nonlinear relationships between multiple ME indicators and CZ parameters. Through the research, we can express the influence of ME on the CZ quantitatively, and achieve the rapid prediction of CZ parameters in ocean eddies. The prediction accuracy (R) of the CZ distance (mean R: 0.9815) is obviously better than that of the CZ width (mean R: 0.8728). Among the three ML algorithms, Gradient Boosting Decision Tree has the best prediction ability (root mean square error (RMSE): 0.136), followed by Random Forest (RMSE: 0.441) and Extreme Learning Machine (RMSE: 0.518).


2024, 43(5): 121-132.
doi: 10.1007/s13131-024-2329-4
Abstract:
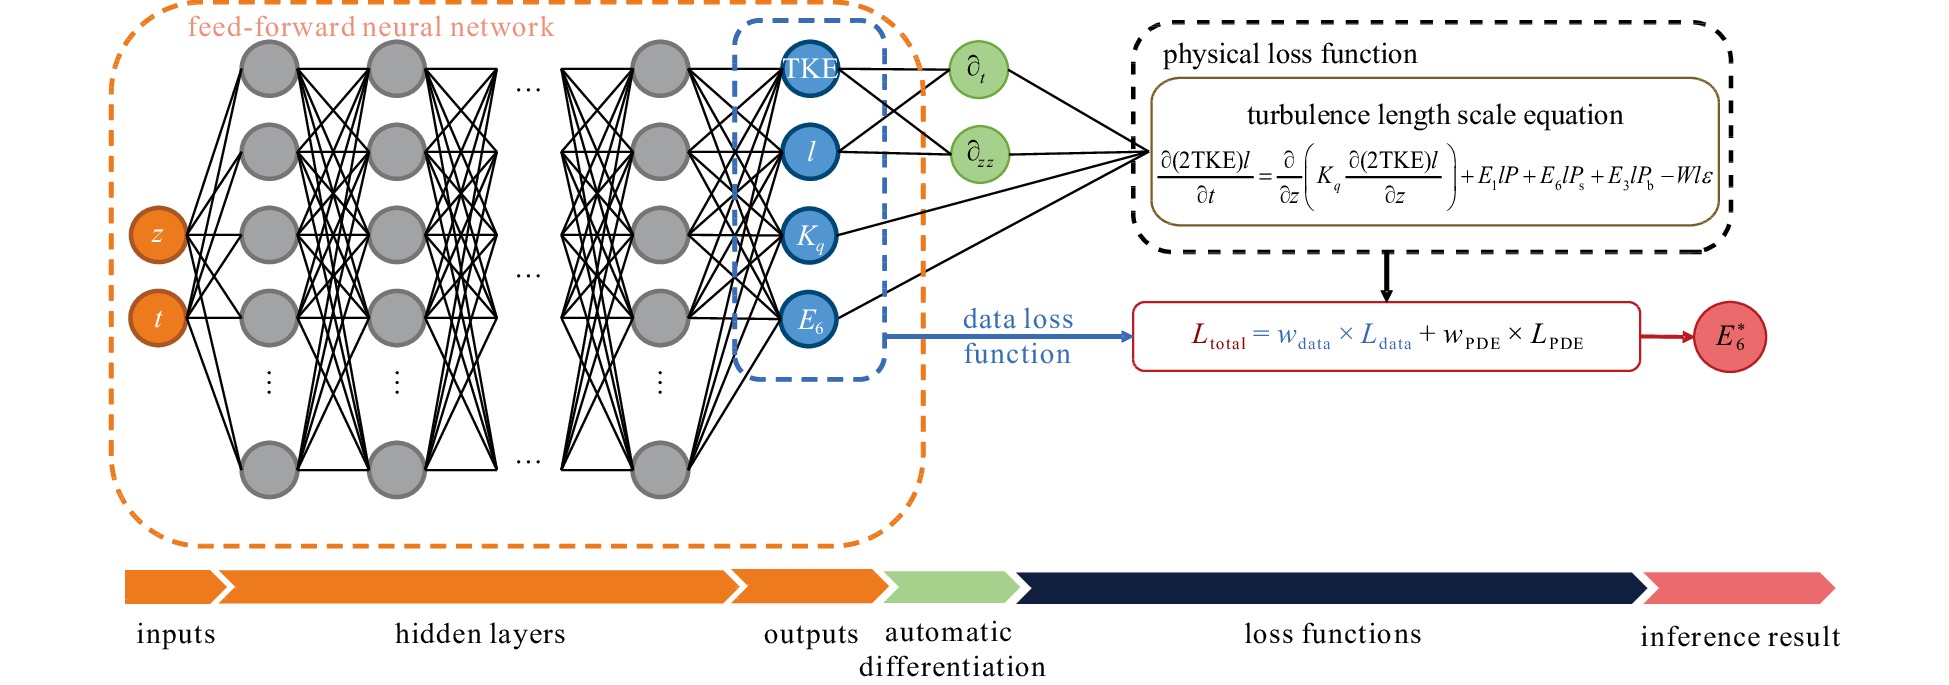
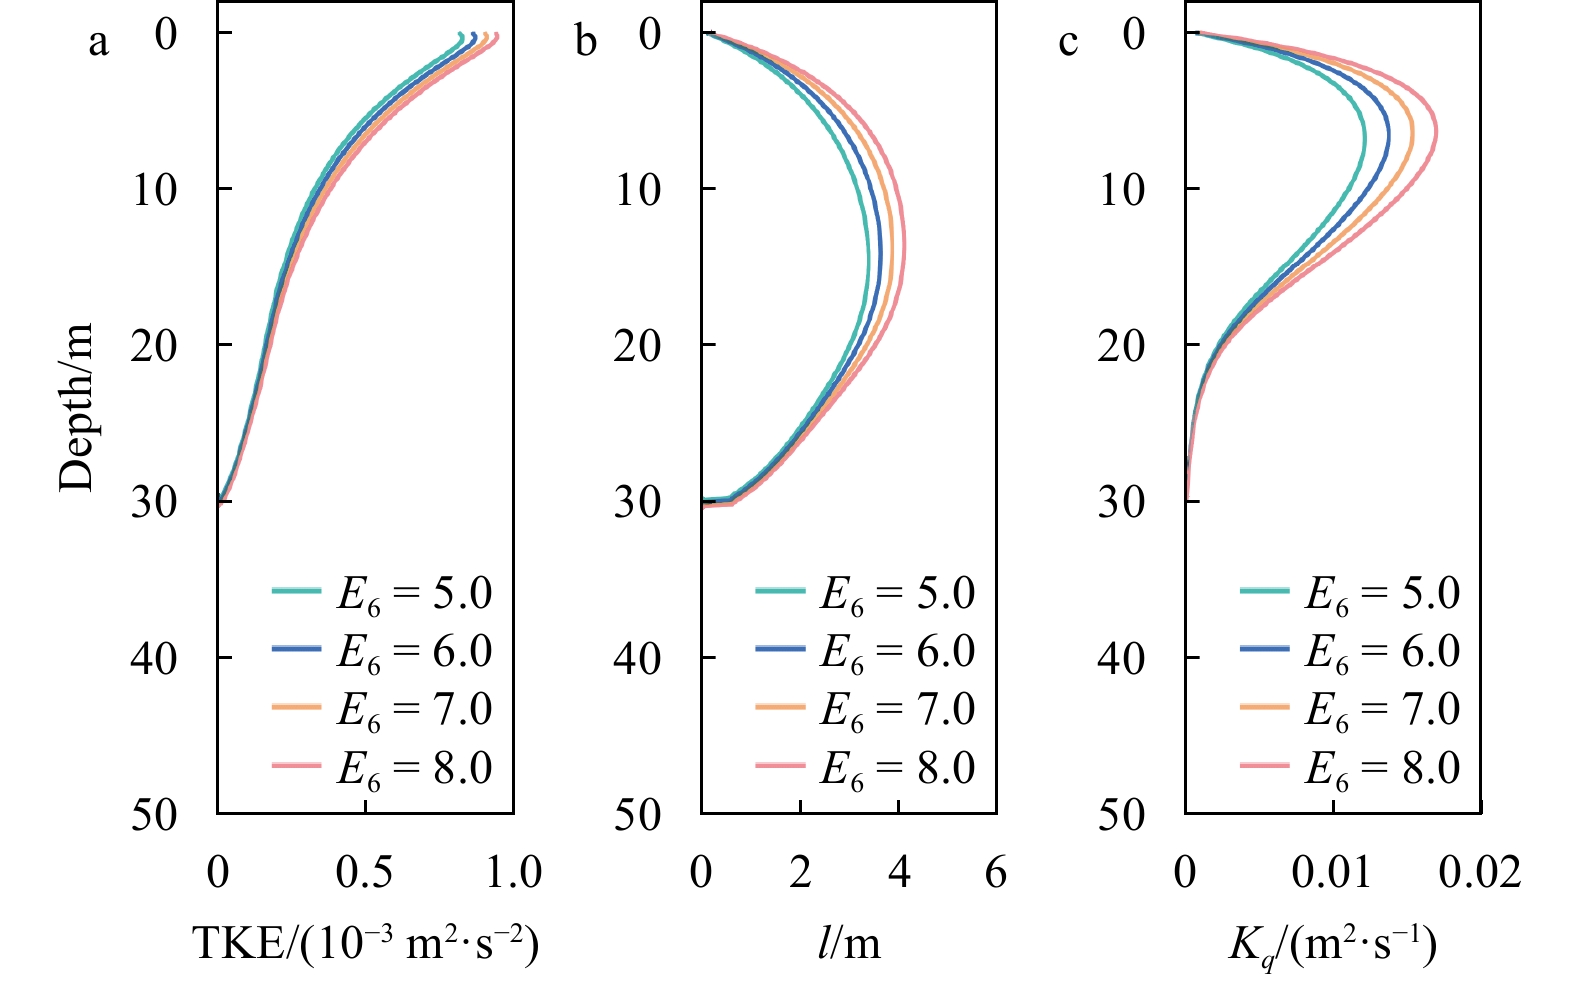
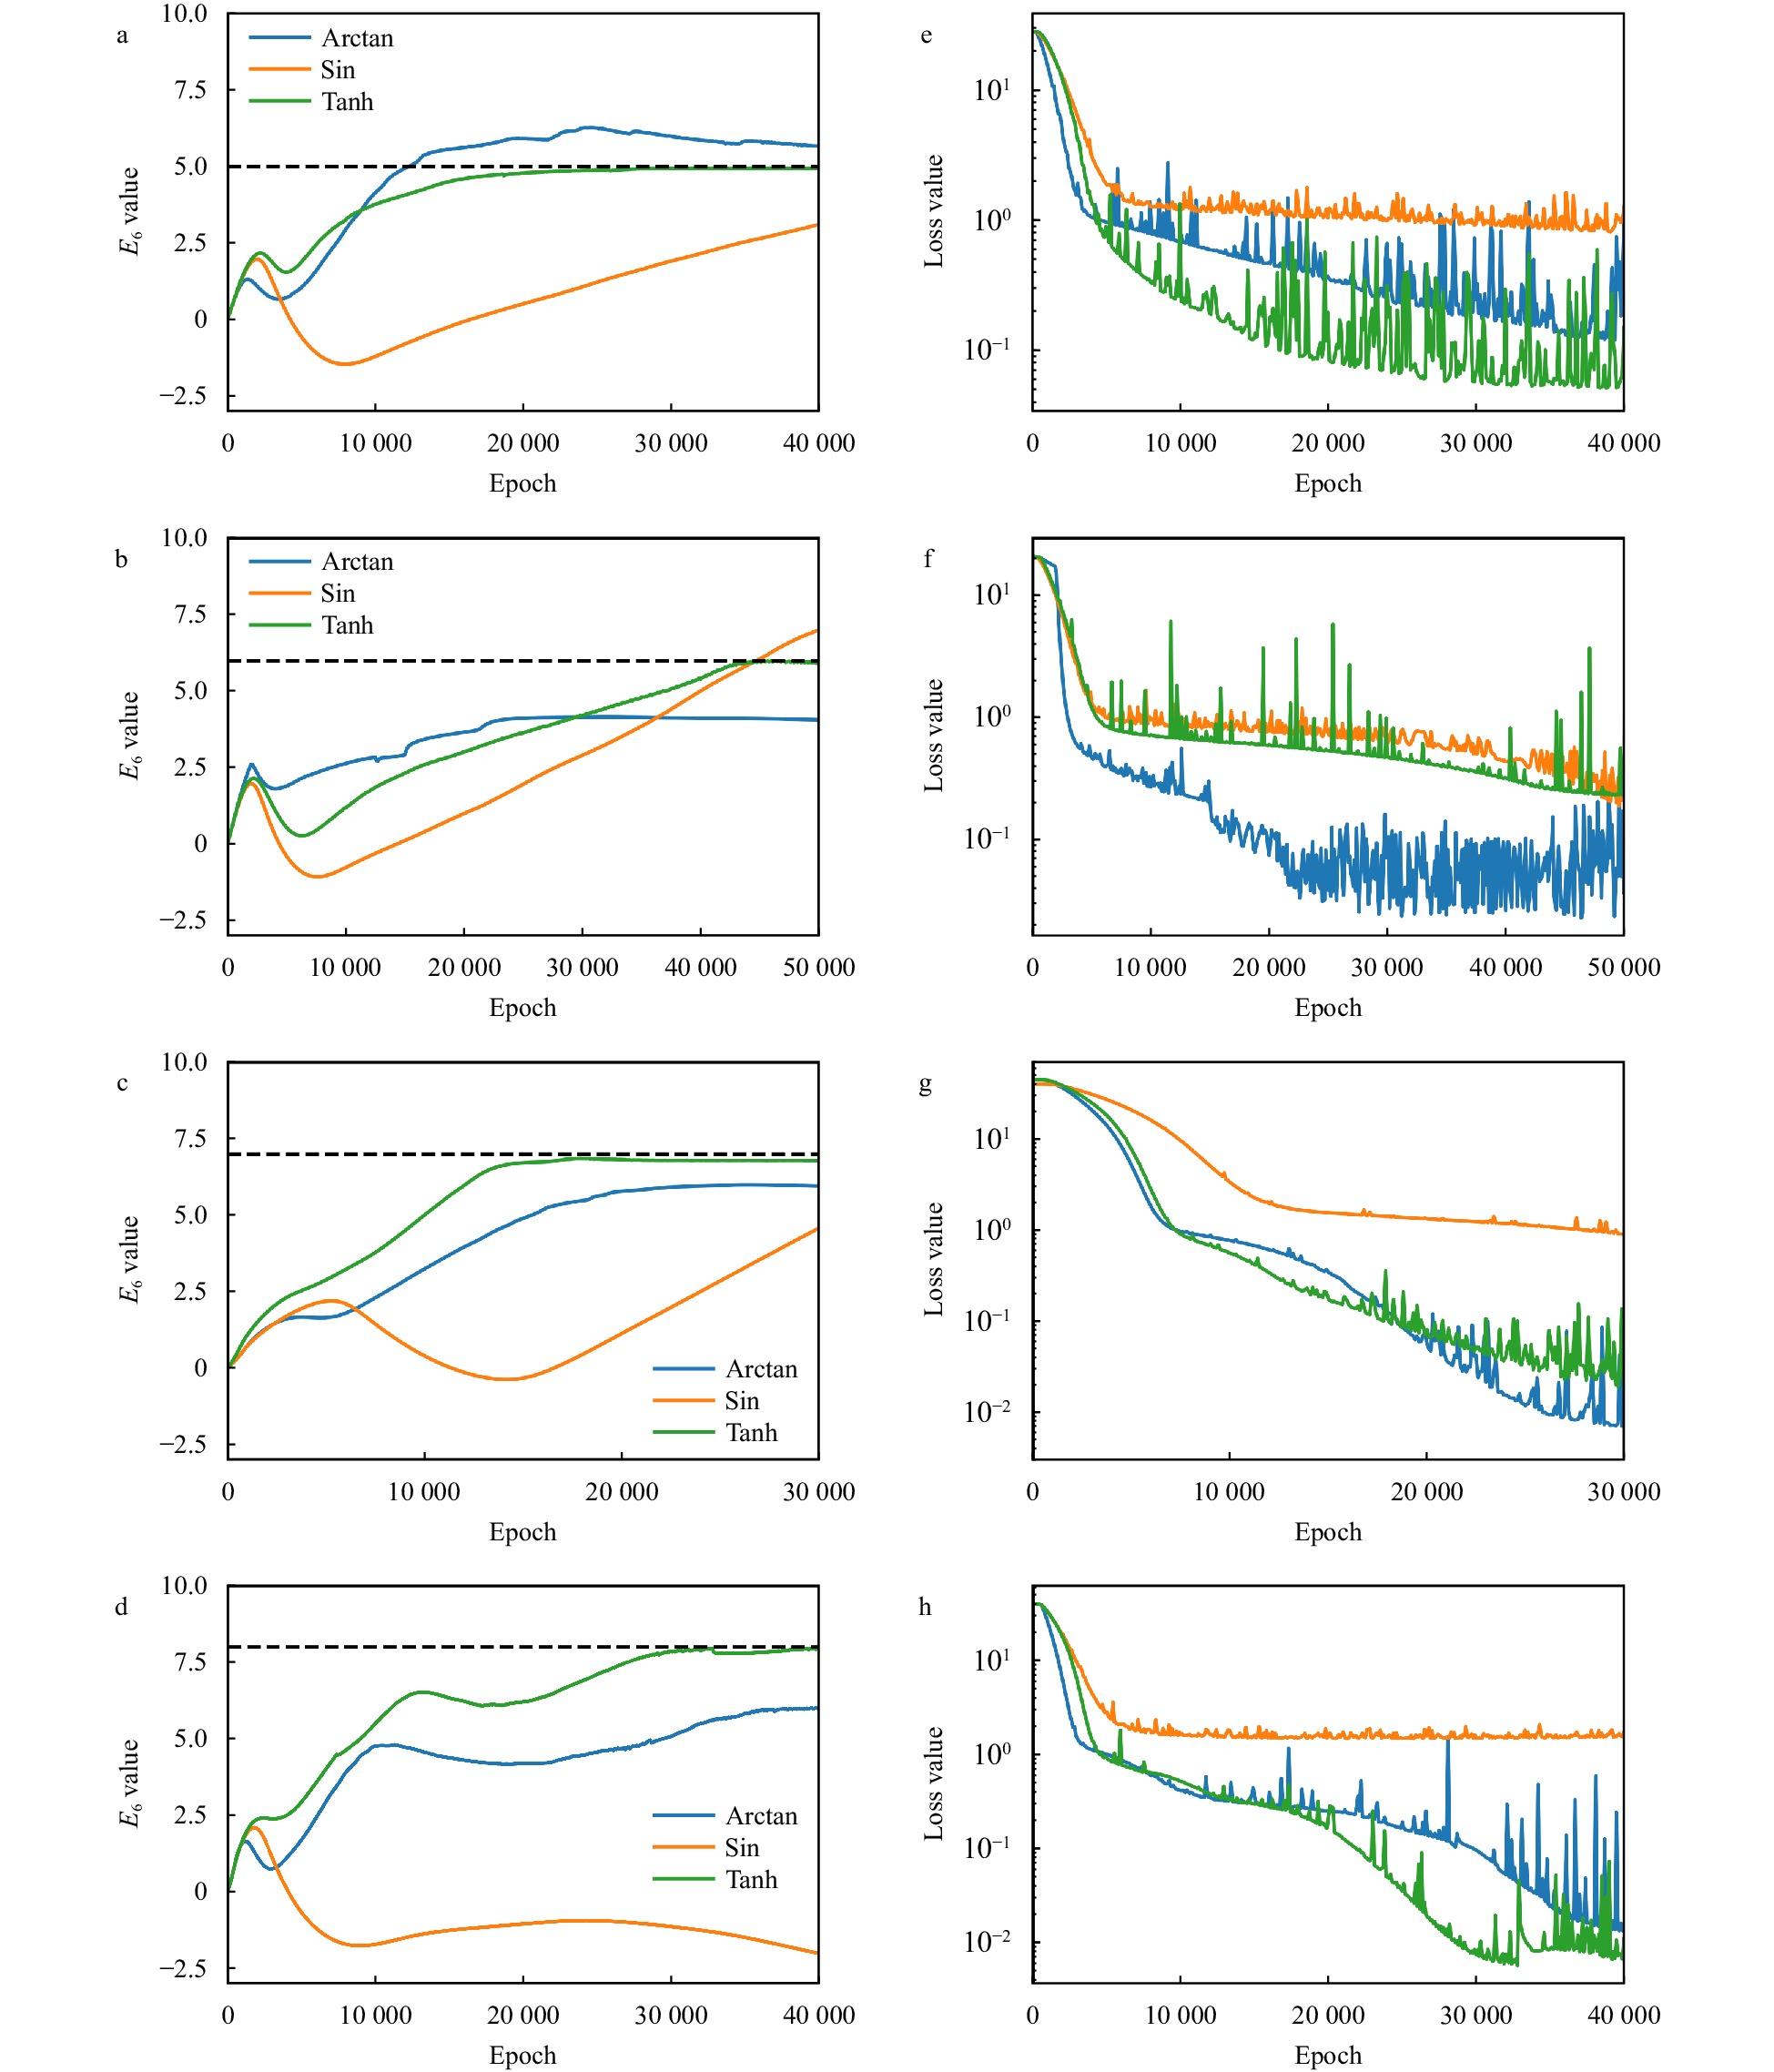
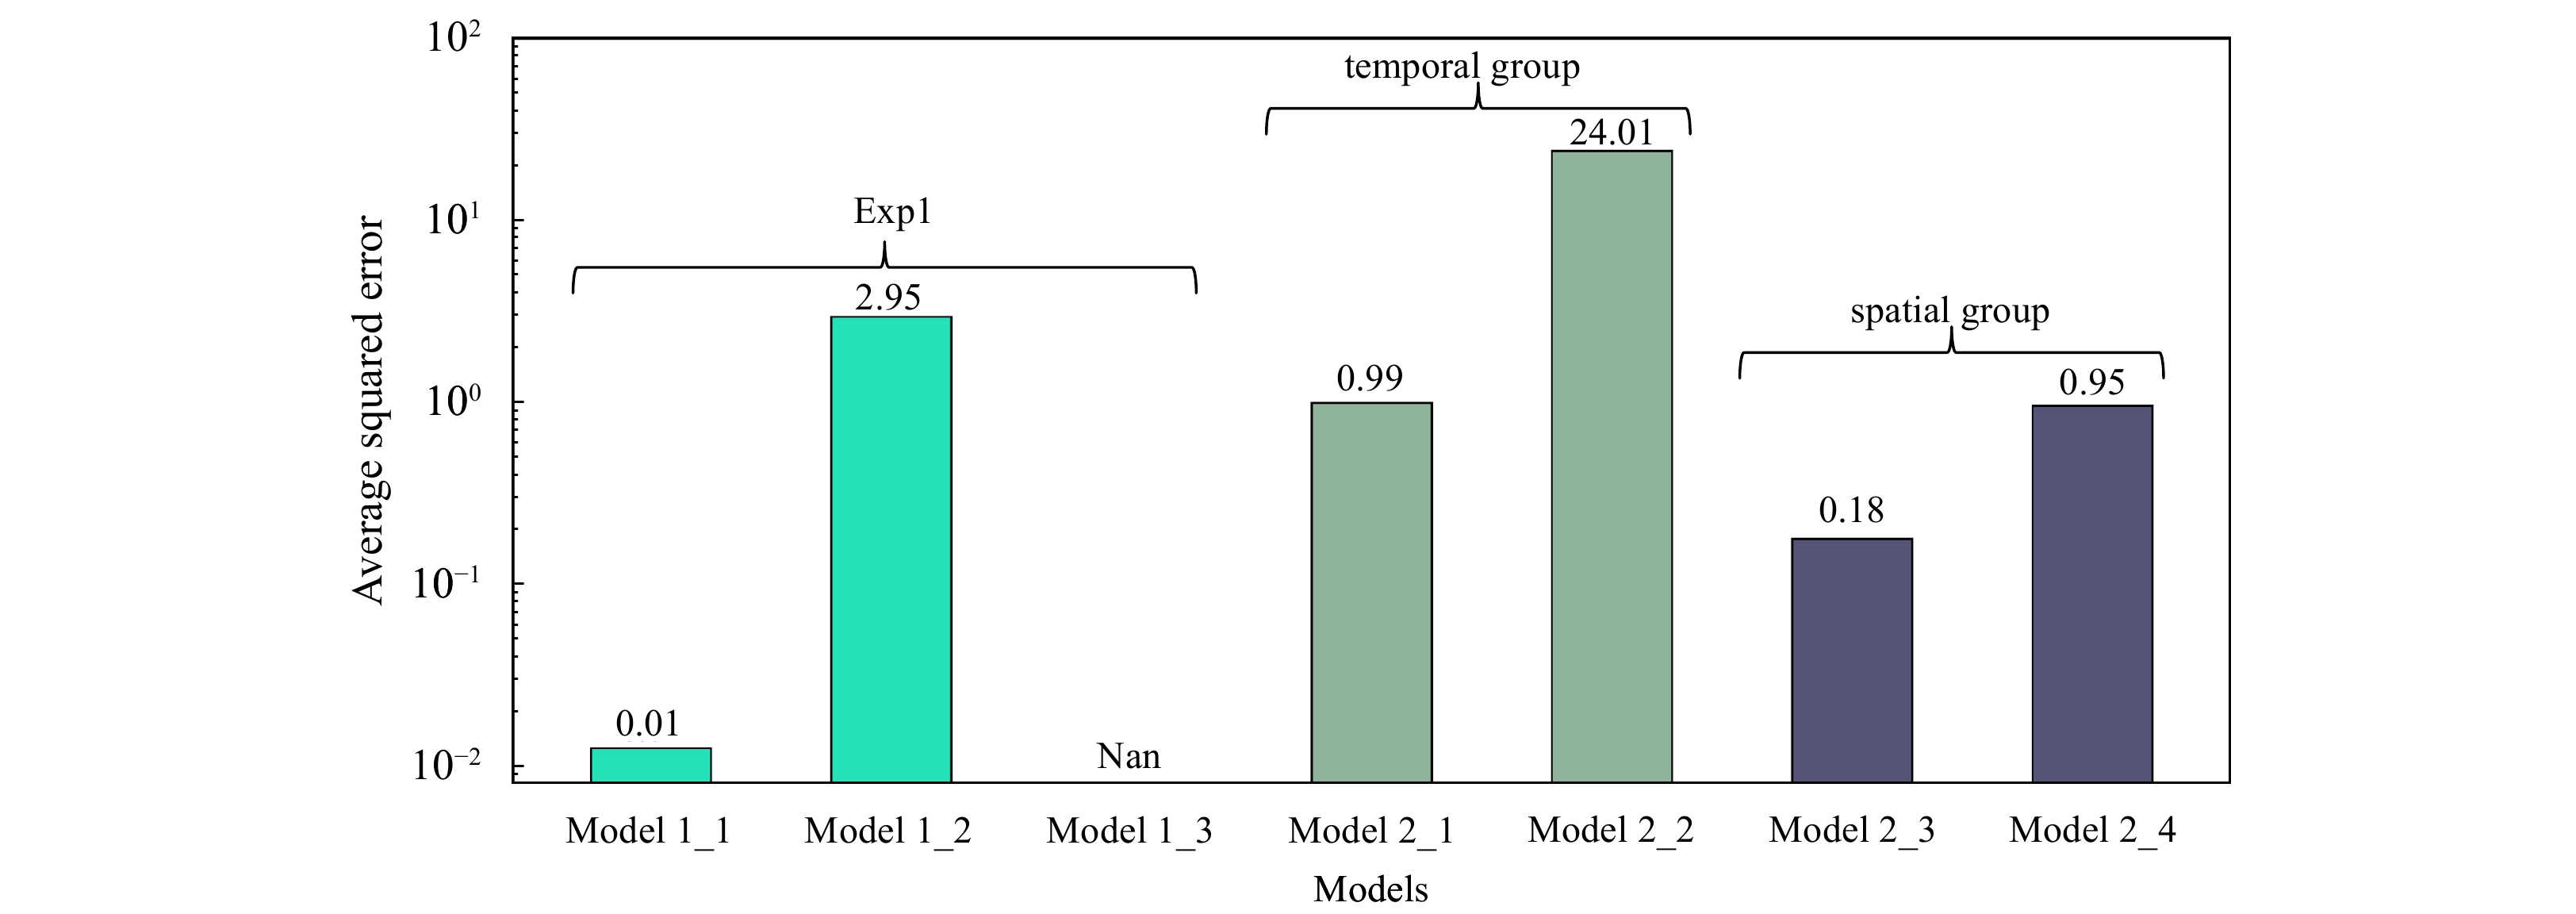
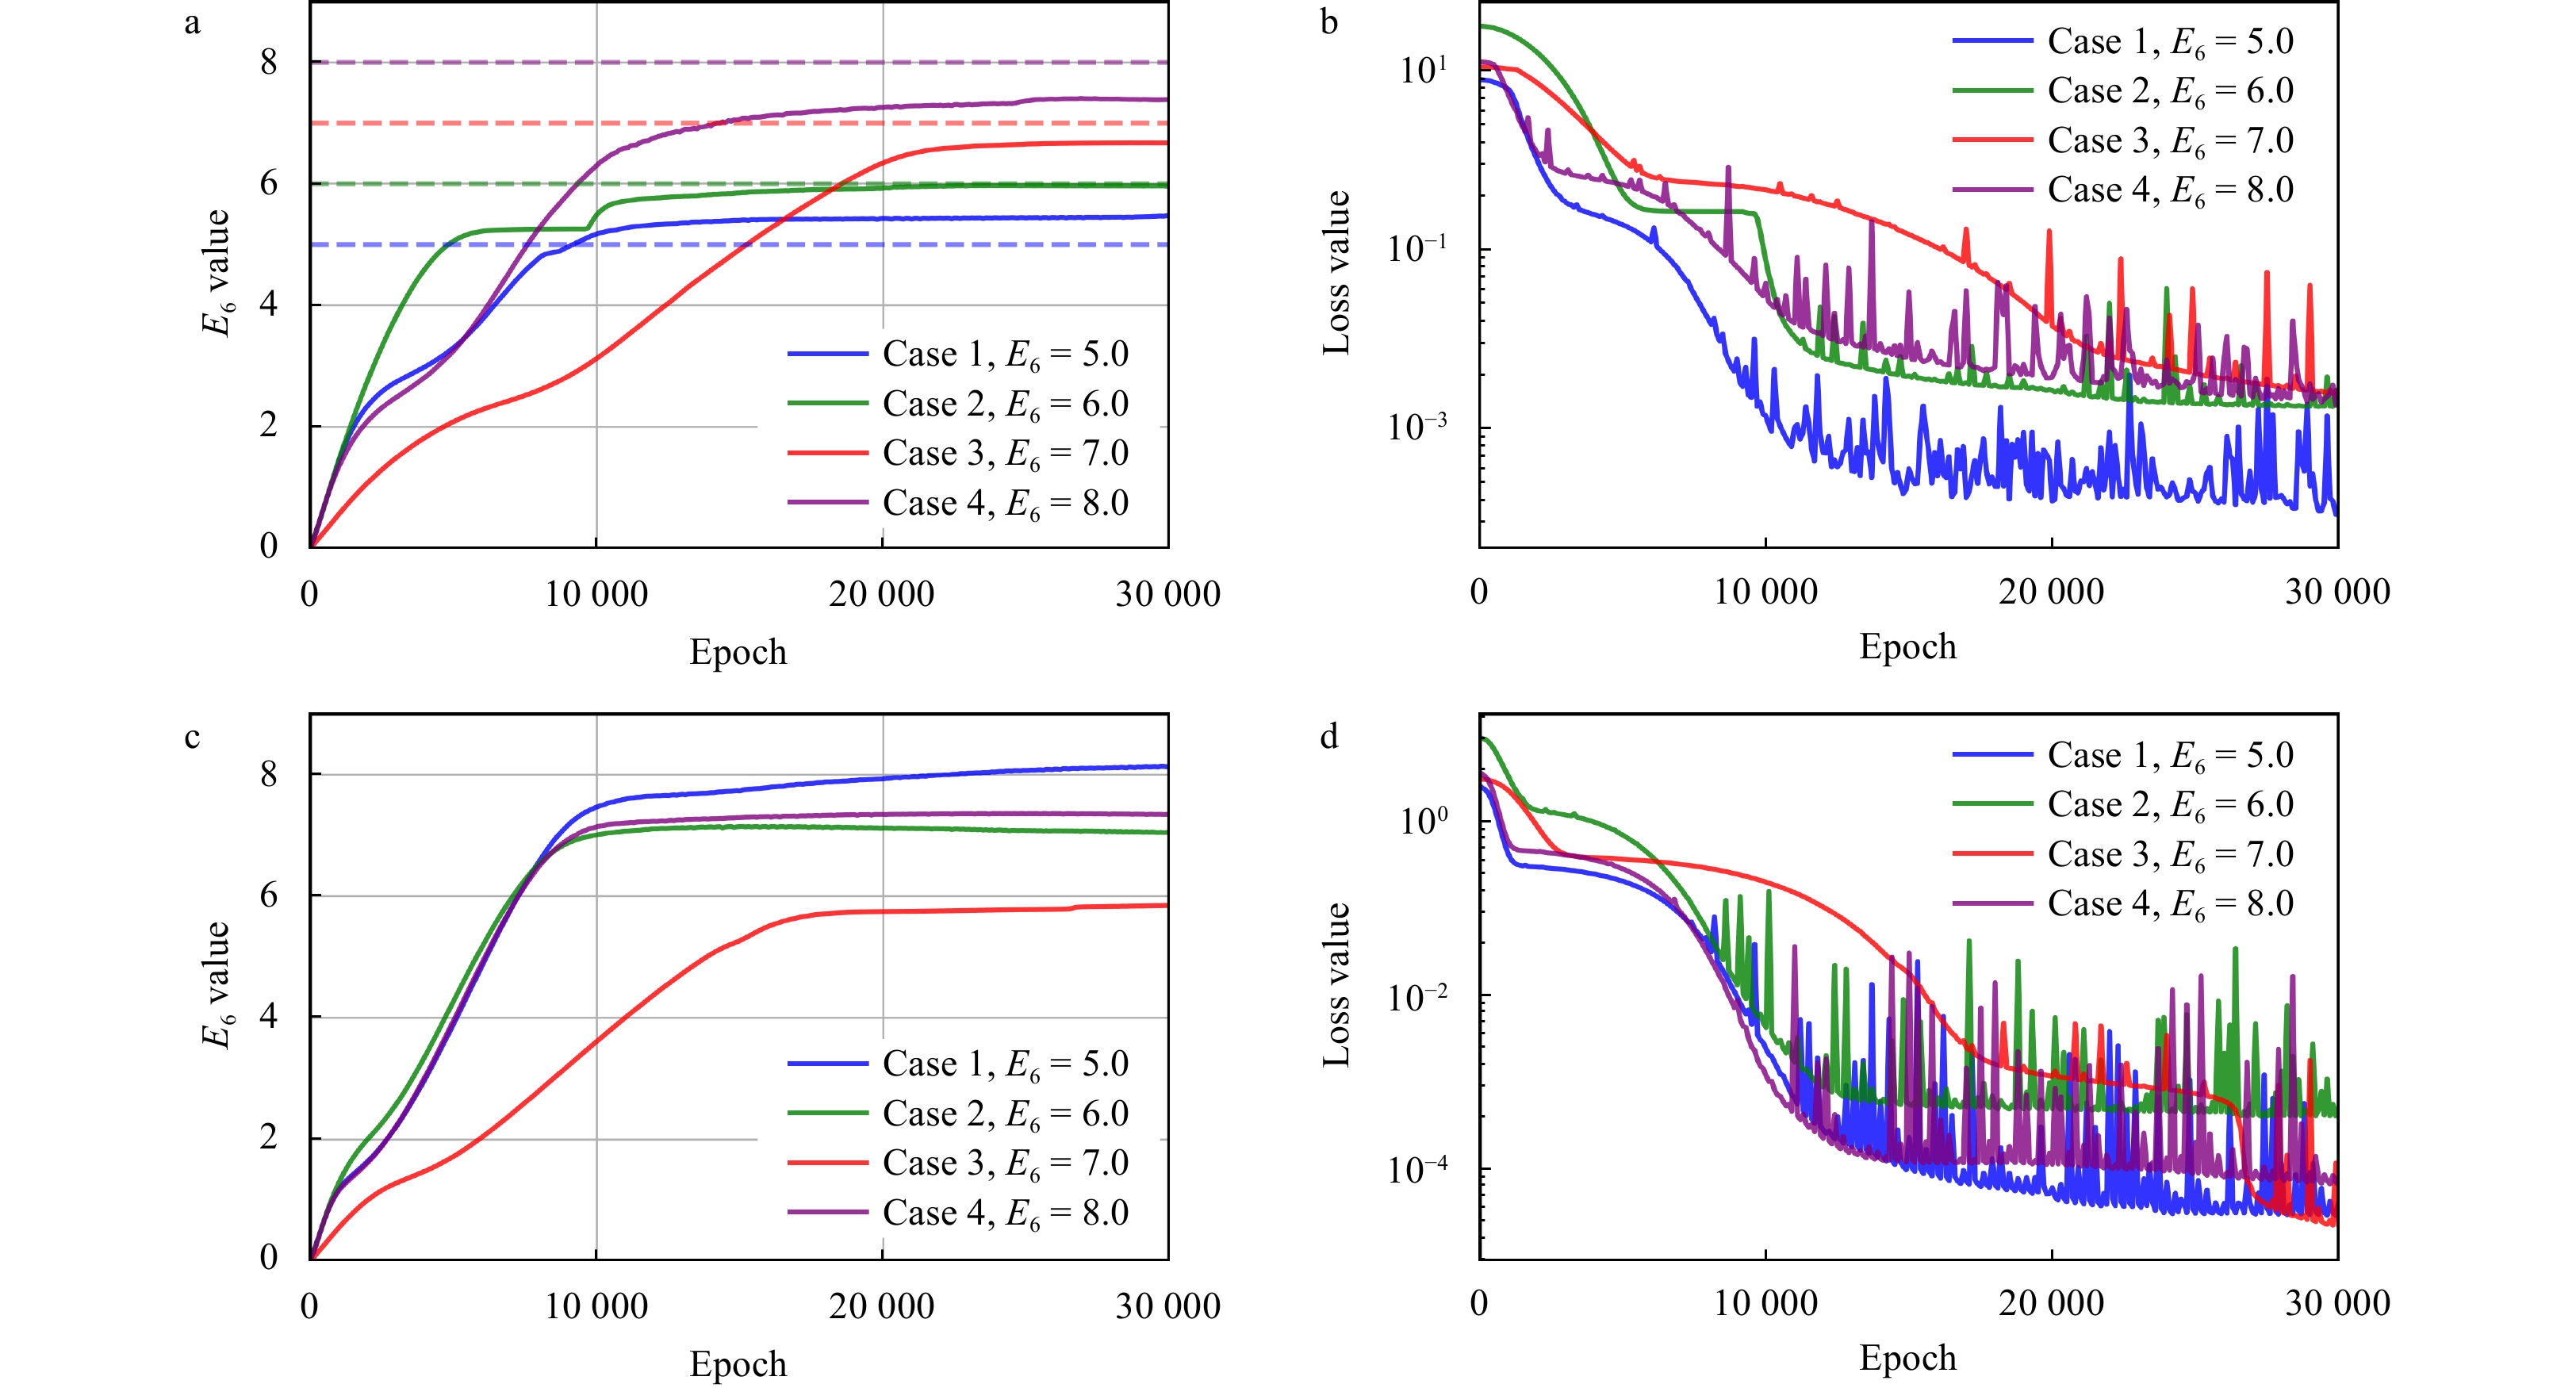
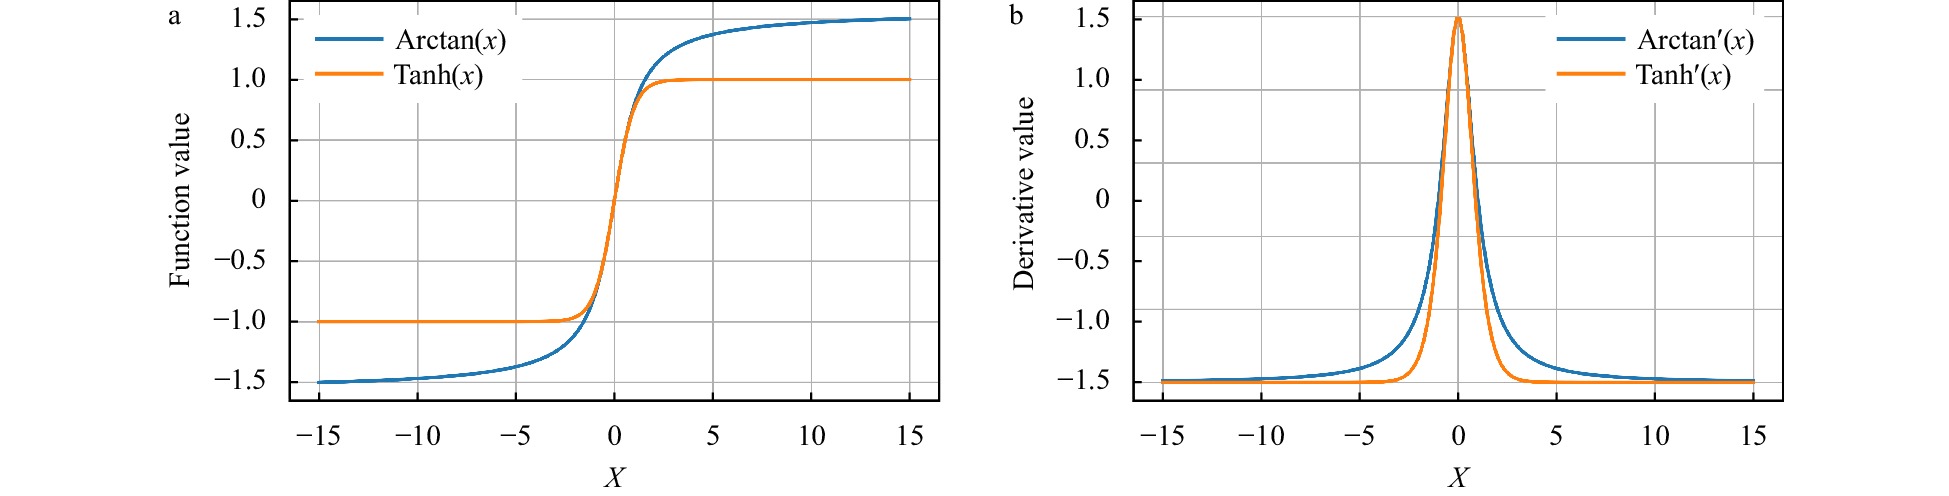
The Stokes production coefficient (E6) constitutes a critical parameter within the Mellor-Yamada type (MY-type) Langmuir turbulence (LT) parameterization schemes, significantly affecting the simulation of turbulent kinetic energy, turbulent length scale, and vertical diffusivity coefficient for turbulent kinetic energy in the upper ocean. However, the accurate determination of its value remains a pressing scientific challenge. This study adopted an innovative approach by leveraging deep learning technology to address this challenge of inferring the E6. Through the integration of the information of the turbulent length scale equation into a physical-informed neural network (PINN), we achieved an accurate and physically meaningful inference of E6. Multiple cases were examined to assess the feasibility of PINN in this task, revealing that under optimal settings, the average mean squared error of the E6 inference was only 0.01, attesting to the effectiveness of PINN. The optimal hyperparameter combination was identified using the Tanh activation function, along with a spatiotemporal sampling interval of 1 s and 0.1 m. This resulted in a substantial reduction in the average bias of the E6 inference, ranging from O(101) to O(102) times compared with other combinations. This study underscores the potential application of PINN in intricate marine environments, offering a novel and efficient method for optimizing MY-type LT parameterization schemes.
The Stokes production coefficient (E6) constitutes a critical parameter within the Mellor-Yamada type (MY-type) Langmuir turbulence (LT) parameterization schemes, significantly affecting the simulation of turbulent kinetic energy, turbulent length scale, and vertical diffusivity coefficient for turbulent kinetic energy in the upper ocean. However, the accurate determination of its value remains a pressing scientific challenge. This study adopted an innovative approach by leveraging deep learning technology to address this challenge of inferring the E6. Through the integration of the information of the turbulent length scale equation into a physical-informed neural network (PINN), we achieved an accurate and physically meaningful inference of E6. Multiple cases were examined to assess the feasibility of PINN in this task, revealing that under optimal settings, the average mean squared error of the E6 inference was only 0.01, attesting to the effectiveness of PINN. The optimal hyperparameter combination was identified using the Tanh activation function, along with a spatiotemporal sampling interval of 1 s and 0.1 m. This resulted in a substantial reduction in the average bias of the E6 inference, ranging from O(101) to O(102) times compared with other combinations. This study underscores the potential application of PINN in intricate marine environments, offering a novel and efficient method for optimizing MY-type LT parameterization schemes.


2024, 43(5): 133-144.
doi: 10.1007/s13131-024-2320-0
Abstract:
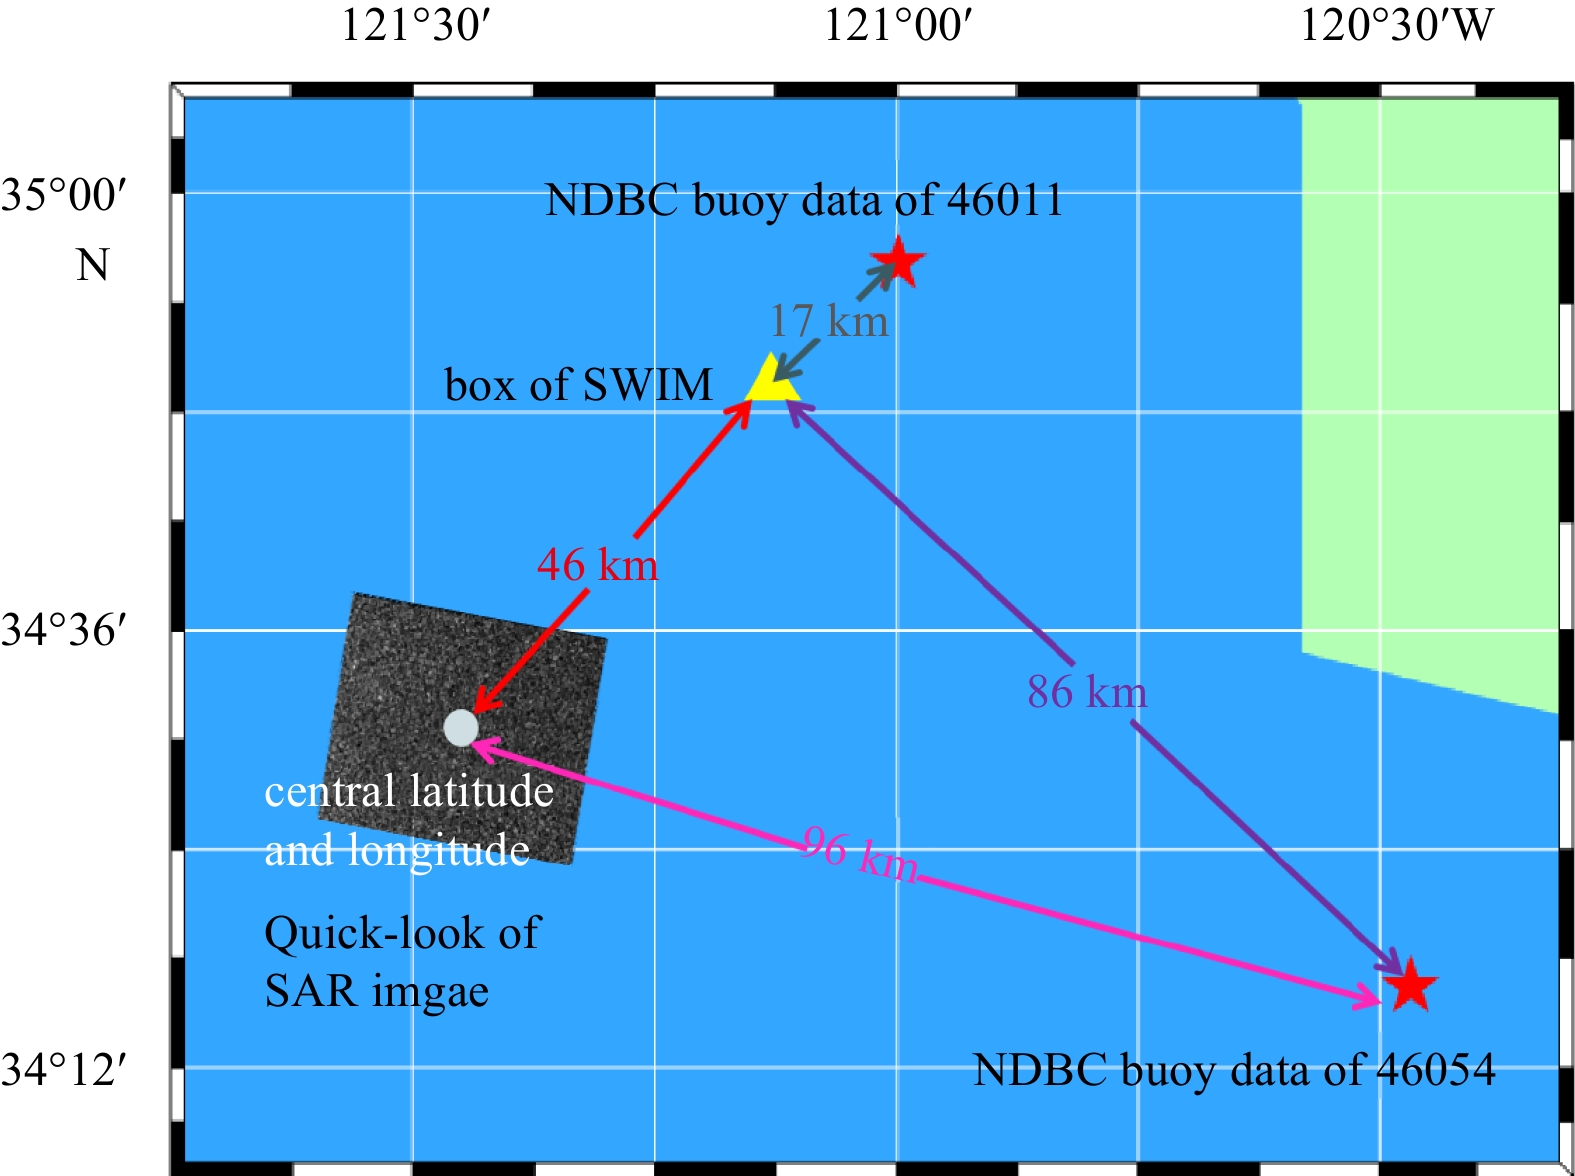
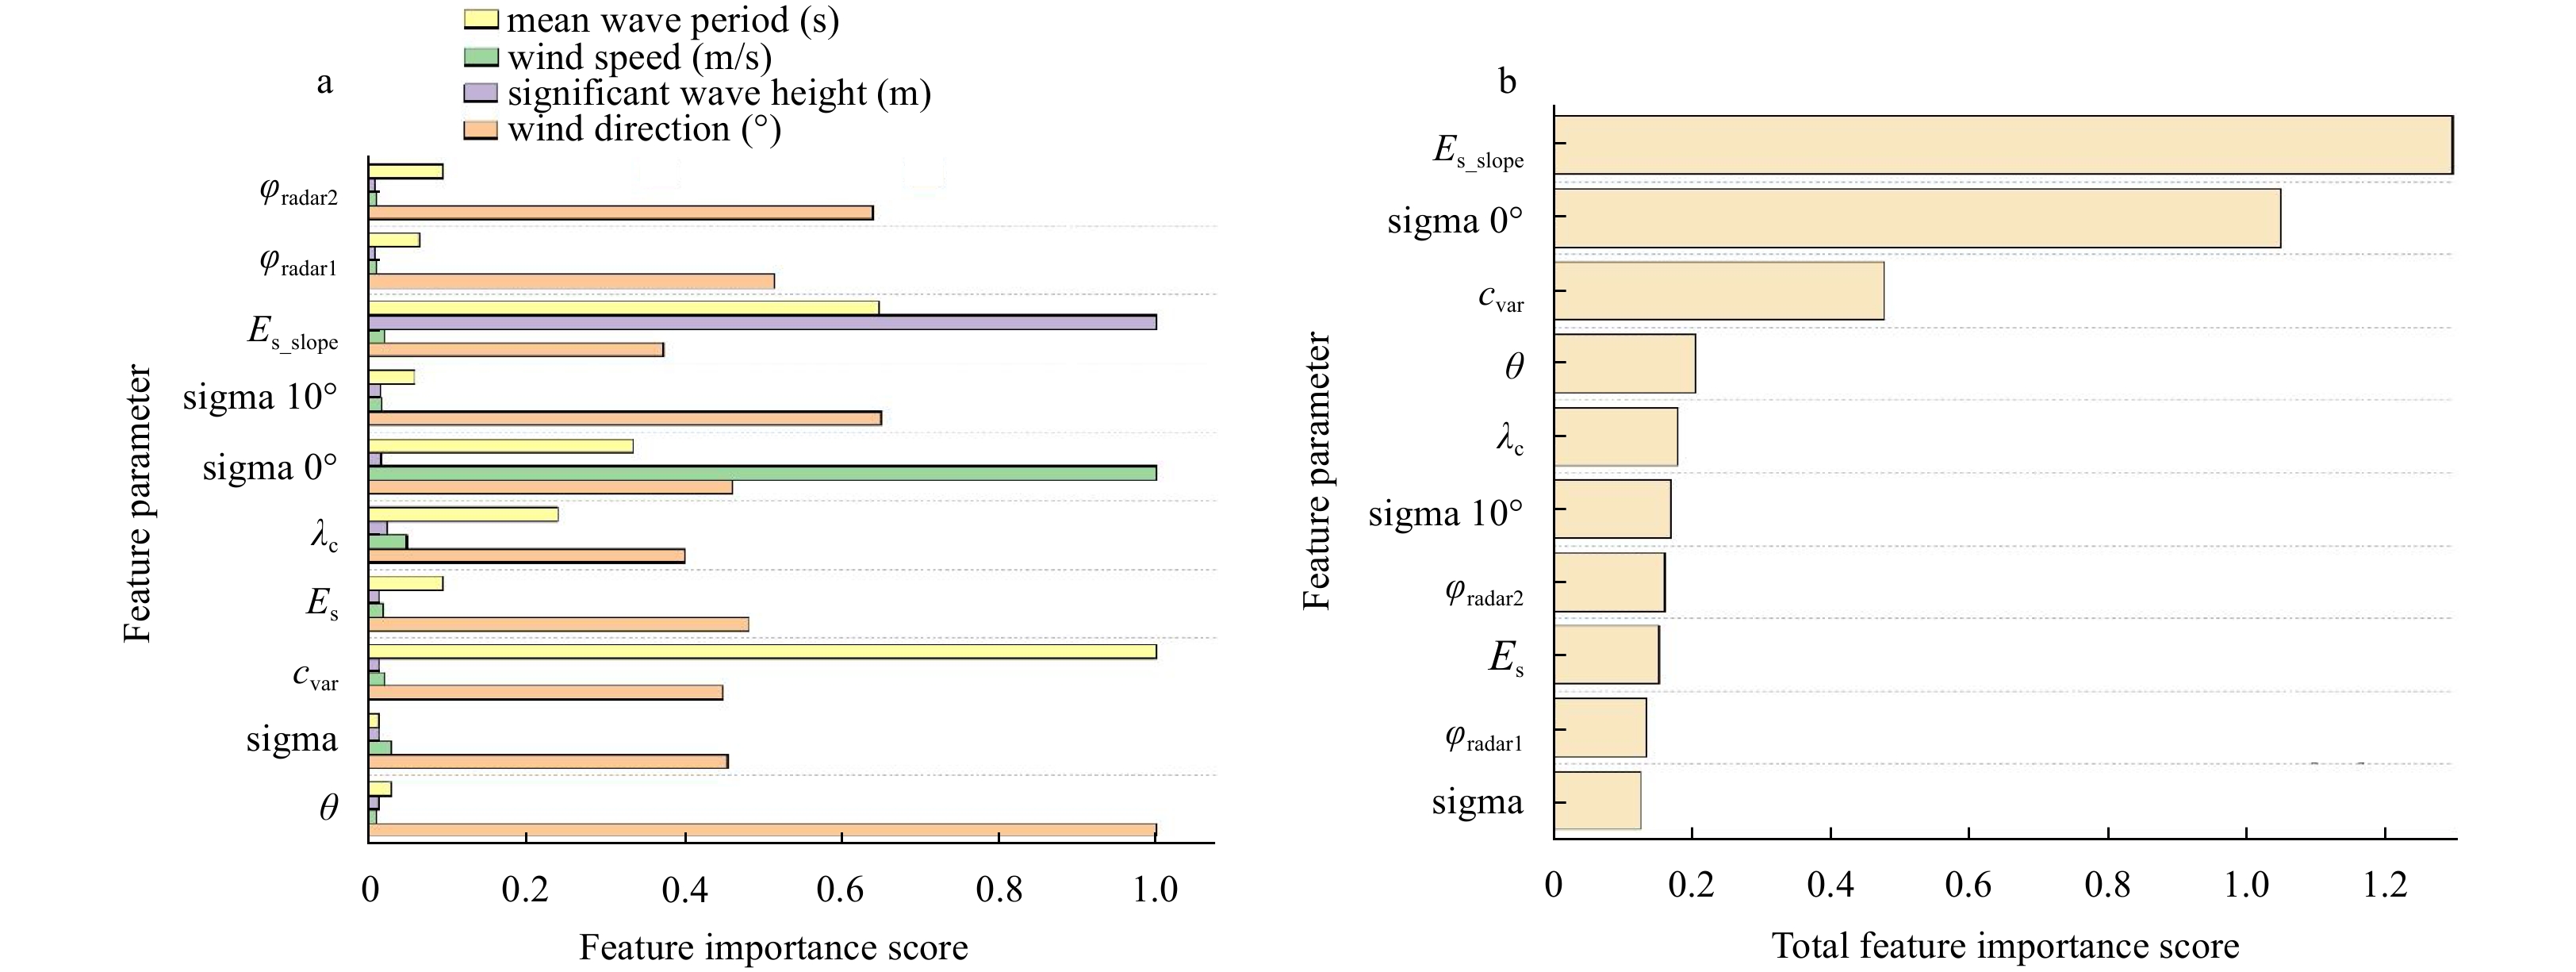
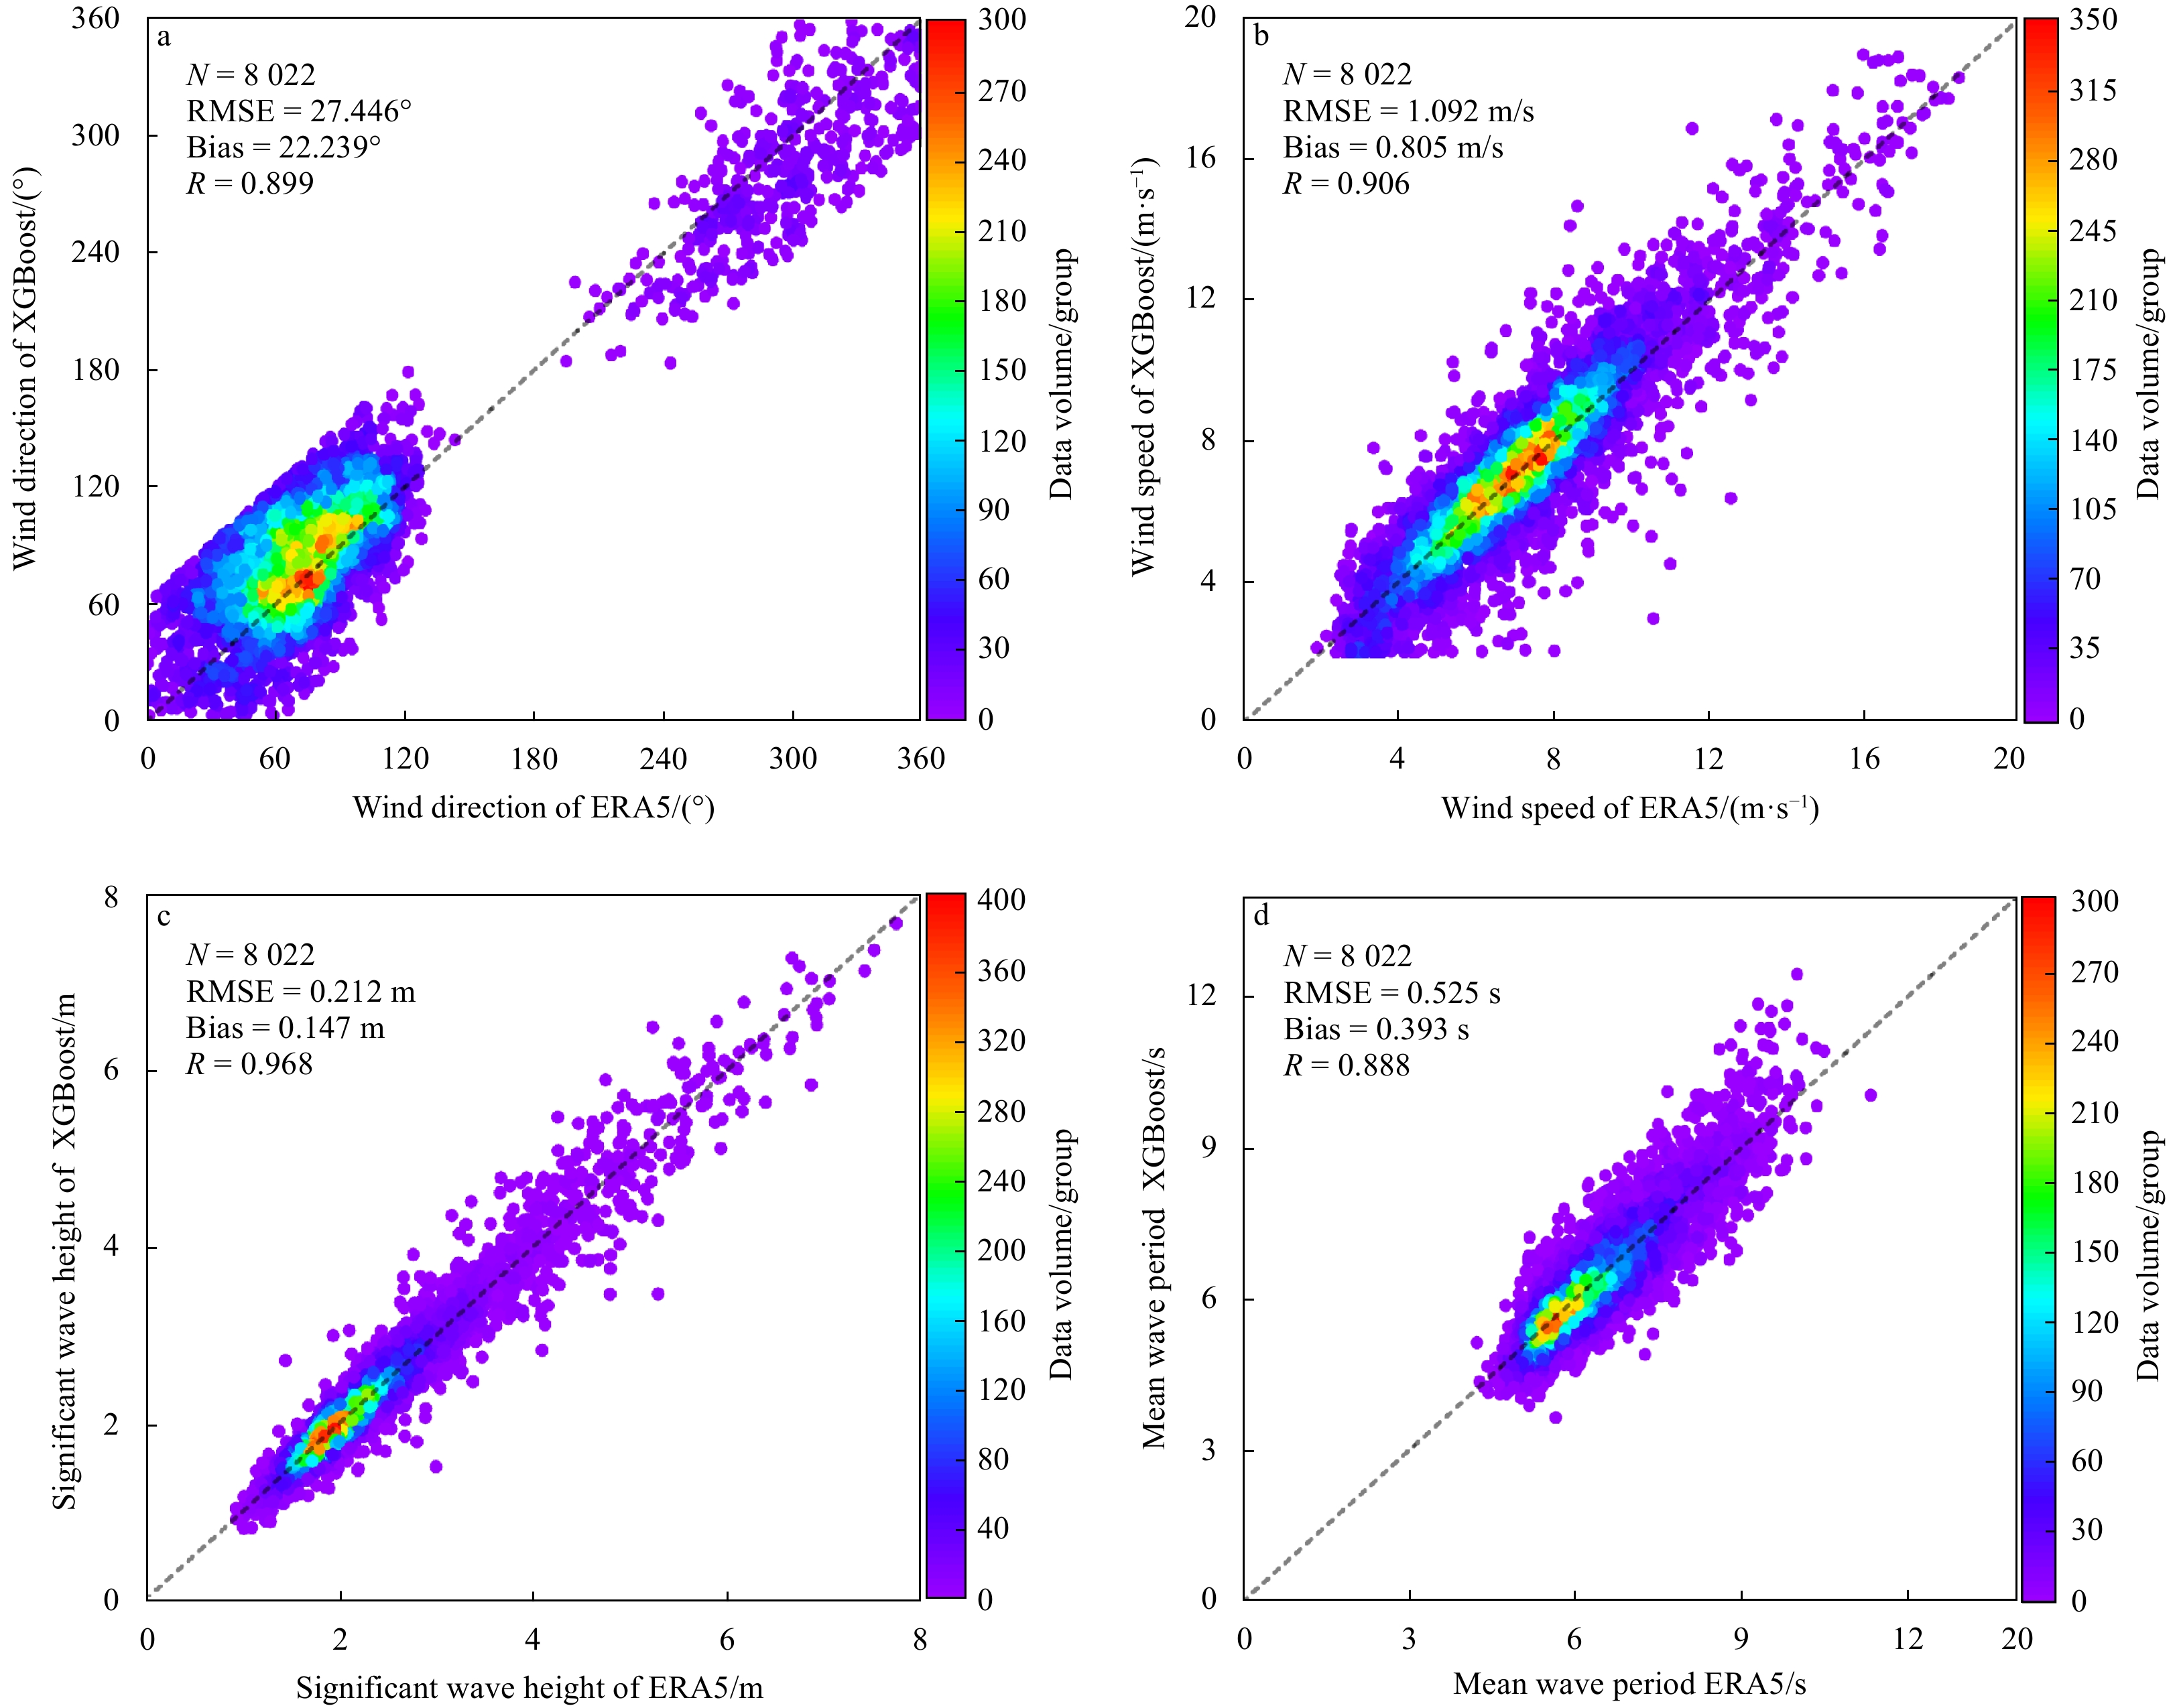
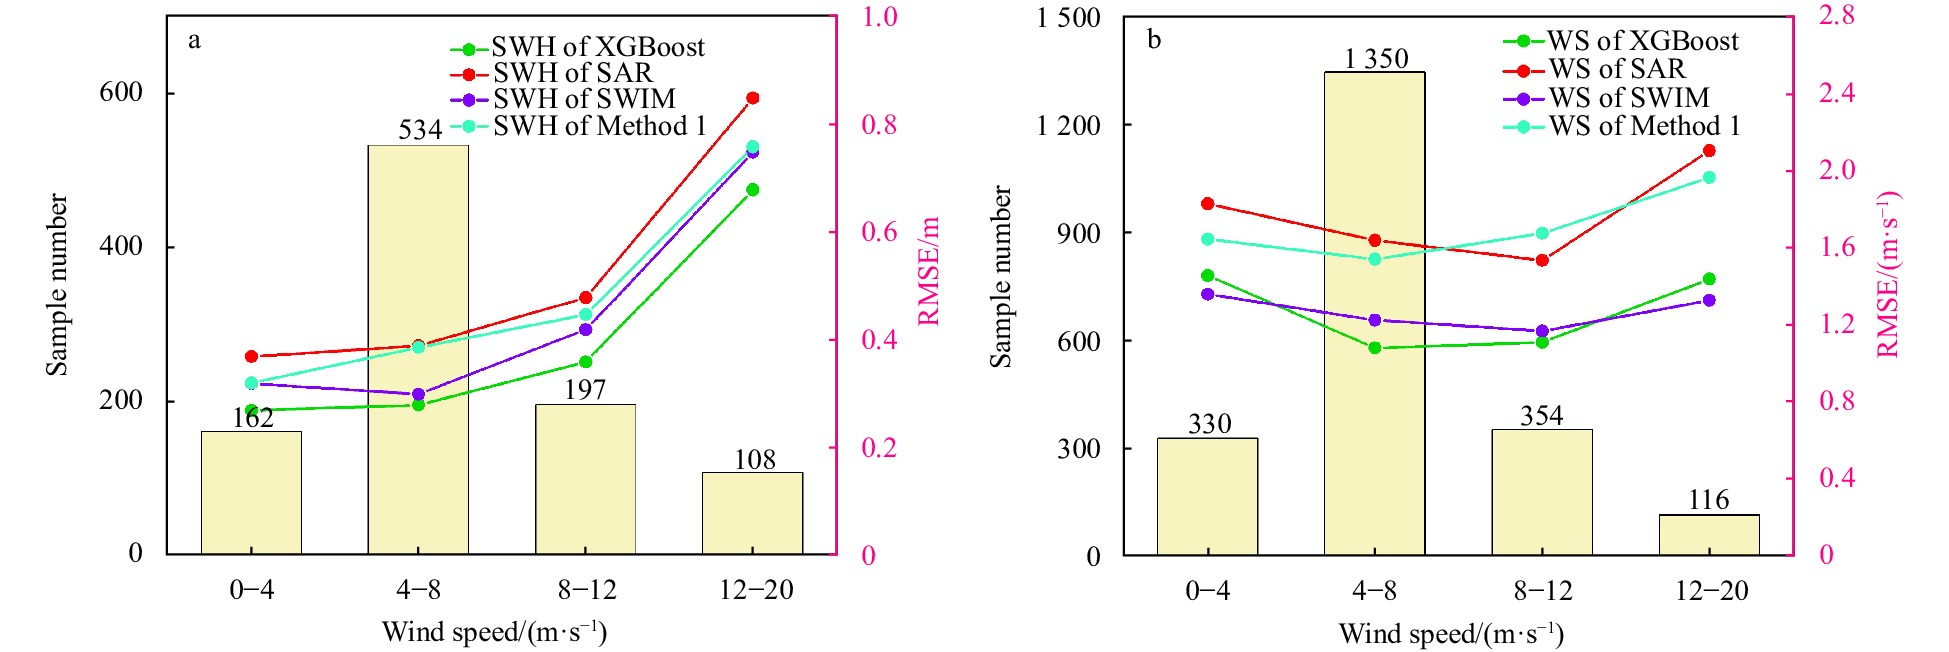
Synthetic aperture radar (SAR) and wave spectrometers, crucial in microwave remote sensing, play an essential role in monitoring sea surface wind and wave conditions. However, they face inherent limitations in observing sea surface phenomena. SAR systems, for instance, are hindered by an azimuth cut-off phenomenon in sea surface wind field observation. Wave spectrometers, while unaffected by the azimuth cutoff phenomenon, struggle with low azimuth resolution, impacting the capture of detailed wave and wind field data. This study utilizes SAR and surface wave investigation and monitoring (SWIM) data to initially extract key feature parameters, which are then prioritized using the extreme gradient boosting (XGBoost) algorithm. The research further addresses feature collinearity through a combined analysis of feature importance and correlation, leading to the development of an inversion model for wave and wind parameters based on XGBoost. A comparative analysis of this model with ERA5 reanalysis and buoy data for of significant wave height, mean wave period, wind direction, and wind speed reveals root mean square errors of 0.212 m, 0.525 s, 27.446°, and 1.092 m/s, compared to 0.314 m, 0.888 s, 27.698°, and 1.315 m/s from buoy data, respectively. These results demonstrate the model’s effective retrieval of wave and wind parameters. Finally, the model, incorporating altimeter and scatterometer data, is evaluated against SAR/SWIM single and dual payload inversion methods across different wind speeds. This comparison highlights the model’s superior inversion accuracy over other methods.
Synthetic aperture radar (SAR) and wave spectrometers, crucial in microwave remote sensing, play an essential role in monitoring sea surface wind and wave conditions. However, they face inherent limitations in observing sea surface phenomena. SAR systems, for instance, are hindered by an azimuth cut-off phenomenon in sea surface wind field observation. Wave spectrometers, while unaffected by the azimuth cutoff phenomenon, struggle with low azimuth resolution, impacting the capture of detailed wave and wind field data. This study utilizes SAR and surface wave investigation and monitoring (SWIM) data to initially extract key feature parameters, which are then prioritized using the extreme gradient boosting (XGBoost) algorithm. The research further addresses feature collinearity through a combined analysis of feature importance and correlation, leading to the development of an inversion model for wave and wind parameters based on XGBoost. A comparative analysis of this model with ERA5 reanalysis and buoy data for of significant wave height, mean wave period, wind direction, and wind speed reveals root mean square errors of 0.212 m, 0.525 s, 27.446°, and 1.092 m/s, compared to 0.314 m, 0.888 s, 27.698°, and 1.315 m/s from buoy data, respectively. These results demonstrate the model’s effective retrieval of wave and wind parameters. Finally, the model, incorporating altimeter and scatterometer data, is evaluated against SAR/SWIM single and dual payload inversion methods across different wind speeds. This comparison highlights the model’s superior inversion accuracy over other methods.